Received 29 July 2016.
Accepted 14 January 2017.
THE IMPACT OF PHONETIC INFORMATION IN DIALECTOMETRY.
A CASE STUDY OF HUNGARIAN DIALECT ATLASES1 Fruzsina S. VARGHA
Eötvös Loránd University, Budapest*∗ fruzsa@gmail.com
Abstract
The present study investigates the effect of the quantity of phonetic detail contained in the transcribed data on dialectometric output. The original narrow transcriptions of Hungarian dialect atlases are gradually broadened and the similarity matrices computed with the Levenshtein algorithm from the broader forms are compared to the one corresponding to the original form. Correlations are high for the majority of investigation points, but dialect enclaves and a number of locations situated at dialect borders are exceptions. For enclaves, a phonetically sensitive matrix shows the linguistic similarity with the
“home” dialects more accurately, while a very broad transcription, lacking most phonetic details, thus more likely to reveal similarities at the lexical level, is suitable to highlight the recent impacts of the geographically close dialects. Findings on rich Hungarian dialect data and using a cost effective, computational method corroborate the results of previous studies regarding lexical vs. phonetic similarities.
Keywords
dialectometry, phonetic narrowness, dialect enclaves, Hungarian dialect atlases, correlative dialectometry
1 The research is part of the project “Dialectometric Analysis of Hungarian Dialects” (PD-108442) funded by the Hungarian Scientific Research Fund. The project was also supported by the János Bolyai Scholarship of the Hungarian Academy of Sciences.
∗* Institute of Hungarian Linguistics and Finno-Ugric Studies, Eötvös Loránd University, Budapest, Hungary.
EL IMPACTO DE LA INFORMACIÓN FONÉTICA EN DIALECTOMETRÍA.
UN ESTUDIO DE CASO DE LOS ATLAS DIALECTALES HÚNGAROS Resumen
El presente estudio investiga el efecto de la cantidad de detalles fonéticos contenidos en los datos transcritos sobre la producción dialectométrica. Las transcripciones estrictas originales de los atlas dialectales húngaros se han ampliado gradualmente y las matrices de similitud calculados con el algoritmo de Levenshtein a partir de las formas más amplias se comparan con las correspondientes a la forma original. Las correlaciones son elevadas para la mayoría de los puntos de investigación, pero los enclaves dialectales y una serie de localidades situadas en los límites del dialecto son excepciones. Para los enclaves, una matriz fonéticamente sensible muestra la similitud lingüística con los dialectos "locales" de modo más preciso, mientras que una transcripción muy amplia, carente de la mayoría de los detalles fonéticos, y por lo tanto más propensos a revelar similitudes a nivel léxico, es adecuada para resaltar los impactos recientes de los dialectos geográficamente cercanos. Los hallazgos en los valiosos datos del dialecto húngaro y el uso de un método computacional rentable corroboran los resultados de estudios previos con respecto a las similitudes léxicas y fonéticas.
Palabras clave
dialectometría, transcripción fonética estricta, enclaves dialectales, atlas dialecales húngaros, dialectometría correlativa
1. Introduction
Although dialectometry has been a widely used method for the analysis of dialect variation for many years now, and despite the increasing availability of digitized Hungarian dialect data, it has only recently been applied on this particular language area (e.g. Bodó et al. 2012; Vargha 2010). There are two main approaches in dialectometric studies. The first one is based on Goebl’s method, a map by map classification or taxation of dialect data (Goebl 1987, 2002, 2006). The other method, based on the string edit distance technique and especially on the Levenshtein algorithm, first used by Kessler on Irish dialect data (1995), has been further developed in Groningen (Nerbonne et al. 199; Heeringa 2004; Heeringa & Nerbonne 2013).
Over the last fifteen years, more than one million data instances from The Atlas of Hungarian Dialects (the national atlas), as well as several regional Hungarian linguistic
atlases have been appropriately digitized in a series of interrelated, computational dialectology projects (Figure 1). Computerized datasets are stored separately but can be integrated by a special research tool (named Bihalbocs) developed for the investigation and mapping of Hungarian dialect data.
Figure 1. Investigation points of computerized Hungarian dialect atlases.
Research on Hungarian dialects requires the availability of a special software for two main reasons: tools developed in other laboratories do not fully meet the already established, complex research needs, including the management of sound files and sociolinguistic metadata; furthermore, they do not support the Hungarian transcription system. In Hungarian linguistic tradition, a special narrow phonetic transcription is used with many diacritics. A complex symbol is constructed element by element, in an analytic way. The result appears as a single character, and behaves as a single character during editing in the dedicated application; however, it is underlyingly a string of characters. Due to its analytic nature, transcribed data can be (programmatically) manipulated and converted into a broader form, with fewer or no diacritics. These kinds of conversions, which manipulate the quantity of phonetic information included in the data, are extremely useful when searching the database of integrated atlases with the
intent to find similar but not entirely identical data instances (such as buza and búza
‘wheat’, where there is a difference in the length of the first vowel) with a single request. When lexical differences are at the center of our attention, data can be automatically simplified to such an extent that only a small part of the phonetic information remains available for searching.
The most important Hungarian dialect atlas is the national atlas, yet it does not provide an overall picture of the Hungarian language area. Hungarian dialects are spoken by autochthonous communities in as many as eight countries in Central Europe, and territories situated in present-day Romania are highly underrepresented in the national atlas. Therefore the investigation of the Hungarian language area as a whole requires the integration of the national atlas with The Atlas of Hungarian Dialects in Romania. Although the Hungarian transcription system was used in both atlases, the compilers used some modifiers and represented certain sounds (mainly diphthongs) in a slightly different way. The integration of the datasets might require the modification of the narrow transcriptions; otherwise different transcription habits could be erroneously detected as linguistic differences. Therefore, it is essential to investigate how the simplification of the original narrow transcription can affect linguistic similarity relations.
In the present study the transcriptions are gradually broadened automatically and the similarity matrices computed from the broader forms are compared to the one corresponding to the original form. The main focus is on locations where the differences in the amount of phonetic information alter the dialectometric output the most.
2. Method 2.1 Dialect data
First a regional dialect atlas, The Linguistic Atlas of Somogy and Zala Counties (at the western part of Hungary, to the south of Lake Balaton) is investigated. All the data were collected by the author, Lajos Király; therefore the transcription can be considered
highly consistent. Data were collected in 99 locations between 1980 and 1985. For the present research, data instances from as many as 204 maps were used.
The Atlas of Hungarian Dialects is also submitted to a dialectometric analysis. The atlas covers the Hungarian language area almost completely; nonetheless, the Eastern part is very poorly represented. Data were collected between 1949 and 1964 in 395 locations. For the analysis, 645 maps have been selected from a total of 1162. Although all atlas data have been appropriately digitized, not all maps could be investigated here.
The questionnaire consisted of two lists, and the one focusing on lexical variation was used in half of the locations. Only those maps are included in the analysis for which there is data at all (or nearly all) investigation points.
2.2 Data comparison techniques
Several linguistic similarity matrices are calculated with the Levenshtein algorithm.
The algorithm is used to automatically compute the phonetic distance between a pair of data instances. The Levenshtein distance is a numerical value defined as the cost of the least expensive operations needed to transform one string into another (for a detailed description of the application of this method in comparing dialect data see Heeringa 2004, Nerbonne & Heeringa 2001). From this absolute distance a normalized or relative edit distance is calculated taking into account the length of the longer word (as it is described in Nerbonne et al. 1996). This value (ranging from 0.0 in the case of two identical words to 1.0, when all phonetic symbols are different) is further transformed to show the percentage of linguistic similarity. The all-word method (Kessler 1995) is used in the analysis, which means that not only phonetic variants, but all data instances of a map are compared.
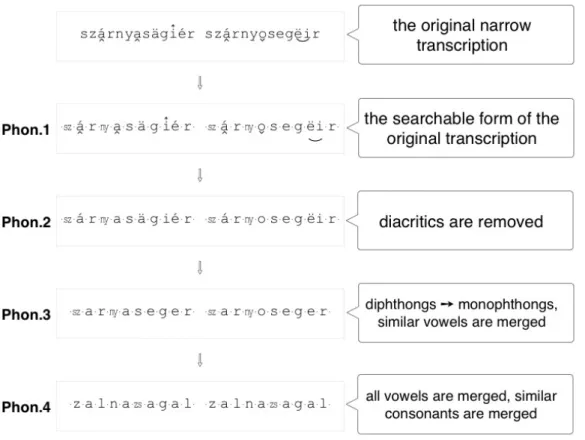
Figure 2. Transcription forms containing different amounts of phonetic information. Two phonetic variants of szárnyasegér (‘bat’) are compared.
When calculating the Levenshtein distance, the basic algorithm is used: the words to be compared are considered as plain strings, all symbols (including diacritics) are treated identically, and every transforming operation (insertion, deletion, substitution) has a cost of one. Nevertheless, several similarity matrices have been computed based on different transcription forms automatically derived from the original, phonetically narrow transcription. The basic form is named Phon.1, and it closely corresponds to the original, editable version, with some merely technical modifications, implemented in order to exclude certain “irregularities” rooted in the Hungarian alphabet. Both orthographically and phonetically, some consonants are represented with more than one letter (e.g. sz for [s]). These groups of letters are replaced with a single character to facilitate a phonetically consistent, phone-to-phone comparison. Similarly, the graphically different but phonetically identical modifiers are merged. Thus, information consistency is provided without sacrificing any phonetic detail in Phon.1. The broader versions are called Phon.2, Phon.3 and Phon.4, respectively, according to the degree of
phonetic simplifications that were applied. These different transcription forms, containing different amounts of phonetic details, are exemplified in Figure 2.
Simplifications made to the original phonetic transcription aim at giving different weigh to phonetic differences. In Phon.1, differences in diacritics count as well, thus every dissimilarity between two data instances is taken into consideration. In Phon.2, diacritics are removed, but the most salient phonetic characteristics, such as diphthongs and dialectal forms of certain vowels, are kept. Simplifications made in Phon.3 approximate the standard pronunciation by substituting the dialectal forms of certain vowels with their standard equivalent and erasing differences in vowel lengths.
However, important alternations, such as opposition between palatal and velar variants of a word (e.g. réce vs. ruca ‘duck’) are still available to the analysis. In Phon.4, transcribed data is simplified to such an extent that phonetic differences tend to disappear completely, while more important dissimilarities, typically lexical ones, persist (see Figure 3 and 4 presenting similarity degrees between data instances, in this case phonetic and lexical variants for ‘bat’, applying different degrees of phonetic simplification). Note that while a comparison of data instances in Phon.1 is sensitive to both phonetic and lexical differences, the phonetically insensitive Phon.4 is fit to assess lexical similarities.
Figure 3. Degrees of similarity (in percentage) between pairs of lexical variants in the case of the four transcription forms containing different amount of phonetic information.
Figure 4. Degrees of similarity (in percentage) between pairs of phonetic variants in the case of the four transcription forms containing different amount of phonetic information.
2.3 Correlation between matrices
Different similarity matrices, named after the transcription form they were computed from (Phon.1, Phon.2, Phon.3 and Phon.4), are compared with correlation analysis. First, Mantel-tests are performed to have a general view on the degree of similarity between Phon.1 and the other three matrices. Then Pearson-correlations are calculated in R for each location, while correlation coefficients are presented on correlation maps with Bihalbocs.
This method is inspired by Hans Goebl’s study (2005) in which he outlines the main characteristics and benefits of correlative dialectometry (dialectométrie corrélative).
Goebl used correlation maps for the comparison of matrices of different kind; for example to compare geographical distance with linguistic similarity matrices or the outcome of phonetic vs. lexical categorization in several linguistic atlases.
3. Results
3.1 Effects of the amount of phonetic information in the regional atlas
In the case of the regional atlas, four Levenshtein-based similarity matrices were compared: the one generated from the original narrow transcription and its automatically simplified broader forms. For a general comparison of the matrices based on the different transcription forms, Mantel’s test was performed. Not surprisingly, the matrices computed from the simplified versions of the original narrow transcription
correlate highly with the one based on the original form. The correlation coefficients between Phon.1 and the other matrices, Phon.2, Phon3. and Phon.4 are 0.9733436, 0.8472635, 0.821747, respectively. The high correlations suggest that even an overall simplification of the transcription has little effect on the results of the dialectometric analysis in the case of a relatively small regional atlas, where no dialect islands can be identified.
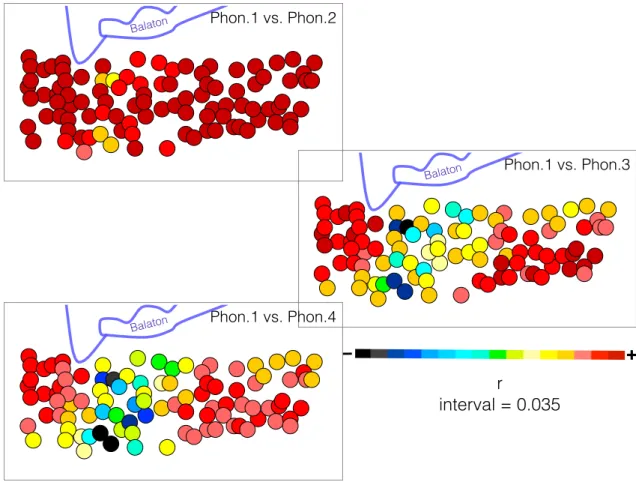
Figure 5. Correlation maps of The Linguistic Atlas of Somogy and Zala Counties. Correlations between the matrix computed from the original narrow transcription and the three other matrices based on simplified versions of the original transcription. Higher correlation coefficients appear in red or orange, feeble correlation is represented with blue, grey or black.
However, when presented on correlation maps (Figure 5), some locations close to the border of Somogy (to the east) and Zala (to the west) counties, show considerable geographic difference in their linguistic similarity relations, especially if Phon.1 is compared to Phon.3 or Phon.4. Although the borders of the county changed slightly in
+–
r
interval = 0.035 Phon.1 vs. Phon.2
Balaton
Phon.1 vs. Phon.3
Balaton
Phon.1 vs. Phon.4
Balaton
the past, roughly the western third of the atlas territory can be considered to belong to Zala historically.
The locations that alter their similarity relations tend to be more alike with the locations found in the eastern part when matrices Phon.1 or Phon.2 are applied, but they became more similar to the locations in the western part when matrices Phon.3 or Phon.4 are mapped. Figure 6 shows the linguistic similarity maps for one of these investigation points, Nemesdéd; locations with higher linguistic similarity appear in red, while settlements with less similar dialects are represented with green, blue and black, as indicated in the color scale. For the sake of comparability among maps a constant interval of eight localities was applied. As transcriptions of different degrees of narrowness are behind the four matrices, the quantity of phonetic information involved must have a considerable effect on linguistic similarities, at least in some cases.
Figure 6. Geographic patterns of linguistic similarity of a selected investigation point near the border of Somogy and Zala counties. On each map locations change their colors by eight from red to dark blue, according to the color scale.
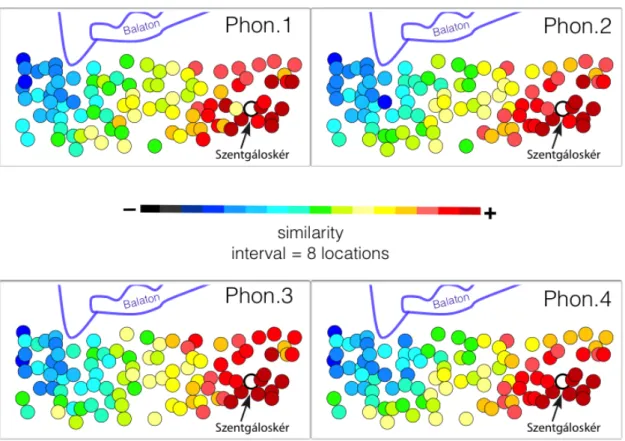
Differences between similarity matrices presented on reference point maps above (Figure 6) only characterize certain points situated close to the border of Somogy and Zala counties. By contrast, for the big majority of locations, maps show highly similar patterns, independently of the amount of phonetic details involved in the data comparison process, as in the case of Szentgáloskér (Figure 7).
Figure 7. Reference point maps of Szentgáloskér, a location with nearly identical geographic patterns of linguistic similarity. On each map locations change their colors by eight from red to dark blue, according to the color scale.
3.2 Effects of the amount of phonetic information in the national atlas
The same analysis was performed on the national atlas of Hungarian dialects. Four different matrices were computed based on different transcription forms, three of them are the automatically simplified versions of the original narrow phonetic transcription.
Matrices are named according to the amount of phonetic detail preserved in the transcription. The matrix based on the original narrow transcription is called Phon.1, the
ones computed from the broader transcription forms are called Phon.2, Phon.3 and Phon.4, similar to the above case of the regional atlas.
The main difference between the two atlases is in the density of investigation points (only every tenth location was investigated in the national atlas) and in the territory they cover. The whole Hungarian language area, roughly covered by the national atlas, is dialectologically less homogenous because of inland migrations:
settlement history might be reflected in the similarity patterns.
For a general comparison of the matrices based on the different transcription forms, Mantel’s test was performed. Correlation coefficients between Phon.1 and the three other matrices are: 0.8740297, 0.8013746 and 0.78947, respectively. Correlations are high, but not quite as high as the ones obtained for the regional atlas, especially between Phon.1 and Phon.2. When correlations between different matrices are represented on maps, Phon.1 and Phon.2 appear to be nearly identical in the case of the majority of the locations (Figure 8). However, there are some points that show some differences in the case of Székely Land (Székelyföld, also called Szekler Land, corresponding to the easternmost locations), in the southern part and at the northwestern part of the territory. Further simplifications on the phonetic transcription (Phon.3) lead to more feeble correlations with Phon.1, especially in Székely Land, where investigation points turn to black (Pearson’s r is between 0.34 and 0.188), as it is mapped on Figure 9.
Figure 8. Correlation map comparing Phon.1 and Phon.2. The highest correlations are between 1 and 0.965, every color step corresponds to 0.035.
Figure 9. Correlation map comparing Phon.1 and Phon.3.
Overall phonetic simplifications of the transcription (Phon.4) affect some locations in the north-western region and in the south-western region more, while there is no
+–
r interval = 0.035
+–
r interval = 0.035
considerable change in Székely Land compared to the previous map, black dots’
correlation coefficients are between 0.483 and 0.299 (Figure 10).
Figure 10. Correlation map comparing Phon.1 and Phon.4.
The three correlation maps presented above show, as a general rule, that the majority of locations, especially in the westernmost region, do not alter their similarity behavior, few locations have a Pearson correlation lower than 0.7, even if Phon.1 is compared to Phon.4.
+–
r interval = 0.035
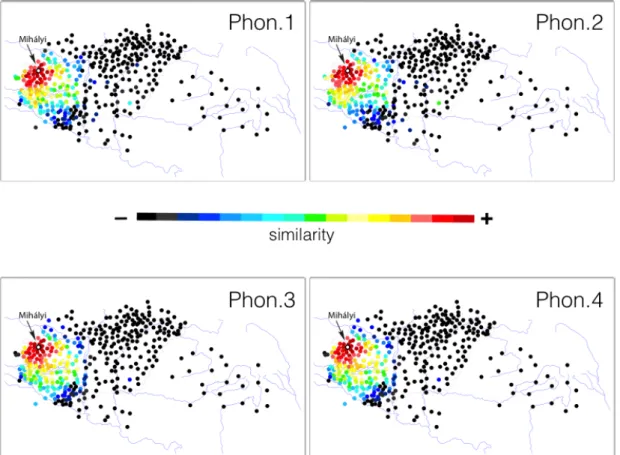
Figure 11. Geographic patterns of linguistic similarity of Mihályi, a location in a region with a constant population over the past thousand years, not subjected to the influence of dissimilar dialects. Locations are colored by ten from red to black according to the color scale.
To compare locations with higher vs. lower Pearson correlation, individual reference point maps were created for a number of locations (Figures 11 to 14). The linguistically closest locations appear in red, while colors gradually turn into blue or black, according to the color scale, as the linguistic distance grows. One interval is equal to ten locations, so the ten linguistically closest locations of the selected point appear in dark red, the next ten appear in light red, and the other locations are also colored by ten, until black is reached. This setting is the same on all maps, providing comparability and also enables focusing on the most similar locations, as more than half of the points appear in black.
The first example was chosen from the westernmost region that shows nearly constant geographic patterns of linguistic similarity regardless of the amount of simplifications made to the transcription (this is a region with a constant population over the last one thousand years or so). Selecting Mihályi, a location situated far from
dialect borders, the four similarity maps, generated from different matrices, appear to be almost identical (Figure 11). Mihályi’s similarity patterns do not change even if crude simplifications are performed on the data. Pearson correlations between sets of Mihályi’s similarity values, comparing Phon.1 to the other matrices (Phon.2, Phon.3, Phon.4) are very high: 0.9764937, 0.9489199 and 0.9189307, respectively.
The second example illustrates a completely different situation. Correlations between matrix Phon.1 (based on the original narrow transcription) and Phon.3 or Phon.4 may be lower at dialect borders, not only in the regional atlas, but also in the national atlas. Vága, an investigation point in the north-western corner of the language area, at the eastern edge of the northern (palóc) dialect area, shows categorically different similarity patterns when considerable modifications are made to the narrow transcription. Correlations between Phon.1 and the three other matrices, as far as Vága is concerned, are as follows: 0.8906942, 0.6790412 and 0.5546758.
Slight modifications of the original transcription do not affect Vága’s similarity patterns considerably. However, when stronger simplifications are applied, red colors, meaning higher correspondences, move definitely from the east (where the location belongs to based on the traditional classification) to the west (Figure 12).
Figure 12. Geographic patterns of linguistic similarity of Vága, a location situated at a dialect border. Locations are colored by ten from red to black according to the color scale.
Observing the geographic patterns of linguistic similarity of another location, Csíkrákos, situated in the historical region of Székely Land, in the east, the four maps appear to be crucially different (Figure 13). It has to be noted that this dialectologically complex region is considered to be historically related to different dialect regions in the western part of the language area (the Transdanubia), although there are no reliable written sources about settlement history.
When using the original narrow transcription, similar dialects appear in red in the western part, around Lake Balaton. In contrast, with the crude simplification of the phonetic transcription, geographically closer locations become the most similar, and geographically distant ones now appear in black or dark blue. Four investigation points in the south-western part appearing in red even on the fourth map represent Székely settlers from Bukovina, resettled from the eastern part of the language area less than a decade before data collection.
Figure 13. Linguistic similarity maps of Csíkrákos, a location with historical ties to Transdanubia (western Hungary).
Figure 14. Linguistic similarity maps of Zágon, a location with historical ties to Transdanubia (western Hungary).
Examining the Pearson correlations between the linguistic similarity scales of Csíkrákos (0.8040350, 0.4767810 and 0.4832751 when Phon.1 is compared to Phon.2, Phon.3 and Phon.4, respectively), the deletion of diacritics already has a noteworthy effect. However, the relatively high correlation coefficient (greater than 0.8) does not entirely reflect the considerable differences between the geographic patterns (Phon.1 vs. Phon.2 at Figure 13). Even more accentuated phonetic simplification leads to a very feeble correspondence between the original and the simplified matrices.
Another location from Székely Land, Zágon, shows a similar behaviour as Csíkrákos (Figure 14). When the phonetic details are diminished in the data, the geographic patterns of linguistic similarity of Zágon change completely. Pearson correlations between sets of Zágon’s similarity values, comparing Phon.1 to the other matrices (Phon.2, Phon.3, Phon.4) are 0.7559224, 0.2463932 and 0.3139797, respectively.
To present the example of a dialect enclave, the two upper maps on Figure 15 are proposed to show the geographic patterns of linguistic similarity of Kupuszina, situated in the southern part (but presumably resettled from the north). Only the maps generated from the analysis of the original and of the broadest transcription form are given here. Reference point maps of Kupuszina can be compared to the ones of Ecseg (the bottom of Figure 15), a location with a similar dialect background, but situated at the north and far from dialect borders, thus without any influence of dissimilar dialects.
The two maps generated from the matrix based on the original narrow transcription (Phon.1) are highly similar (on the left side of Figure 15), contrary to the ones generated from Phon.4 (on the right), since the latters look crucially different. While in the case of Ecseg Phon.1 and Phon.4 show a similar picture, for the enclave the area of most similar locations moves to the south: geographically closer locations become more similar in Phon.4.
Figure 15: Dialectometric maps of a dialect enclave (Kupuszina, upper maps) and of a location with similar dialect background, but surrounded by similar dialects (Ecseg, lower maps).
The Pearson correlations between Phon.1 and the other matrices in the case of the locations presented in Figure 8 are 0.9121604, 0.7411047, 0.6510349 for Kupuszina (the dialect enclave), and 0.9350759, 0.8353634, 0.8513868 for Ecseg.
4. Discussion
Most of the locations in both the regional and the national atlas do not show considerably different linguistic similarity patterns when the transcription underlying the analysis is broadened. However, in the proximity of dialect borders and in the case of special locations, such as dialect enclaves (or speaker communities that have moved to a different dialect area), a matrix based on a phonetically detailed transcription more accurately shows the linguistic similarity with the “home” dialects, that is with the dialect area they are historically related to. In contrast, a broad transcription, lacking
most of the phonetic details, thus more likely to reveal similarities at the lexical level, is suitable to highlight the recent impacts of the geographically close dialects.
There are many locations with special settlement history in the Hungarian language area. Dialectometry seems to be a useful research tool for finding geographically distant but linguistically related dialects. However, a more accurate form of the transcription is more suitable to highlight such correspondences. Therefore, the findings are compatible with the view that the phonetic qualities (especially vocalic qualities) characteristic to a given dialect are more resistant to diachronic change and less prone to be influenced by neighboring dialects than other components of the linguistic system such as the lexicon. This is also in line with the practice that dialect classifications are mostly based on phonetic characteristics rather then lexical correspondences.
Findings are also compatible with the results of other dialectometric studies. The maps comparing the similarity patterns of enclaves based on matrices computed from different transcription forms are highly comparable to Goebl’s maps presenting the different dialectometric impacts of two separate linguistic categories, the phonetic and the lexical, in the case of dialect enclaves. Guardia Piemontese, an investigation point of the Italian linguistic atlas in Calabria, has its closest matches among the dialects of the Western Alps, but only phonetically. Lexically it does not differ from the neighboring Calabrian dialects (Goebl 2008: 61-62). Goebl (2006: 444) also notes that the linguistic island of ALF point 635, Andraut, has preserved its Northern French phonetic character, but made considerable lexical concessions to its new Gascon environment.
Geographically close locations become more similar in the case of dialect enclaves in matrix Phon.4 (Figure 13, 14 and 15). This is also compatible with previous studies.
Comparing phonetic and lexical matrices with Euclidean distances, Goebl (2012: 159) points out that, because of the relatively fast adaptation of the lexicon to the new linguistic environment, geographical distance correlates more with lexical distance in the case of dialect enclaves. Pickl et al. (2013) also found that geographical distance correlates better with lexical distance than with morphological and phonetic distances, especially in the case of those location pairs that are separated by a dialect barrier, the
distance correlates considerably more with morpho-lexical distance than with phonetic distance (Montemagni 2008). According to a dialectometric study, comparing the answers of older male and young female Dutch dialect speakers, Heeringa & Hinskens (2011) found that the lexical level was most affected by dialect change.
In the proximity of dialect borders locations might show different similarity patterns if a phonetically precise or a largely simplified transcription is analyzed. These results coincide also with the results of other studies comparing phonetic and lexical similarities: around sharp dialect borders phonetic and lexical matrices correlate less (Goebl 2005).
5. Conclusion
With the automatic simplifications made to computerized dialect datasets the effect of the phonetic accuracy on the dialectometric analysis were tested. The results suggest that slight modifications of the original transcription form (such as the removal of diacritics) do not affect the similarity relations between the investigation points considerably. However, more important changes in the transcription do heavily modify dialect similarities in some special cases: some locations situated at dialect borders and locations with less typical settlement history, such as dialect enclaves. In the proximity of dialect borders the possible linguistic influence of nearby big towns should be further investigated. Most of the investigation points are in regions with more stable settlement patterns (no considerable inland migration in the past several centuries), and they do not react considerably to these kinds of modifications. These findings on Hungarian dialects, involving the automatic simplifications of the original narrow transcription, are highly compatible with the results of some previous dialectometric studies, based on manual classifications, comparing phonetic and lexical similarities. Thus, dialectometric techniques based on automatic modifications of narrow transcriptions can be seen as a cost-effective yet reliable tool for the comparison of similarity patterns associated with different kinds of dialect features: lexical versus phonetic or consonantal versus vocalic.
References
BODÓ, Csanád, Fruzsina S. VARGHA & Domokos VÉKÁS (2012) “Classifications of Hungarian dialects in Moldavia”, in Lehel Peti & Vilmos Tánczos (eds.), Language Use, Attitudes, Strategies:
linguistic identity and ethnicity in the Moldavian Csángó villages, Cluj-Napoca: The Romanian Institute for Research on National Minorities, 51-69.
DEME, László & Samu IMRE (eds.) (1968–1977) A magyar nyelvjárások atlasza. I–VI. [The atlas of Hungarian dialects], Budapest: Akadémiai Kiadó.
GOEBL, Hans (1987) “Points chauds de l’analyse dialectométrique: pondération et visualisation”, Revue de Linguistique Romane, 51(1), 63-118.
GOEBL, Hans (2002) “Analyse dialectométrique des structures de profondeur de l'ALF”, Revue de linguistique romane, 66(1), 5-63.
GOEBL, Hans (2005) “La dialectométrie corrélative. Un nouvel outil pour l’étude de l’aménagement dialectal de l’espace par l’homme”, Revue de linguistique romane, 69(2), 321-367.
GOEBL, Hans (2006) “Recent advances in Salzburg dialectometry”, Literary and Linguistic Computing, 21(4), 411-435.
GOEBL, Hans (2008) “La dialettometrizzazione integrale del’AIS. Prezentazione dei primi risultati”, Revue de Linguistique Romane, 72, 25-113.
GOEBL, Hans (2012) Introduction aux problèmes et méthodes de l’École dialectométrique de Salzbourg (avec des exemples gallo-, italo- et ibéroromans), in Xosé Afonso ÁlvarezPérez, Ernestina CARRILHO & Catarina MAGRO (eds.), Proceedings of the international Symposium on Limits and Areas in Dialectology (LimiAr), Lisbon, 2011, Lisboa: Centro de Lingüística da Universidade de Lisboa, 117-166.
HEERINGA, Wilbert (2004) Measuring Dialect Pronunciation Differences using Levenshtein Distance, Groningen: Groningen Dissertations is Linguistics.
HEERINGA, Wilbert & Frans HINKSENS (2011) “The Measurement of Dutch Dialect Change: Lexicon versus Morphology versus Sound Components”, Taal en Tongval, 63(1), 79-98.
HEERINGA, Wilbert & John NERBONNE (2013) “Dialectometry”, in Frans HINSKENS & Johan TAELDEMAN (eds.), Language and Space. An International Handbook of Linguistic Variation, Volume III: Dutch (Handbook of Linguistics and Communication Science (HSK) 30/3), Berlin
& New: York Walter de Gruyter, 624-646.
KESSLER, Brett. (1995) “Computational dialectology in Irish Gaelic”, in Proceedings of the 7th Conference of the European Chapter of the Association for Computational Linguistics, Dublin: EACL, 60-67.
NERBONNE, John, Wilbert HEERINGA, Eric VAN DEN HOUT, Peter VAN DE KOOI, Simone OTTEN & Willem
VAN DE VIS (1996) “Phonetic Distance between Dutch Dialects”, in DURIEUX, Gert, Walter DAELEMANS & Steven GILLIS (eds.), CLIN VI: Papers from the Sixth CLIN Meeting, Antwerp:
Centre for Dutch Language and Speech (UIA), 185-202.
NERBONNE, John & Wilbert HEERINGA (2001) “Computational comparison and classification of dialects”, Dialectologia et Geolinguistica, 9, 69-83.
KIRÁLY, Lajos (2005) Somogy–zalai nyelvatlasz. [The linguistic atlas of Somogy and Zala counties], Budapest: Magyar Nyelvtudományi Társaság.
MONTEMAGNI, Simonetta (2008) “The space of Tuscan dialectal variation. A correlation study”, International Journal of Humanities and Arts Computing, 2(1-2), 135-152.
PICKL, Simon, Aaron SPETTL, Simon PRÖLL, Stephan ELSPAß, Werner KÖNIG & Volker SCHMIDT (2014)
“Linguistic distances in dialectometric intensity estimation”, Journal of Linguistic Geography, 2(1), 25-40.
VARGHA, Fruzsina S (2010) “A dialektometria alkalmazása és történeti helynevek nyelvföldrajzi vizsgálata a Székelyföldön”, Helynévtörténeti Tanulmányok, 5, 223-233.