Measurement 178 (2021) 109385
Available online 19 April 2021
0263-2241/© 2021 The Author(s). Published by Elsevier Ltd. This is an open access article under the CC BY-NC-ND license
(http://creativecommons.org/licenses/by-nc-nd/4.0/).
Characterization of polylactic acid-based nanocomposite foams with supercritical CO 2
B ´ alint Morlin
a, Katalin Litauszki
a, Roland Petr ´ eny
a, Akos Kmetty ´
a,b, L ´ aszl ´ o M ´ esz ´ aros
a,b,*aDepartment of Polymer Engineering, Faculty of Mechanical Engineering, Budapest University of Technology and Economics, M˝uegyetem rkp. 3, H-1111 Budapest, Hungary
bMTA–BME Research Group for Composite Science and Technology, M˝uegyetem rkp. 3, H-1111 Budapest, Hungary
A B S T R A C T
In this research, we physically foamed semicrystalline polylactic acid filled with montmorillonite, carbon nanotubes, and halloysite nanoparticles. In the case of polymer foams, their density and compressive strength are important parameters. Although the specific compressive strength calculated as the ratio of the two is a good indicator of the use of polymeric foams, few researchers use this ratio for classification. We have shown that the presence of nanoparticles has a positive effect on this parameter, especially with the use of 3 wt% halloysite, when this value increased from 12.07 ±7.5 [MPa/(g/cm3)] to 20.89 ±1.75 [MPa/(g/cm3)], i.e., by more than 70%. In general, the presence of nanoparticles reduced the standard deviation of this ratio. Regardless of the nanoparticles used, the average cell diameter decreased compared to that of the reference material. The results were explained with the cell nucleating ability of halloysite.
1. Introduction
Environmentally friendly materials from renewable sources are coming to the fore [1]. One of the most promising and most researched polymers is polylactic acid (PLA) [2,3]. Conventional plastic foams such as expanded polystyrene (EPS) can be replaced with foamed bio- polymers, but for this purpose, the properties of the biopolymers should be modified with additives. Advantages of using foams include reduced polymer content, lower density, good thermal and sound insulation properties, increased mechanical vibration damping, reduced water vapor permeability, and reduced moisture uptake in the case of closed cells [4–6]. Polymeric foams can also be applied as core materials in fiber-reinforced polymer sandwich structures [7]. Foaming is possible by different methods, which can be divided into two main types: phys- ical and chemical foaming [4,8]. Care must be taken to ensure that the foaming of biopolymers is as environmentally friendly as possible. From this point of view, physical foaming is superior to chemical foaming.
Another significant advantage of physical foaming is that it can produce much lower foam density than expandable microbeads [9] or chemical foaming [10] (<0.4 g/cm3). Of the physical foaming agents, the use of supercritical CO2 (sc-CO2) is highly preferred. Unlike butane and pentane, CO2 is non-flammable and chemically inert. The foam prop- erties can be adjusted with the production parameters, and the degree of crystallinity can also be influenced by the formation of foam [4,11–13].
PLA is typically made into rigid foams due to its fundamentally brittle behavior. For such foams, strength, especially compressive strength, is essential in engineering applications. One possible way to increase this is to create composites with nanoscale reinforcements.
Nanoparticles improve the mechanical properties (strength, modulus, dynamic properties) of foam structures, but depending on the type of nanoparticle, electrical and thermal conductivity, flame retardancy, gas barrier properties, magnetic properties, and thermal stability. The excellent mechanical properties of polymer nanocomposites are due to the favorable intrinsic properties of the reinforcing materials and their high specific surface area because of their small size. However, this is also why it is difficult to adequately distribute them in the matrix [4,14,15].
Clay minerals and carbon nanotubes are often used to modify the properties of foams [15]. Montmorillonite is the most commonly used naturally occurring clay. It has a layered structure and is mined in many places worldwide [16]. Clays also include halloysite, which has been little used in foams previously. These are tubular nanoparticles that are 0.5–2 μm long, and have an outer diameter of about 50–100 nm and an inner diameter of 15–35 nm. [17]. Carbon nanotubes have a diameter of 4–30 nm and far batter mechanical and physical properties than hal- loysite, and they have outstanding electrical and thermal conductivity as well [18–20]. It is important to note that these nanoparticles can modify the crystallization characteristics of PLA in different ways and
* Corresponding author at: Department of Polymer Engineering, Faculty of Mechanical Engineering, Budapest University of Technology and Economics, M˝uegyetem rkp. 3, H-1111 Budapest, Hungary.
E-mail address: meszaros@pt.bme.hu (L. M´esz´aros).
Contents lists available at ScienceDirect
Measurement
journal homepage: www.elsevier.com/locate/measurement
https://doi.org/10.1016/j.measurement.2021.109385
Received 27 November 2020; Received in revised form 25 March 2021; Accepted 1 April 2021
significantly, which has a considerable effect on material properties [13,21].
From the literature review, it is clear that using nanoparticles in PLA foams can lead to enhanced properties, like increased compressive strength. Nanoparticles have an indirect effect on the properties of the foams, as they change the crystalline proportion of PLA and can also have a cell nucleating effect during foaming. Although several studies have addressed examining the impact of individual nanoparticles, no research has focused on producing nanocomposite foams using the same foaming method but using different nanoparticles for the same matrix material. In this case, we can distinguish between effects that depend on the presence of nanoparticles and those that depend on the type of nanoparticles. Our aim is to investigate the impact of montmorillonite- filled, halloysite-filled, and carbon nanotube-filled polylactic acid on sc-CO2 foaming and the properties of the resulting foam structures.
2. Materials and methods 2.1. Materials
As matrix material, we used NatureWorks Ingeo 8052D polylactic acid (PLA) recommended for extrusion. It has a melting point of 153.3 ◦C, a melt flow index of 7 g/10 min (2.16 kg, 190 ◦C), and a density of 1.24 g/cm3, as measured by the authors. We used three types of nanomaterials as reinforcement: Cloisite® 20A Organophilic phyllo- silicate (MMT), halloysite (HAL), which was acquired from Sigma- Aldrich (Product Number: 685445), and NANOCYL® NC7000 ™ car- bon nanotube (CNT).
2.2. Manufacturing methods
We dried the raw materials at 80 ◦C for 8 h before processing. The nanomaterials were dried in a Sheldon 1465_VAC (Sheldon Manufacturing Inc., USA) vacuum dryer, while the PLA matrix in a Heraeus UT6 oven (Heraeus Holding GmbH., Germany). Subsequently, we produced composites containing 0.5, 1.0, and 3.0 wt% nanoparticles using a Labtech Scientific LTE 26–44 (Labtech Engineering Co., Ltd., Thailand) twin-screw extruder, and granulated the resulting cord product. In the extruder, the screw speed was 30 1/min, and the zone and die temperatures from the hopper were as follows: 175; 175; 175;
180; 180; 180; 185; 185; 185; 190; 190 ◦C.
We dried the resulting nanocomposites at 80 ◦C again for 8 h before foaming (Hareus UT6, Heraeus Holding GmbH, Germany). Foaming was performed with a Collin Teach Line ZK25T twin-screw extruder (Dr.
Collin GmbH, Germany) with constant volume supercritical CO2. The zone temperatures from the hopper were 160, 165, 170 and 170 ◦C, and we varied screw speed (nscrew), material temperature (Tmelt) and CO2
injection pressure (pinj) to obtain a foam of adequate quality. We also measured the pressure at the cord die (pdie). Table 1 shows the param- eters of successful foaming.
2.3. Testing methods
Before foaming, we measured the melt flow index (MFI) of each sample with a CEAST Modular Melt Flow 7027.000 (Instron, USA) machine on three samples. The load was 2.16 kg, and barrel temperature was 190 ◦C.
We investigated the cell structure of the foams and the distribution of the reinforcing materials by scanning electron microscopy (SEM). We broke the samples after cooling them with liquid nitrogen and then sputter coated and examined them with a JEOL JSM-6380LA electron microscope (Jeol Ltd., Japan) at multiple magnifications (30-10000x).
During foam production, the process of cell nucleation can be clas- sified by cell population density [22]. Cell population density is calcu- lated according to Equation (1).
Nc= (nM
A )3
2
∙ 1
1− Vf (1)
where n is the number of cells counted in the recorded image, M [-] is the magnification factor of the micrograph, A [cm2] is the cross-section area of the sample and Vf [–] is the void fraction.
We used the SEM images of the cryogenic fracture surface of the samples to determine cell diameter manually. Cell diameter is the dis- tance between the two furthest points of the cell, which we measured with the ImageJ software. Then we calculated the mean and standard deviation of the measured cell diameters.
We measured the crystalline fraction and thermal properties of the foams on a TA Instruments Q2000 DSC (TA Instruments, USA) machine.
A heat-cool-heat cycle was used in the range of 0–200 ◦C at a rate of 5 ◦C/min. The weight of the samples was 3–6 mg; the samples were measured in an aluminum sample holder and a nitrogen gas measuring medium. The gas flow rate was 50 ml/min. The density of the foam samples was determined according to Equation (2).
ρ=m
V (2)
where ρ [g/cm3] is the density of the sample, V [cm3] is the volume of the sample, which was calculated with the average of the diameters measured at 5 points on a 10 mm long piece, m [g] is the mass of the sample, which was measured with an analytical scale (Ohaus Explorer E01140). We determined density from the average of the measured masses and volumes of three samples in each case.
The compressive strength of the samples for 10% deformation was determined with a computer-controlled tensile tester type Zwick Z005 (Zwick, Germany, Zwick TestXpert II 3.41 program), equipped with a force measuring cell with a measuring range of 5 kN (Mess & Regel- technik KAP-TC, Germany). We calculated compressive strength from the measured maximum force and the cross-sections used for density measurement.
3. Results and discussion
3.1. Test results for the compounded materials
The rate of nanoparticle dispersion during compounding is con- nected to the change in the material’s flowability, i.e., the MFI. With better dispersion, the MFI decreases as polymer molecules’ relative motion to each other becomes more inhibited as they bind to or get entangled with nanoparticles [23]. This phenomenon can also be observed for compounds containing CNT (Fig. 1). It means that dispersing the nanoparticles by extrusion was effective, although ag- gregates remained when nanoparticle concentration was 3 wt%, which was confirmed by SEM images.
With the other two nanoparticles, the MFI was higher in all cases compared to the matrix. In polyesters, the presence of moisture during processing can lead to hydrolysis, which is a process associated with a decrease in molecular weight and an increase in MFI [24,25]. Although Table 1
Production parameters of the foams.
Nanoparticle
content nscrew [1/
min] Tmelt
[◦C] pinj
[bar] pdie
[bar]
PLA – 5 130 120 170
MMT 0.5 wt% 20 116 100 150
1 wt% 15 125 85 100
3 wt% 13 115 115 130
HAL 0.5 wt% 10 125 95 100
1 wt% 10 135 120 150
3 wt% 10 125 170 200
CNT 0.5 wt% 10 125 65 85
1 wt% 10 138 115 135
3 wt% 10 130 80 120
both MMT and HAL were dried before processing, the molecularly bound moisture remaining in them may still have caused degradation of the polylactic acid. In the case of MMT, this was significant, while in the case of HAL, it did not change substantially after an initial increase.
Based on these, it is likely that the dispersed HAL nanoparticles compensated for the effect of degradation.
3.2. Investigation of the foam structures 3.2.1. Foam structure morphology
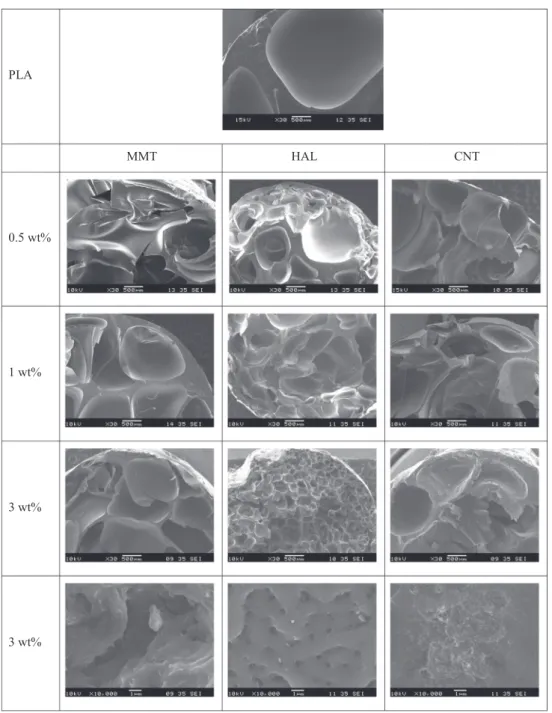
After foam production, we investigated the foam structures by scanning electron microscopy (Fig. 2). No aggregates were found on the fracture surfaces for the 0.5 wt% and 1 wt% nanoparticle-filled samples, which does not necessarily mean that they were not present in the ma- terial but that the aggregates were not the starting points of the fracture.
I.e., even if there were aggregates in the material, they cooperated well with the matrix. In the case of samples filled with 3 wt% nanoparticles, 0
2 4 6 8 10 12 14 16
0.0 0.5 1.0 1.5 2.0 2.5 3.0
MFI [g/10 min]
Nanoparticle content [wt%]
HAL MMT CNT
Fig. 1. MFI as a function of filler content.
PLA
MMT HAL CNT
0.5 wt%
1 wt%
3 wt%
3 wt%
Fig. 2. SEM images of each sample produced.
smaller aggregates can be found on the fracture surfaces.
We used SEM images at lower magnification (30x) to characterize the cell structure of the foams. The images showed that there were a small number of nucleated cells in the reference sample, and at the same time, the size of the cells was large. The reference foam structure we manufactured showed that the degree of nucleation and the homoge- neity of the foam structure were less favorable than the results reported by Bocz et al. [12]. The reason for the difference is presumably due to the different type of PLA (Ingeo 3052D) and the difference in the applied production temperature profile. The addition of CNT or MMT did not cause significant changes compared to the reference material. There were spectacularly more nucleated cells and more homogeneous cell structures with the addition of 1 wt% and 3 wt% of HAL, the effect of which was seen in terms of density and mechanical properties as well.
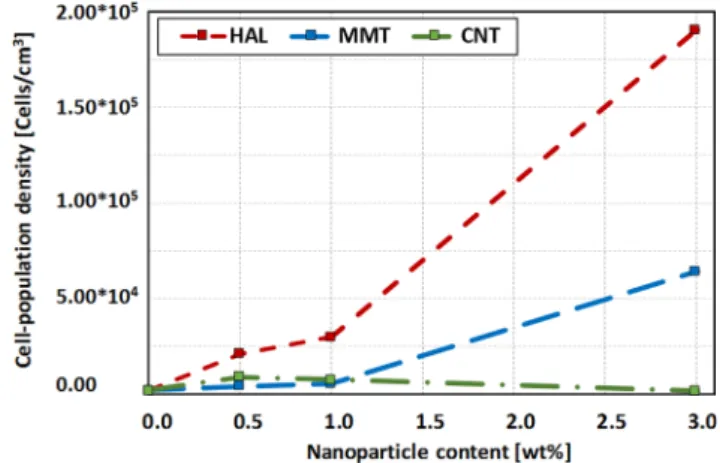
During the production of foam structures, we classified the success of nucleation by cell population density. The SEM images showed that the reference foam contained a small number of large cells. Cell population density (Fig. 3) showed an increasing trend with increasing HAL and MMT content. This is because the nanoparticles in the system were able to promote heterogeneous cell nucleation [26]. HAL nucleated the largest amount of cells (1.90x10⁵ cells/cm3) at 3 wt%. CNT behaved differently. 0.5 and 1 wt% CNT caused a small increase in cell popula- tion, but 3 wt% CNT produced a lower cell population density (1.72x10³ cells/cm3) than the reference (1.90x10³ cells/cm3).
We characterized the process of cell growth and stabilization by average cell diameter, and the homogeneity of the foam structure by the standard deviation of average cell diameter (Fig. 4). Average cell diameter decreased in all cases compared to the reference foam structure (2.06 ±0.63 mm). Where the number of nucleated cells was low, larger cells were formed. Conversely, where heterogeneous cell nucleation was more successful due to the better dispersion of the nanoparticles, smaller cells were formed due to the amount of gas used to grow the cell. It is because nanoparticles increase melt strength and reduce material flow in the polymer melt through diffusion [27]. The foam structure filled with 3 wt% HAL had the highest cell population density (1.90x10⁵ cells/
cm3), the smallest average cell diameter (0.26 mm) and the lowest standard deviation of cell size (0.11 mm).
3.2.2. Differential scanning calorimetry
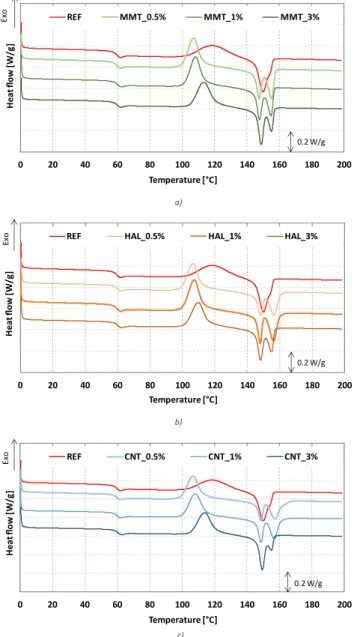
The presence of nanoparticles significantly lowered the temperature of cold crystallization, and cold crystallization took place in a narrower temperature range. It can be explained with the fact that the nano- particles used have higher thermal conductivity than the matrix mate- rial. Besides, for foams containing MMT and CNT, the peaks shifted toward increasing temperatures with increasing nanoparticle content (Fig. 5). It means that more energy was needed for the molecules to become sufficiently mobile for crystallization, which can be due to the stronger connection between molecules and nanoparticles. This phe- nomenon also appeared in the heat flow step at the glass transition temperature (Table 2). It decreased in these cases, i.e. as nanoparticle content increased, fewer molecules participated in glass transition. It was not characteristic for materials containing HAL; the molecular level relationship between the polymer and the nanoparticle was the weakest in this case, and this is advantageous for foaming, as sc-CO2 can accu- mulate more easily on the surface of the nanoparticles. In general, the presence of nanoparticles also contributed to the formation of more stable α-type crystallites at the expense of less stable α’ crystallites, and crystallinity was typically 3% higher than that of the reference material.
3.2.3. Mechanical tests
Cell structure greatly influenced the mechanical properties of the foam structures. The number of cells and cell size determine one of the most important foam property—density. Compared to the density of the reference foam (0.19 g/cm3), the density of the systems filled with nanoparticles was higher, with one exception (Table 3). With MMT, density did not increase very much compared to the reference. CNT
caused a greater increase in density, and HAL caused an even greater increase. It is particularly important that the density-specific compres- sive strength was the highest for foams containing HAL, due to the favorable foam structure and the reinforcing effect of the nanoparticles.
If we compare the materials we produced to commercially available EPS foams, we can say that we can say that we got approximately one order of magnitude higher densities (ρEPS ~ 0.02 g/cm3). However, in terms of specific compressive strength, the composites we produced performed better than EPS, which has a typical compressive strength of ~ 5 MPa/
(g/cm3) [28,29].
4. Conclusions
In this research, we successfully produced foams with a polylactic acid matrix and carbon nanotube, halloysite nanotube and montmoril- lonite nanoparticle reinforcement using sc-CO2.
• SEM images showed that the dispersability of halloysite was the best.
In the case of carbon nanotubes and montmorillonite, we found ag- gregates at higher particle contents. Besides, the MFI of foams with montmorillonite decreased; in this case, significant degradation of the matrix occurred.
• Based on the DSC results, it can be said that regardless of the nano- particle used, the crystalline proportion increased, and the cold crystallization temperature decreased.
• DSC also showed that the nanoparticle–matrix relationship was the weakest in the case of halloysite, but this was advantageous during foaming as it increased the cell nucleating capability of the Fig. 3. Cell population density of foam structures as a function of the amount of nanoparticles.
0.0 0.5 1.0 1.5 2.0 2.5 3.0
0.0 0.5 1.0 1.5 2.0 2.5 3.0
Average cell diameter [mm]
Nanoparticle content [wt%]
MMT CNT HAL
Fig. 4.Average cell diameter of foam structures as a function of the amount of nanoparticles.
nanoparticles. It was also reflected in cell population density, which was far higher than that of the other materials and was also associ- ated with a small average cell diameter.
• In the compression test, we found that although the halloysite-filled system had the highest foam density, it still had the highest density- specific compressive strength. In general, the presence of nano- particles reduced the standard deviation of the specific compressive strength.
CRediT authorship contribution statement
Balint Morlin: ´ Investigation, Writing - original draft. Katalin Litauszki: Investigation, Writing - original draft, Visualization. Roland Petr´eny: Writing - original draft. Akos Kmetty: ´ Conceptualization, Writing - review & editing. Laszl´ o M´ ´esz´aros: Conceptualization, Writing - review & editing, Supervision.
Declaration of Competing Interest
The authors declare that they have no known competing financial interests or personal relationships that could have appeared to influence the work reported in this paper.
Acknowledgements
The research reported in this paper and carried out at BME has been supported by the NRDI Fund (TKP2020 IES, Grant No. BME-IE-NAT) based on the charter of bolster issued by the NRDI Office under the auspices of the Ministry for Innovation and Technology. This paper was also supported by the National Research, Development and Innovation Office, Hungary (NVKP_16-1-2016-0012, K 132462). A. Kmetty is ´ thankful for J´anos Bolyai Research Scholarship of the Hungarian Academy of Sciences.
References
[1] M. Chauvet, M. Sauceau, J. Fages, Extrusion assisted by supercritical CO2: A review on its application to biopolymers, J. Supercrit. Fluids 120 (2017) 408–420, https://
doi.org/10.1016/j.supflu.2016.05.043.
[2] K. Bocz, B. Szolnoki, A. Farkas, E. Verret, D. Vadas, K. Decsov, G. Marosi, Optimal distribution of phosphorus compounds in multi-layered natural fabric reinforced biocomposites. Express, Polymer Letters 14 (2020) 606–618.
[3] M. And´o, M. Birosz, S. Jeganmohan, Surface bonding of additive manufactured parts from multi-colored PLA materials, Measurement 169 (2021), https://doi.org/
10.1016/j.measurement.2020.108583.
[4] M. Nofar, C.B. Park, Poly(lactic acid) foaming, Prog. Polym. Sci. 39 (2014) 1721–1741, https://doi.org/10.1016/j.progpolymsci.2014.04.001.
[5] A.N. Naeem, A. G´abora, T. Mankovits, Influence of the manufacturing parameters on the compressive properties of closed cell aluminum foams, Periodica Polytechnica Mechanical Engineering 64 (2020) 172–178, https://doi.org/
10.3311/PPme.16195.
[6] A. Kmetty, M. Tomin, T. B´ ´ar´any, T. Czig´any, Static and dynamic mechanical characterization of cross-linked polyethylene foams: The effect of density, eXPRESS Polym. Lett. 14 (2020) 503–509, https://doi.org/10.3144/
expresspolymlett.2020.40.
[7] M. Kulpa, T. Howiacki, A. Wiater, T. Siwowski, R. Sie´nko, Strain and displacement measurement based on distributed fibre optic sensing (DFOS) system integrated a)
b)
c)
0 20 40 60 80 100 120 140 160 180 200
Heat flow [W/g]
Temperature [°C]
REF MMT_0.5% MMT_1% MMT_3%
0.2 W/g
Exo
0 20 40 60 80 100 120 140 160 180 200
Heat flow [W/g]
Temperature [°C]
REF HAL_0.5% HAL_1% HAL_3%
0.2 W/g
Exo
0 20 40 60 80 100 120 140 160 180 200
Heat flow [W/g]
Temperature [°C]
REF CNT_0.5% CNT_1% CNT_3%
0.2 W/g
Exo
Fig. 5.DSC curves of the samples (second heating) (a) MMT, (b) HAL, (c) CNT.
Table 2
Evaluated results of the DSC tests (2nd heat-up).
Tg
[◦C] Heat flow step at Tg [W/g] Tcc
[◦C] Tm1
[◦C] Tm2
[◦C] Xc
[%]
ref 58.7 0.049 118.6 150.1 – 29.5
MMT 0.5
wt% 59.4 0.054 107.3 147.5 155.3 33.3
MMT_1 wt
% 59.2 0.049 108.5 147.8 155.0 33.3
MMT_3 wt
% 58.8 0.047 113.7 148.8 155.2 31.5
HAL_0.5 wt
% 59.3 0.047 106.9 148.2 156.6 32.4
HAL_1 wt% 58.9 0.053 107.3 147.9 156.4 35.7
HAL_3 wt% 58.9 0.047 110.0 148.2 155.2 31.9
CNT_0.5 wt
% 59.0 0.051 106.9 148.7 157.3 32.3
CNT_1 wt% 59.1 0.048 108.4 148.7 157.0 33.7
CNT_3 wt% 59.8 0.047 114.1 149.5 155.0 31.5
Table 3
The foam density and the specific compressive strength of the produced foams.
ρfoam [g/cm3] Specific compressive strength [MPa/(g/cm3)]
Ref 0.19 ±0.01 12.07 ±7.50
MMT_0.5 wt% 0.27 ±0.02 11.46 ±0.52 MMT_1 wt% 0.27 ±0.01 10.12 ±1.52 MMT_3 wt% 0.10 ±0.02 11.53 ±1.56 HAL_0.5 wt% 0.36 ±0.02 18.60 ±2.74 HAL_1 wt% 0.42 ±0.01 18.24 ±2.34 HAL_3 wt% 0.45 ±0.01 20.89 ±1.75 CNT_0.5 wt% 0.30 ±0.02 11.28 ±0.16 CNT_1 wt% 0.35 ±0.10 13.35 ±3.62 CNT_3 wt% 0.44 ±0.07 14.97 ±0.95
with FRP composite sandwich panel, Measurement 175 (2021), https://doi.org/
10.1016/j.measurement.2021.109099.
[8] B. Jeon, H.K. Kim, S.W. Cha, S.J. Lee, M.-S. Han, K.S. Lee, Microcellular foam processing of biodegradable polymers - Review, Int. J. Precis. Eng. Manuf. 14 (2013) 679–690, https://doi.org/10.1007/s12541-013-0092-0.
[9] A. Kmetty, K. Litauszki, Development of poly(lactide acid) foams with thermally ´ expandable microspheres, Polymers 12 (2020) 463, https://doi.org/10.3390/
polym12020463.
[10] K. Litauszki, A. Kmetty, Characterization of chemically foamed poly(lactic acid). in ´
’IOP Conference Series, Materials Science and Engineering. 903 (2020) 1–7.
[11] M. Mihai, M.A. Huneault, B.D. Favis, Crystallinity development in cellular poly (lactic acid) in the presence of supercritical carbon dioxide. in ’ANTEC 2009.
Chicago, Illinois, 67 (2009) 31-35.
[12] K. Bocz, T. T´abi, D. Vadas, M. Sauceau, J. Fages, G. Marosi, Characterisation of natural fibre reinforced PLA foams prepared by supercritical CO2 assisted extrusion. Express, Polymer Letters 10 (2016) 771–779, https://doi.org/10.3144/
expresspolymlett.2016.71.
[13] M. Chauvet, M. Sauceau, F. Baillon, J. Fages, Mastering the structure of PLA foams made with extrusion assisted by supercritical CO2, J. Appl. Polym. Sci. 28 (2017) 45067, https://doi.org/10.1002/app.45067.
[14] M. Nofar, Effects of nano-/micro-sized additives and the corresponding induced crystallinity on the extrusion foaming behavior of PLA using supercritical CO2, Mater. Des. 101 (2016) 24–34, https://doi.org/10.1016/j.matdes.2016.03.147.
[15] L.J. Lee, C. Zeng, X. Cao, X. Han, J. Shen, G. Xu, Polymer nanocomposite foams, Compos. Sci. Technol. 65 (2005) 2344–2363, https://doi.org/10.1016/j.
compscitech.2005.06.016.
[16] M. Keshtkar, M. Nofar, C.B. Park, P.J. Carreau, Extruded PLA/clay nanocomposite foams blown with supercritical CO2, Polymer 55 (2014) 4077–4099, https://doi.
org/10.1016/j.polymer.2014.06.059.
[17] W. Wu, X. Cao, Y. Zhang, He G., Polylactide/halloysite nanotube nanocomposites:
thermal, mechanical properties, and foam processing. Journal of Applied Polymer Science, 130 (2013) 443- 450. DOI: 10.1002/app.39179.
[18] T. He, X. Liaon, Y. He, G. Linn, Novel electric conductive polylactide/carbon nanotubes foams prepared by supercritical CO2, Progress in Natural Science:
Materials International 23 (2013) 395–401, https://doi.org/10.1016/j.
pnsc.2013.06.006.
[19] D. Wu, Q. Lv, S. Feng, J. Chen, Y. Chen, Y. Qiu, X. Yao, Polylactide composite foams containing carbon nanotubes and carbon black: Synergistic effect of filler on electrical conductivity, Carbon 95 (2015) 380–387, https://doi.org/10.1016/j.
carbon.2015.08.062.
[20] F. Stan, R.T. Rosculet, C. Fetecau, Direct Current method with reversal polarity for electrical conductivity measurement of TPU/MWCNT composites, Measurement 136 (2019) 345–355, https://doi.org/10.1016/j.measurement.2018.12.107.
[21] M. Nofar, A. Ameli, C.B. Park, The thermal behavior of polylactide with different D-lactide content in the presence of dissolved CO2, Macromol. Mater. Eng. 299 (2014) 1232–1239, https://doi.org/10.1016/j.matdes.2016.03.147.
[22] L.M. Matuana, O. Faruk, C.A. Diaz, Cell morphology of extrusion foamed poly (lactic acid) using endothermic chemical foaming agent, Bioresour Technol 100 (2009) 5947–5954, https://doi.org/10.1016/j.biortech.2009.06.063.
[23] L. M´esz´aros, T. De´ak, G. Balogh, T. Czvikovszky, T. Czig´any, Preparation and mechanical properties of injection moulded polyamide 6 matrix hybrid nanocomposite, Compos. Sci. Technol. 75 (2013) 22–27, https://doi.org/10.1016/
j.compscitech.2012.11.013.
[24] N. Lesaffre, S. Bellayer, H. Vezin, G. Fontaine, M. Jimenez, S. Bourbigot, Recent advances on the ageing of flame retarded PLA: Effect of UV-light and/or relative humidity, Polym. Degrad. Stab. 139 (2017) 143–164, https://doi.org/10.1016/j.
polymdegradstab.2017.04.007.
[25] S.R. Rathi, E.B. Coughlin, S.L. Hsu, C.S. Golub, G.H. Ling, M.J. Tzivanis, Maintaining structural stability of poly(lactic acid): Effects of multifunctional epoxy based reactive oligomers Polymers, 6 (2014) 1232-1250. DOI: 10.3390/
polym6041232.
[26] S. Iannace, C.B. Park, Biofoams science and applications of bio-based cellular and porous materials, Taylor & Francis Group, LLC, Boca Raton, FL, USA, 2016.
[27] Wong A., S.F.L. Wijnands, T. Kuboki, C.B. Park, Mechanisms of nanoclay-enhanced plastic foaming processes: effects of nanoclay intercalation and exfoliation. Journal of Nanoparticle Research, 15 (2013) 1815-1/15. DOI: 10.1007/s11051-013-1815- [28] Saint-Gobain Construction Products CZ a.s., Technical datasheet of Isover EPS 100. y.
(2020).
[29] A.S. Knauf, Technical datasheet of Gray EPS Thermal insulation board, Knauf (2020).