1. Introduction
Polymer foams are two-phase materials with statis- tically distributed macromolecular size gas bubbles in the polymer [1]. Polymer foams are most com- monly made from polyurethane (PU), polystyrene (PS), polyethylene (PE), polyvinyl-chloride (PVC) and polypropylene (PP), but nowadays, the use of polylactic acid (PLA) is increasing continuously as well [2–5]. Polymer foams have different properties depending on manufacturing technology, the amount and size of gas bubbles, and the applied solid matrix material, but they have considerably lower density than solid polymers (10–400 kg/m3).
In general, they are good insulators of heat and sound, resistant to chemicals, and have good impact damping properties [2–5]. For this reason, engineer- ing foams are mostly used in the packaging, auto- motive, electronic, building, toy, leather and shoe industries, as well as for producing sporting and household goods [6].
In the packaging and sporting goods industries, poly- ethylene foams are among the most commonly used foams, thanks to their low price and excellent damp- ing properties [2, 7, 8]. This is proved by the fact that the global polyethylene foam market is growing con- tinuously, with an annual growth of 5.8% (source:
https://www.marketsandmarkets.com/Market-Reports/
polyethylene-foam-market-129894004.html).
Some areas of use require better mechanical proper- ties and heat resistance, which is usually achieved by cross-linking of polyethylene foams [9, 10]. This can be done in two ways: physically or chemically. In physical cross-linking, the material is exposed to high-energy radiation, most commonly electron, X-ray, gamma or UV radiation. Radiation produces free radicals in the molecular chains of PE, which connect and thus form the cross-links due to heat treatment. This procedure is more expensive and re- quires extra safety measures than chemical cross- linking but it is faster and produces more uniform
Static and dynamic mechanical characterization of cross-linked polyethylene foams: The effect of density
Á. Kmetty1,2*, M. Tomin1, T. Bárány1, T. Czigány1,2
1Department of Polymer Engineering, Faculty of Mechanical Engineering, Budapest University of Technology and Economics, Műegyetem rkp. 3., H-1111 Budapest, Hungary
2MTA–BME Research Group for Composite Science and Technology, Műegyetem rkp. 3., H-1111 Budapest, Hungary
Received 9 January 2020; accepted in revised form 21 February 2020
Abstract.We performed the complex static and dynamic mechanical characterization of cross-linked polyethylene foams;
we investigated the effect of foam density on various mechanical properties and the relationship between cell structure and mechanical behavior. The impact damping and energy absorption properties of the foams were determined by falling weight impact tests, while static mechanical properties were determined by compression and compression set tests. The experimental results validated our hypothesis that the relationship between the above-mentioned mechanical properties and density can be described with the power law with good approximation.
Keywords:mechanical properties, cross-linked polyethylene foams, cell structure, impact testing, compression https://doi.org/10.3144/expresspolymlett.2020.40
*Corresponding author, e-mail:kmetty@pt.bme.hu
© BME-PT
cross-links, without additional materials or by-prod- ucts [11, 12]. In chemical cross-linking, initiators are used (usually peroxide or silane), which enter the polyethylene by compounding at a low temperature.
As temperature is increased, the materials start to de- compose and take hydrogen atoms from the molec- ular chains, resulting in free radicals, and thus cross- linking occurs [13, 14].
The properties of cross-linked PE (XPE), are greatly influenced by the method of cross-linking and foam- ing. Much research has focused on the effect of manufacturing parameters on material properties [15–17], but the complex mechanical properties of these materials are not yet investigated in detail.
Dias et al. [12] examined XPE foams of 70–
90 kg/m3, foamed with 2–4 wt% azodicarbonamide and cross-linked by electron radiation. They found that increasing the dosage of radiation results in an increase in tensile strength and a decrease in elon- gation at break. Cardoso et al. [11] found that when the amount of azodicarbonamide is increased (5–
15 wt%), cross-linking decreases and so mechanical properties, such as tensile strength, are impaired, re- gardless of the dosage of radiation. Velasco et al.
[18] performed falling weight impact tests with an impact energy of 36 J and a 12.7 mm diameter semi- spherical striker. Regardless of the density of the XPE foams (~30–90 kg/m3), they found that the striker went through all the specimens and the ab- sorbed energy never exceeded 5%. The testing method, however, does not represent the typical loads of foams in packaging and sports, as here the foams typically get into contact with a solid surface, so the measurement layout should be modified with the use of a solid support.
While the complex mechanical characterization of XPE foams is a missing knowledge, and the mathe- matical relationship between foam density and me- chanical properties is not yet fully known, in this re- search project, we performed static and dynamic mechanical tests on cross-linked polyethylene foams of different densities to determine the relationship be- tween foam density and mechanical properties. The tests are supplemented by scanning electron mi- croscopy (SEM) images and mechanical properties are related to cell structure.
2. Materials
We used cross-linked linear low density polyethyl- ene (XLDPE) foams of Polifoam Ltd. (Budapest,
Hungary) in four different densities. The foams were produced on a flat film extrusion line, with azodi- carbonamide as foaming agent and dicumyl peroxide as curing agent. The foams are commercially avail- able from the supplier in the type name of C3030, C4030, C5030, and C7030. Polifoam Ltd. produced 30 mm thick specimens for the falling weight tests by welding three 10 mm thick layers using flame lamination. Flame lamination is one of the most commonly used foam welding processes in the in- dustry due to its simplicity, high productivity and low cost. The principle of the technology is that the skin of previously produced polymer foam sheets are melted over a flame then laminated together with the use of rollers. The appropriate adjustment of the flame is important to provide the proper melting of a thin skin without burning the foam and decreasing its thickness. The quality of the welding is primarily influenced by the type of gas used, and the height and propagation of the flame. When testing foam compression strength and recovery capability, we put the three 10 mm layer on each other without joining them, according to the ASTM D3575 and the ISO 1856 standards.
3. Methods
Measurement of density
The density of the 100×100×30 mm falling weight test specimens was calculated according to the ISO 845:2006 standard, based on their dimensions and mass. We also calculated relative density (Equa - tion (1)):
(1) where ρrel [–] is the relative density ρLDPE= 915 kg/m3is the density of polyethylene, and ρfoam
[kg/m3] is the density of the foam.
Scanning electron microscopy
We examined the cell structure of the different foams with a JEOL JSM 6380A scanning electron micro- scope. We produced cryogenic fracture surfaces and coated them with a gold alloy. Using the SEM im- ages, we analyzed the cell structure of the foams and determined the average cell diameter with the Im- ageJ image-processing software. Then we calculated porosity (Vf) (Equation (2)) and cell nucleation (NC) (Equation (3)), which is the theoretical number of cells in 1 m3[19]:
rel LPDE
t = ttfoam
(2)
(3)
where Vf[–] is the porosity, and ρrel[–] is the relative density of the foam structure, Nc[cells/m3] is the cell nucleation, n [cells] is the number of cells in the image, M[–] is the magnification, A[m2] is the area of the sample.
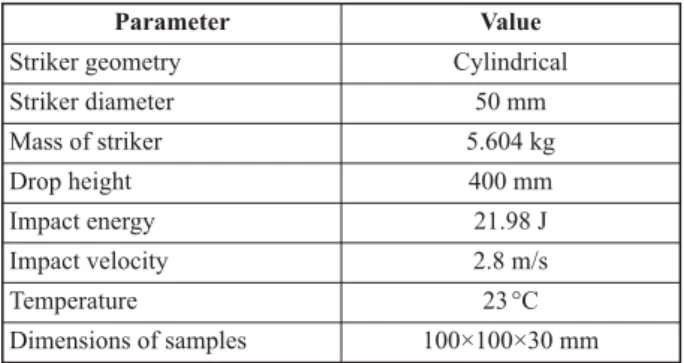
Falling weight impact tests
Falling weight impact tests were performed with a Ceast Fractovis 9350 instrumented falling weight tester. Before the tests, we modified the test layout:
we replaced the original hollow cylindrical support with a 20 mm thick solid polyamide sheet. This lay- out simulates the typical support of foams in pack- aging and sports products far better. Table 1 con- tains the test parameters. In these tests, welded samples were investigated to simulate real-life ap- plications, because welded multilayer products are often used in the sports and packaging industry as well. We examined maximum force and deforma- tion during impact, absorbed energy, and duration of impact.
Foam compression test
Compression tests were performed on a Zwick Z050 testing machine at room temperature, according to the ASTM D3575 standard. The 60 mm diameter 30 mm high cylindrical specimens were produced by placing three 10 mm thick pieces on the top of each other. Compression strength was determined from the force-deformation curves recorded during the tests (Equation (4)):
(4)
where CD [kPa] is compression strength, Fm[N] is the force at 25% deformation, while S0[mm2] is the initial cross-section of the specimen perpendicular to the axis of compression.
Recovery capability
We measured recovery capability using compression set tests at room temperature on a Zwick Z050 test- ing machine. The dimensions of the specimens were 50×50×30 mm. They were made up of three 10 mm thick foam samples on the top of each other. The spec- imens were kept at 50% deformation for 22 hours, then we measured the recovered thickness (Equa- tion (5)) according to the ISO 1856 and the ASTM D3575 standards immediately after unloading, after 30 minutes and after 24 hours.
(5) where Dx[%] is the recovered thickness, Sx[mm] is the thickness of the specimen after the specified re- covery period, S0 [mm] is the original thickness, while xrefers to the recovery time.
4. Results and discussion
In this section, we evaluate the results of falling weight impact, compression and compression set tests, and analyze the relationship between foam density and mechanical properties.
Density
Table 2 contains the measured density values and also the calculated relative density values. The den- sity of the samples increases gradually in the range of 30 to 70 kg/m3, which facilitates the comparison of different mechanical parameters as a function of density.
Scanning electron microscopy
Figure 1 shows the SEM image of sample C5030.
The other samples also had a similar structure. As the image indicates, the examined foams are closed-cell
D SS
x x 100
0 $
=
C 10S F
D m
0 3$
= N n MA
V 1 1
/
C f
2 3 2
$ $
=T Y - Vf= -1 trel
Table 1.Falling weight impact test parameters.
Parameter Value
Striker geometry Cylindrical
Striker diameter 50 mm
Mass of striker 5.604 kg
Drop height 400 mm
Impact energy 21.98 J
Impact velocity 2.8 m/s
Temperature 23 °C
Dimensions of samples 100×100×30 mm
Table 2.The density of the samples.
Sample Measured density [kg/m3]
Relative density [–]
C3030 30.7±0.5 0.033
C4030 43.4±0.3 0.047
C5030 48.4±0.2 0.053
C7030 69.0±1.1 0.075
foams, as the continuous cell walls isolate the cells from each other.
Table 3 contains the measured average cell diameter, calculated porosity, and cell nucleation. The results indicate that as foam density increases, average cell diameter, porosity and the number of cells (cell nu- cleation) decrease. This suggests that higher density foams have thicker walls, which results in a stiffer and stronger structure.
We also took a SEM image of a welded interphase of foams (Figure 2). There was no homogeneous in- terphase boundary between the layers welded to- gether by flame lamination. Cells in the contact lay- ers of the foams were welded together as they were in contact with the flame. We compared the inter- phase layers of the different density foams with SEM, and there was no difference between them, so this could not affect the measurement results.
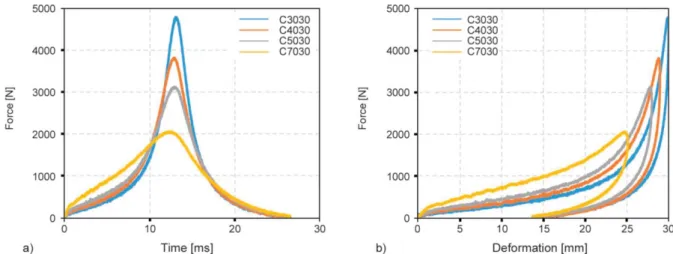
Falling weight impact tests
Figure 3 shows a characteristic force–time and force–deformation curve of each density. As can be seen, as density increases, the maximum force de- creases. The force–deformation curves can be divid- ed into three sections, caused by different mecha- nisms in cell structure. The force increases in the first region, up to about 2 mm, which can be attributed to cell wall bending, then the cell walls start to buckle (up to about 8 mm); therefore, the force increases at a lower rate. In the third part of deformation, oppo- site cell walls touch, so cells are compacted, which results in a high force increase.
Higher density foams have thicker cell walls and contain more solid material, and so they have better impact damping capability and are more resistant to Figure 1.SEM image of C5030.
Table 3.Results calculated from the SEM images.
Material Average cell diameter [mm]
Porosity [–]
Cell nucleation [cells/m3]
C3030 0.77 0.966 2.69·1015
C4030 0.68 0.953 2.04·1015
C5030 0.68 0.947 1.91·1015
C7030 0.64 0.925 1.55·1015
Figure 2.SEM image of the interphase boundary of the C4030 sample.
Figure 3.Force-time (a) and force-deformation (b) curves of the falling weight tests.
deformation. As density increases, the force in the first parts of the force–deformation curve increases, and the force progression in the final part of the curves becomes less significant. As a result, the C7030 sample was able to decrease the speed of the striker to zero before the complete compaction of the cells. However, with higher impact energy, this sam- ple could be fully compressed as well.
Table 4 contains the maximum force, absorbed en- ergy, maximum deformation, and collision time re- sults calculated from the curves.
The averages of the measurement groups are signif- icantly different, which we proved by single-factor variance analysis (at 95% significance). The p-value of variance analysis is several orders of magnitude below 0.05.
The results indicate that in the case of the examined foam samples, absorbed energy and collision time increases, while maximum force and maximum de- formation decrease as density increases.
Deformation decreases as density increases because denser foams contain smaller cells; therefore the load is better distributed on the cell walls, and so defor- mation is smaller. In the case of sample C3030, the foam had such poor impact damping that the cell structure was completely compacted, and even the resulting solid structure was slightly deformed.
Lower density resulted in higher force because a
lower density foam can be compressed more, so the cell structure becomes so dense that it better approx- imates the model of perfectly elastic collision than denser foams that resists deformation better. A lower density foam, therefore, has worse impact damping properties, as the foam compressed to nearly solid provides a larger reaction force than denser foams.
Concerning absorbed energy, we think that the thick- er cell walls resist loads better, therefore they can ab- sorb more impact energy.
Our hypothesis is that the relationship between den- sity and other mechanical properties can be described with the power law. We support this hypothesis with our measurement results. Accordingly, we sought the relationship in the form of (Equation (6)):
(6) We used the individual measured points (Equa- tion (7)):
(7) and used linear regression, where E[J] is absorbed energy, ρ [kg/m3] is density, C[J·(kg/m3)–n] is a con- stant, and n[–] is the exponent of the density that we sought. Figure 4 shows the models fitted to absorbed energy, maximum deformation, collision time and maximum force. Based on linear regression, a straight line of slope n can be fitted to the logE(ρ) = logC+n·log ρ points. With R2= 0.9199, the rela- tionship between energy absorption and density is (Equation (8)):
(8) ERtW=C$tn
Ei=C$tin
S+t0.19 Table 4.Results of the falling weight test.
Material
Maximum force
[N]
Absorbed energy
[J]
Maximum deformation
[mm]
Collision time [ms]
C3030 4787±57 15.1±0.2 29.9±0.1 24.9±0.3 C4030 3814±65 16.6±0.2 28.6±0.1 25.1±0.3 C5030 3081±23 17.3±0.2 27.9±0.1 26.1±0.3 C7030 2070±26 18.8±0.2 24.8±0.4 26.4±0.5
Figure 4.The relationship between absorbed energy, maximum force, maximum deformation, collision time, and density [kg/m3].
With the same method, we determined the relation- ship between density and collision time, maximum force and maximum deformation as well (Figure 4).
The obtained formulae can help approximate the dy- namic mechanical properties of an XPE foam well.
The relationship between maximum force and density is especially important for the selection of packaging because the foam type and thickness of the packag- ing can be selected based on this. Of course, the maximum force the packaged product can withstand also needs to be known.
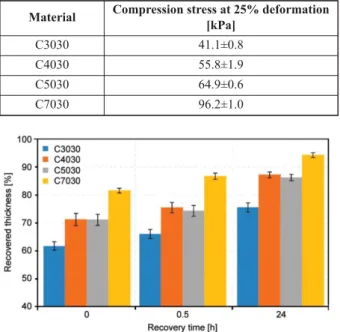
Foam compression strength
The compression test results are summarized in Table 5.
As our results indicate, higher density leads to higher compression strength, which can also be attributed to cell structure, as a denser foam has thicker cell walls. Using the above-mentioned method, we de- termined the relationship between density and foam compression strength as well (Equation (9)):
(9)
Recovery capability
Recovery capability describes the behavior of foams after a static load is released. We kept the samples
compressed to 50% of their thickness for 22 hours, then measured their thickness immediately (0), after 30 minutes (0.5 hours), and after 24 hours. Figure 5 shows the recovered thickness results for each foam after the specified recovery periods.
Higher density causes less permanent deformation.
The lowest density foam is the least resistant, while the highest density foam is the most resistant to de- formation.
The relationship between recovered thickness after 24 hours and density can be described with linear re- gression with the following formula (R2= 0,9349) (Equation (10)):
(10)
5. Conclusions
We performed the complex mechanical testing of four cross-linked polyethylene foams of different densities. Tests included falling impact weight tests, compression tests and recovery tests. The SEM im- ages showed that higher density foams had smaller average cell size, fewer cells and therefore thicker cell walls, which resulted in higher compression strength, and better energy absorption, impact damp- ing and recovery capabilities. The test results sup- ported our hypothesis that the relationship between density and mechanical properties can be approxi- mated well with the power law. Also, at given test parameters, mechanical properties improved as den- sity increased. Our results provide a good basis for the packaging industry. In this field, the relationship between the maximum force and the density is of paramount importance because packaging materials are designed according to the so-called cushion curves. These curves show the maximal deceleration results of falling weight impact tests with various pa- rameters. From the maximum force we calculated, this can be determined by Newton's second law. Our results can also be used in the sports industry, where most sports mats are made from cross-linked poly- ethylene foam, so it is essential to know the full me- chanical behavior of the material to select the foam of least density that meets the given requirements.
The mass reduction achievable this way contributes to a reduction in transport costs and emissions.
D24h+t0 27.
CD+t1 06.
Table 5.Compression test results of the foams.
Material Compression stress at 25% deformation [kPa]
C3030 41.1±0.8
C4030 55.8±1.9
C5030 64.9±0.6
C7030 96.2±1.0
Figure 5.Recovery after 0 hours, 0.5 hours and 24 hours.
Acknowledgements
This paper was supported by the National Research, Devel- opment and Innovation Office, Hungary (K_19_132462) by the ‘ÚNKP-19-4 New National Excellence Program of the Ministry for Innovation and Technology’ and the ‘János Bolyai Research Scholarship of the Hungarian Academy of Sciences’, further by the BME-Nanonotechnology FIKP grant (BME FIKP-NAT), and by United World Wrestling.
The authors thank Polifoam Ltd. for providing the foam samples.
References
[1] Gibson L. J., Ashby M. F.: Cellular solids: Structure and properties. Cambridge University Press, Cambridge (1997).
https://doi.org/10.1017/CBO9781139878326
[2] Mills N.: Polymer foams handbook: Engineering and biomechanics applications and design guide. Elsevier, Oxford (2007).
https://doi.org/10.1016/B978-0-7506-8069-1.X5000-4 [3] Lee S-T., Park C. B., Ramesh N. S.: Polymeric foams:
Science and technology. CRC Press, Boca Raton (2006).
https://doi.org/10.1201/9781420004625
[4] Landrock A. H.: Handbook of plastic foams: Types, properties, manufacture and applications. Elsevier, New York (1995).
[5] Hussain S., Dickson A.: Improving and predicting the mechanical properties of foamed and stretched compos- ite poly(lactic acid) films. Express Polymer Letters, 13, 18–26 (2019).
https://doi.org/10.3144/expresspolymlett.2019.3
[6] Prud'homme R. K., Khan S. A.: Foams: Theory, meas- urements and applications. CRC Press, New York (2017).
[7] Mills N. M.: Polyolefin foams. Rapra, Shawbury (2003).
[8] Ruiz-Herrero J. L., Rodríguez-Pérez M., De Saja J. A.:
Prediction of cushion curves for closed cell polyethyl- ene-based foams. Part I. Modelling. Cellular Polymers, 24, 329–346 (2005).
https://doi.org/10.1177/026248930502400602
[9] Rodríguez-Pérez M.: Crosslinked polyolefin foams:
Production, structure, properties, and applications. Ad- vances in Polymer Science, 184, 97–126 (2005).
https://doi.org/10.1007/b136244
[10] Danaei M., Sheikh N., Afshar Taromi F.: Radiation cross-linked polyethylene foam: Preparation and prop- erties. Journal of Cellular Plastics, 41, 551–562 (2005).
https://doi.org/10.1177/0021955X05059034
[11] Cardoso E. C. L., Lugáo A. B., de Andrade E. Silva L.
G.: Crosslinked polyethylene foams, viaEB radiation.
Radiation Physics and Chemistry, 52, 197–200 (1998).
https://doi.org/10.1016/S0969-806X(98)00139-X
[12] Dias D. B., de Andrade E. Silva L.G.: Polyethylene foams cross-linked by electron beam. Radiation Physics and Chemistry, 76, 1696-1697 (2007).
https://doi.org/10.1016/j.radphyschem.2007.02.089 [13] Tamboli S. M., Mhaske S. T., Kale D. D.: Crosslinked
polyethylene. Indian Journal of Chemical Technology, 11, 853–864 (2004).
[14] Trageser D. A.: Crosslinked polyethylene foam process- es. Radiation Physics and Chemistry, 9, 261–270 (1977).
https://doi.org/10.1016/0146-5724(77)90085-1
[15] Abe S., Yamaguchi M.: Study on the foaming of crosslinked polyethylene. Journal of Applied Polymer Science, 79, 2145–2155 (2001).
https://doi.org/10.1002/1097-
4628(20010321)79:12<2146::AID-APP1022>3.0.CO;2-Q [16] Xing Z., Wu G., Huang S., Chen S., Zeng H.: Prepara-
tion of microcellular cross-linked polyethylene foams by a radiation and supercritical carbon dioxide ap- proach. The Journal of Supercritical Fluids, 47, 281–
287 (2008).
https://doi.org/10.1016/j.supflu.2008.08.009
[17] Gulmine J., Akcelrud L.: Correlations between the pro- cessing variables and morphology of crosslinked poly- ethylene. Journal of Applied Polymer Science, 94, 222–
230 (2004).
https://doi.org/10.1002/app.20863
[18] Velasco J. I., Martínez A. B., Arencón D., Rodríguez- Pérez M. A., De Saja J. A: Application of instrumented falling dart impact to the mechanical characterization of thermoplastic foams. Journal of Material Science, 34, 431–438 (1999).
https://doi.org/10.1023/A:1004565822502
[19] Xu X., Park C. B., Xu D., Pop-Iliev R.: Effects of die geometry on cell nucleation of PS foams blown with CO2. Polymer Engineering and Science, 43, 1378–1390 (2003).
https://doi.org/10.1002/pen.10117
![Figure 4. The relationship between absorbed energy, maximum force, maximum deformation, collision time, and density [kg/m 3 ].](https://thumb-eu.123doks.com/thumbv2/9dokorg/796504.37705/5.892.210.683.881.1098/figure-relationship-absorbed-maximum-maximum-deformation-collision-density.webp)