doi: 10.3389/fimmu.2019.02459
Edited by:
Fabrizio Mattei, National Institute of Health (ISS), Italy Reviewed by:
Kawaljit Kaur, University of California, Los Angeles, United States Fatemeh Momen-Heravi, Columbia University, United States
*Correspondence:
Krisztina Buzás kr.buzas@gmail.com
Specialty section:
This article was submitted to Cancer Immunity and Immunotherapy, a section of the journal Frontiers in Immunology Received:21 March 2019 Accepted:01 October 2019 Published:18 October 2019 Citation:
Gyukity-Sebestyén E, Harmati M, Dobra G, Németh IB, Mihály J, Zvara Á, Hunyadi-Gulyás É, Katona R, Nagy I, Horváth P, Bálind Á, Szkalisity Á, Kovács M, Pankotai T, Borsos B, Erdélyi M, Szegletes Z, Veréb ZJ, Buzás EI, Kemény L, Bíró T and Buzás K (2019) Melanoma-Derived Exosomes Induce PD-1 Overexpression and Tumor Progression via Mesenchymal Stem Cell Oncogenic Reprogramming.
Front. Immunol. 10:2459.
doi: 10.3389/fimmu.2019.02459
Melanoma-Derived Exosomes Induce PD-1 Overexpression and Tumor
Progression via Mesenchymal Stem Cell Oncogenic Reprogramming
Edina Gyukity-Sebestyén1,2, Mária Harmati1,2, Gabriella Dobra1,2, István B. Németh3, Johanna Mihály4, Ágnes Zvara5, Éva Hunyadi-Gulyás6, Róbert Katona7, István Nagy8, Péter Horváth1, Árpád Bálind1, Ábel Szkalisity1, Mária Kovács1,9, Tibor Pankotai10, Barbara Borsos10, Miklós Erdélyi11, Zsolt Szegletes12, Zoltán J. Veréb3, Edit I. Buzás13, Lajos Kemény3, Tamás Bíró4and Krisztina Buzás1,14*
1Laboratory of Microscopic Image Analysis and Machine Learning, Institute of Biochemistry, Biological Research Centre of Hungarian Academy of Sciences, Szeged, Hungary,2Doctoral School of Interdisciplinary Sciences, Faculty of Medicine, University of Szeged, Szeged, Hungary,3Department of Dermatology and Allergology, University of Szeged, Szeged, Hungary,4Department of Immunology, Faculty of Medicine, University of Debrecen, Debrecen, Hungary,5Laboratory of Functional Genomics, Institute of Genetics, Biological Research Centre of Hungarian Academy of Sciences, Szeged, Hungary,6Laboratory of Proteomics Research, Institute of Biochemistry, Biological Research Centre of Hungarian Academy of Sciences, Szeged, Hungary,7Artificial Chromosome and Stem Cell Research Laboratory, Institute of Genetics, Biological Research Centre of Hungarian Academy of Sciences, Szeged, Hungary,8Sequencing Platform, Institute of Biochemistry, Biological Research Centre of Hungarian Academy of Sciences, Szeged, Hungary,9Department of Pharmacology and Pharmacotherapy, Faculty of Medicine, University of Szeged, Szeged, Hungary,10Department of Biochemistry and Molecular Biology, Faculty of Science and Informatics, University of Szeged, Szeged, Hungary,11Advanced Optical Imaging Group, Department of Optics and Quantum Electronics, Faculty of Science and Informatics, University of Szeged, Szeged, Hungary,
12Atomic Force Microscope Laboratory, Institute of Biophysics, Biological Research Centre of Hungarian Academy of Sciences, Szeged, Hungary,13MTA-SE Immuno-proteogenomics Extracellular Vesicle Research Group, Department of Genetics, Cell- and Immunobiology, Faculty of Medicine, Semmelweis University, Budapest, Hungary,14Department of Oral Biology and Experimental Dental Research, Faculty of Dentistry, University of Szeged, Szeged, Hungary
Recently, it has been described that programmed cell death protein 1 (PD-1) overexpressing melanoma cells are highly aggressive. However, until now it has not been defined which factors lead to the generation of PD-1 overexpressing subpopulations.
Here, we present that melanoma-derived exosomes, conveying oncogenic molecular reprogramming, induce the formation of a melanoma-like, PD-1 overexpressing cell population (mMSCPD-1+) from naïve mesenchymal stem cells (MSCs). Exosomes and mMSCPD-1+ cells induce tumor progression and expression of oncogenic factors in vivo. Finally, we revealed a characteristic, tumorigenic signaling network combining the upregulated molecules (e.g., PD-1, MET, RAF1, BCL2, MTOR) and their upstream exosomal regulating proteins and miRNAs. Our study highlights the complexity of exosomal communication during tumor progression and contributes to the detailed understanding of metastatic processes.
Keywords: PD-1, exosome, melanoma/tumor progression, stem cell, reprogramming, signalization pattern, metastasis
INTRODUCTION
Heterogeneous tumor tissue is comprised of a wide variety of collocated cells. Their spatiotemporal co-existence facilitates direct communication between them. Cancer cells contribute to tumor niche formation not only by soluble factor production and receptor-ligand interactions (1), but also by releasing vesicles whose molecular contents add up to a complex information package. Previous studies demonstrated that cultured human tumor cells release extracellular vesicles such as exosomes of 20–
120 nm diameters (2). Among others, exosomes carry structural and signaling proteins, MHC molecules, cell surface molecules typically associated with apoptosis, and mRNAs/miRNAs with multiple functions (3). Therefore, these exosomal-molecular- patterns, as unique entities of the complex intercellular communication, are not independent of the quality or state of the mother cell (4,5). Exosomes have been recognized long ago, but their identification, characterization, and isolation are still under intense investigation. Further, whereas the definition of exosomes is based on the pathway of biogenesis, oncosomes form a functional class of extracellular vesicles. Indeed, oncosomes are suggested being capable of carrying and conveying tumor-related information (6) and might have a significant role in formation of tumor microenvironment (7).
Mesenchymal stem cells (MSCs) were first described as stromal cells of the bone marrow with multipotent differentiation potential and characteristic immunomodulatory effects (8). In relation to their immunological and differentiation properties, there is a debate about the role of MSCs in tumor progression (9).
Indeed, the cellular fate could depend on the cancer type and also on the status of the affected MSCs. Activated MSCs can secrete pro-angiogenic soluble factors and are able to differentiate to vessel wall associated cells (10) or to cancer associated fibroblasts (CAFs) (11). Furthermore, Baglio et al. showed that tumor secreted extracellular vesicles promote osteosarcoma progression via TGFβ signaling induced IL-6 production by MSCs (12).
Moreover, Peinado et al. demonstrated that exosomes from highly metastatic melanomas increase the metastatic behavior of primary tumors by permanently educating bone marrow progenitors through the receptor tyrosine kinase MET (13).
Malignant melanoma is a highly invasive, metastatic cancer with poor prognosis and survival rate. Since melanoma has been long recognized as a highly immunogenic tumor, therapeutic approaches target different immunological mechanisms to treat patients with this aggressive skin cancer. In the past decade, besides IL-2 and CTLA-4 therapies, the PD-1:PD-L1 blockade proved to be an effective treatment in metastatic melanoma (14). Programmed cell death protein 1 (PD-1), mainly expressed by immune cells such as activated T cells, dendritic cells and macrophages is a cell surface receptor with a central role in modulation of T cell responses. PD-1 binding to its ligand, PD-L1, can result in apoptosis and anergy of immune cells.
Notably, PD-1 expression is not a default property of melanoma cells. Of further importance, recently Kleffel et al. demonstrated that PD-1 overexpressing melanoma cell subpopulations are especially aggressive, and that melanoma PD-1:PD-L1 interactions modulate mTOR signaling, whereby
they interfere with programmed cell death (15). This work is remarkably instrumental with respect to the consequences of PD-1 overexpression and experimental inhibition of PD-1 functions (Pdcd1-shRNA or anti-PD-1 antibody). However, it does not define the factors the activation of which lead to the generation of PD-1 overexpressing subpopulations. This question, though, is an especially intriguing one, if one considers that one of the most effective immunotherapies available today is based on the blockade of the aforementioned PD-1:PD-L1 interaction (16).
Based on the above, in the current study, we aimed at specifically and systematically addressing the following questions:
1. Can we unambiguously define the cellular and molecular signs of melanoma-derived exosome-induced, intercellular communication-mediated malignant transformation of MSC cultures?
2. Can we detect the melanoma-derived exosome-induced tumor progressionin vivo?
3. What alteration can be detected in the expression of PD-1, a melanoma progression marker and therapeutic target, upon exposure to melanoma-derived exosomes?
Here, we present the first piece of evidence that melanoma exosomes, by conveying a complex oncogenic molecular reprogramming, induce the formation of a PD-1 overexpressing cell population (melanoma-like MSCPD-1+; mMSCPD-1+) from naïve MSCs. These mMSCPD-1+ cells represent a new entity with melanoma-like gene expression profile and phenotypic properties. Further, exosomes and exosome- activated mMSCPD-1+ cells induce rapid tumor progressionin vivo, due to their strong expression of oncogenic dominance factors and decreased susceptibility to programmed cell death.
MATERIALS AND METHODS Cell Culture and Cell Line
B16F1 mouse melanoma cell line was obtained from ECACC and cultured in Dulbecco’s modified Eagle’s medium (DMEM, Lonza, Basel, Switzerland) containing 10% fetal bovine serum (FBS) (Euroclone, Milano, Italy), 1% sodium pyruvate, 1% MEM non-essential amino acids, 1% MEM vitamin solution, 2 mM L-glutamine, and 1% Penicillin-Streptomycin-Amphotericin B Mixture (all from Lonza).
Murine MSCs were isolated from C57BL/6N (Charles River Laboratories, Sulzfeld) 8 week-old male mice (17). Abdominal inguinal fat pads were excised, rinsed with RPMI 1640 medium, transferred to sterile tissue culture dishes and mechanically dissociated. The dissociated tissue was resuspended in RPMI 1640 containing 100µg/ml collagenase (Sigma-Aldrich, St. Louis, MO) and incubated at 37◦C for 50 min. Collagenase was neutralized with a growth medium containing 10% FBS. After centrifugation at 470 g for 15 min, cell pellets were resuspended and washed in the culture medium. After the centrifugation, cell pellets were resuspended in complete MesenCult medium (Stemcell Technologies, Vancouver, British Columbia, Canada) and filtered through a 100µm cell strainer (BD Biosciences,
Franklin Lakes, NJ) to tissue culture dishes, and cultured for 48 h at 37◦C in 5% CO2 and 90% humidity. Unattached cells and debris were then removed and fresh medium was added to the adherent cells. The cells were cultured to 80% confluence before being released with trypsin–EDTA and sub-cultured.
Purity of MSC cultures were checked by flow cytometry analysis using the Mouse Multipotent Mesenchymal Stromal Cell Marker Antibody Panel (R&D Systems, Minneapolis, MN) according to the manufacturer’s instructions.
Isolation and Characterization of the Melanoma-Derived Exosomes
Exosome Isolation by Filtration and Differential Centrifugation
Exosomes were isolated by adapting the protocol of Peinado et al. (13) from melanoma cell culture supernatant. B16F1 supernatants were harvested, supplemented by complete protease inhibitor cocktail (Roche, Mannheim, Germany) and centrifuged at 780 g for 5 min at 4◦C to remove intact cells. Then, the supernatants were centrifuged at 3,900 g for 15 min at 4◦C and filtered through a 0.2µm membrane (Millipore, Billerica, MA) to remove larger cell fragments and microvesicles. Exosomes were pelleted by ultracentrifugation at 150,000 g (T-1270 rotor at 40,500 rpm) for 1 h at 4◦C. The pellet was washed twice and resuspended in DPBS and stored at−80◦C.
The concentration of exosomal proteins was determined using a Pierce BCA Protein assay kit (Thermo Fisher Scientific, Waltham, MA) and a Benchmark Microplate Reader (Bio-Rad, Hercules, CA) according to the manufacturer’s instructions.
Determination of Shape and Size of the Isolated Vesicles
Scanning electron microscopy (SEM)
Five microliters of isolated exosomes in DPBS were spotted on glass coverslips coated with 0.01% Poly-L-Lysine (Sigma- Aldrich) and incubated overnight at 4◦C. Using sterile forceps, coverslips were transferred into a plastic plate. Exosomes were fixed by gently adding 2% paraformaldehyde buffer pH 7.2 diluted in DPBS for 30 min. The coverslips were washed twice with DPBS and dehydrated with a graded ethanol series (40, 60, 80, and 100% ethanol, each for 5 min). The samples were dried with a critical point dryer (QUORUM K850, Quorum Technologies Ltd, Laughton, UK) and the coverslips were mounted onto a microscope stub at a time using carbon tape, followed by 7 nm gold coating (QUORUM Q150, Quorum Technologies Ltd) and observed under a field-emission scanning electron microscope (JEOL JSM-7100F/LV).
Atomic force microscopy (AFM)
Exosomes were let to adsorb to the freshly cleaved muscovite mica (SPI-ChemTM Mica Sheets, Structure Probe, Inc., West Chester, PA) surface directly from DPBS. All AFM measurements were carried out with an Asylum MFP-3D head and Molecular Force Probe Controller (Asylum Research, Santa Barbara, CA), using Asylum Research MFP-3D program (version 15.09.112) written in Igor Pro software (version 6.37, Wavemetrics, Lake Oswego, OR). Image procession and data calculation were made
using the same software. Silicon rectangular cantilevers (OMLC- AC240TS, Olympus Optical Co., Ltd., Tokyo, Japan) with the typical spring constant of 2 N/m were used in dry condition and silicon nitride rectangular cantilevers with “V” shaped tips (Bio- Lever BL-RC150VB, Olympus Optical Co. Ltd.) with the typical spring constant of 0.03 N/m in buffer solution. Typically, 512
×512 points was taken at 1 line/s scan rate. The measurements presented here are amplitude images and height profile.
Detection of Exosomal Markers by Western Blotting Protein samples were resuspended in 4x sample buffer (NuPAGE LDS Sample Buffer (4X), NuPAGE Sample Reducing Agent (10X), Thermo Fisher Scientific), boiled at 96◦C for 10 min, and immediately cooled on ice. Electrophoresis of the proteins was performed using 4–12% Bis-Tris Protein Gels (NuPAGE Novex, Thermo Fisher Scientific), ProSieve Color Protein Markers (Lonza), and electrophoresis buffer (NuPAGE MOPS SDS Running Buffer, Thermo Fisher Scientific) at 200 V and 0.03 A for 40 min.
The proteins of electrophoresed gels were transferred to Immobilon transfer membrane (Millipore, Darmstadt, Germany) using transfer buffer [NuPAGE Transfer Buffer (20X)] at 30 V and 170–110 mA for 60 min. Membranes were blocked in TBST buffer (25 mM Tris-HCl, 150 mM NaCl, 0.05% Tween-20, pH 7.2) containing 5% non-fat milk for 60 min at room temperature (RT). After blocking, membranes were incubated with each primary antibody in TBST buffer containing 1% non-fat milk overnight at 4◦C. Membranes were washed three times for 10 min with TBST buffer and incubated for 60 min at room temperature with secondary antibody in TBST buffer containing 1% non- fat milk. Membranes were washed three times for 10 min with TBST buffer.
For exosomal marker identification western blot analyses were performed with an anti-CD63 polyclonal antibody (1:250 dilution; Biorbyt, Cambridge, UK) anti-CD9 monoclonal antibody (clone EPR2949, 1:500 dilution, LifeSpan Biosciences, Seattle, WA), anti-CD81 monoclonal antibody (clone: EAT2, 1:1,000 dilution, LifeSpan Biosciences, Seattle, WA), and anti-HSP70 monoclonal antibody (clone: C92F3A-5, 1:8,000 dilution; Enzo Life Sciences, Farmingdale, NY), anti-rabbit IgG HRP-Conjugated antibody (1:1,000 dilution, R&D Systems), anti-Hamster IgG HRP-Conjugated antibody (1:30,000 dilution, Thermo Fisher Scientific). Bound antibodies were visualized by chemiluminescence using an ECL Plus Western Blotting detection system (Advansta, Menlo Park, CA). Immunoreactive signals were detected by using LI-COR ODYSSEY Fc (Dual-mode imaging system) imager followed by analysis with Odyssey v1.2, Image Studio Lite v5.2.
Identification of Exosomal Proteins by Mass Spectrometry
Exosomal proteins (24µg) were separated in 4–12% Bis-Tris Protein Gels and stained with Coomassie blue (0.1% Coomassie Brilliant Blue R-250, 50% methanol and 10% acetic acid).
Each lane was cut to 12–12 equal bands and subjected to in- gel digestion. Gel bands were diced to smaller pieces, and the SDS and CBB dyes were washed out with 3× 50 µl 25 mM
ammonium-bicarbonate (ABC)/50% Acetonitrile (AcN). After reduction with DTT (1,4-dithiothreitol, Sigma-Aldrich; 20 µl, 10 mM DTT in 25 mM ABC) at 56◦C for 30 min, and alkylation with IAM (iodoacetamide, Sigma- Aldrich; 20µl, 55 mM IAM in 25 mM ABC) at RT in the dark for 30 min, the gel samples were dried in a vacuum centrifuge and after that rehydrated in 20µl of trypsin (Sequencing Grade Modified Trypsin, Promega, Fitchburg, WI; 5 ng/µl in 25 mM ABC) and incubated at 37◦C.
The digestion was stopped after 4 h by lowering the pH of the buffer below 3, by adding 2 µl of 10% formic acid. Tryptic peptides were extracted from the gel with 3 × 50 µl of 2%
formic acid in 50% AcN and dried. Prior mass spectrometric analysis, all samples were redissolved in 50–50 µl of 0.1%
formic acid (FA).
Samples were analyzed on an LTQ-Orbitrap Elite (Thermo Fisher Scientific) mass spectrometer on-line coupled with a nanoHPLC (nanoAcquity, Waters, Milford, MA) system. 5–5µl of the in-gel digests were loaded (for 3 min at 8 µl/min flow, using 0.1% FA in 3% Acetonitrile−97% water) onto a reversed phase trap column (Waters, Symmetry C18, 0.180 × 20 mm) and separated on a C18 reversed phase (Waters, Milford, MA, BEH300C18 1.7µm) nanocolumn (0.075×200 mm). The flow rate was 330 nl/min and a linear gradient was used from 3 to 40%
B in 37 min (solvent A was 0.1% FA in water and solvent B was 0.1% FA in Acetonitrile).
The high voltage (1.2 kV) was applied through liquid junction between the chromatographic column and the non-coated silica nanospray emitter (NewObjective, Woburn, MA, 10µm tip ID). The mass spectrometer operated in data-dependent mode:
the survey mass spectra were detected in the orbitrap with high resolution (R = 60 k @ m/z: 400, mass range m/z: 380–
1,400) and the most abundant multiply charged 20 peaks were selected for ion-trap fragmentation (NCE: 35%; activation q: 0.25;
activation time: 10 ms; minimum signal intensity: 5,000 counts).
The MSMS spectra were detected in the ion trap. Dynamic exclusion was used, the precursors were excluded for 15 s after the first fragmentation event.
Data analysis: searchable peaklists (mgf format) were extracted using ProteomeDiscoverer (ver:1.4 Thermo Fisher Scientific) and subjected to database search on our in-house ProteinProspector (ver: 5.14.1) search engine using the following parameters: parent ion tolerant: 5 ppm; fragment ion tolerant:
0.6 Da; Cys carbamidomethylation was set as constant and Met oxidation, cyclisation of peptide N-terminal Glu to pyroglutamic acid, protein N terminal acetylation were set as variable modifications. Only fully tryptic peptides were considered with maximum of 2 missed cleavage sites. TheMus musculusandBos taurusprotein sequences of the Uniprot (UniProtKB.06.11.2014) database completed with human keratins and pig trypsin, altogether 106,330 protein sequences were searched. For the false discovery rate (FDR) estimation, the searches were performed on the database concatenated with the randomized sequences.
Protein identification was accepted if the ProteinProspector expectation value was <0.01 and the protein was identified with at least 2 unique peptides (expectation value <0.05 and score higher than 15). FDR values were <1% in all cases.
For functional validation, the resulted protein list was analyzed by the “Core Analysis” function included in Ingenuity Pathway Analysis (IPA, Quiagen Bioinformatics) software.
Isolation and Detection of Exosomal miRNAs
miRNA sequencing was performed using SOLiD Total RNA- Seq lit for Small RNA Libraries (Applied Biosystems now part of Thermo Fisher Scientific) according to the manufacturer’s instructions. Purification was performed on 10% TBE-Urea gels stained with Sybr Gold nucleic acid gel stain (both from Invitrogen now part of Thermo Fisher Scientific). Final purification was performed using PureLink PCR Micro Kit (Invitrogen). Final libraries were quality checked using High Sense DNA kit on Bioanalyzer (all from Agilent, Santa Clara, CA). Concentration of each library was determined using the SOLID Library TaqMan Quantitation Kit (Life Technologies now part of Thermo Fisher Scientific). Each library was clonally amplified on SOLiD P1 DNA Beads by emulsion PCR (ePCR).
Emulsions were broken with butanol, and ePCR beads enriched for template-positive beads by hybridization with magnetic enrichment beads. Template-enriched beads were extended at the 3′ end in the presence of terminal transferase and 3′ bead linker. Beads with the clonally amplified DNA were deposited onto SOLiD sequencing slide and sequenced on SOLiD 5500 Instrument using the 50-base sequencing chemistry.
Bioinformatic Analysis Raw data quality assessment, read trimming read mapping and miRNA expression profiling were carried out in CLC Genomics Workbench tool version 8.0.2 (CLC Bio now part of Qiagen, Venlo, Netherlands) using annotated Mus musculus miRNA sequences according to the miRBase release 21 as a mapping reference.
In vitro Experiments
Cell Cultures
6 × 10⁴ cell/ml passage 2 MSCs were plated in cell culture dishes (1.5 × 10⁴/cm2). After 24 h incubation, MSC cultures were exposed to B16F1-derived exosomes (40µg/ml exosomal proteins; 1.5 × 10¹¹ exosomes) at every 24 h. Samples were exposed to exosomes for 24, 48, 72, and 96 h and then harvested in method-competent buffers.
Visualization of Labeled Exosome Internalization in MSCs
To examine the uptake of exosomes by MSCs, cells were plated to black 24-well Visiplates (1×10⁴cells/well) and incubated for 24 h. The exosomes were labeled with Dil dye (1,1′-dioctadecyl- 3,3,3′,3′-tetramethylindocarbocyanine perchlorate, PromoKine, Heidelberg, Germany) and the MSC cultures were labeled with DiO dye (3,3′-dioctadecyloxacarbo-cyanine perchlorate, PromoKine) according to the manufacturer’s instructions. Dil- labeled exosomes were washed in DPBS by ultracentrifugation (at 150,000 g for 1 h at 4◦C). Forty micrograms per milliliter DiL-labeled exosomes were added to DiO-labeled MSC cultures and the exosome uptake was followed for 24 h in the Celldiscoverer 7 automated live cell imaging system (Zeiss, Oberkochen, Germany). After 24 h, the cells were fixed with 4%
paraformaldehyde solution and a nucleus staining was performed
using DAPI (Life Technologies now part of Thermo Fisher Scientific). Then, 5 image z-stacks were acquired for both channels by Operetta High Content Screening System (Perkin Elmer, Waltham, MA). The stacks were maximum intensity projected and then analyzed automatically using a customized version of CellProfiler (18). Nuclei were detected with Otsu- adaptive threshold combined with diameter based filtering, then cytoplasms were identified with propagation method seeded from the nuclei and using the exosome channel. Exosomes were located with a customized version of A-trous wavelet transform based spot detection (19). Several wavelet levels were used to ensure the detection of exosomes with various size and then the overlaps were removed based on circularity measures. Finally, the exosome numbers per cell were identified using MATLAB programming, the diagrams were created in Microsoft Excel.
Cell Proliferation
After 72 h incubation, exosome-exposed and control MSC cultures were dissociated with trypsin from the culture surface.
Cells were washed in medium and counted in a Bürker chamber and a cell counter (Bio-Rad, TC10 Automated Cell Counter).
Detection of Apoptosis
Exosome-exposed MSCs and control cells were treated with 100 ng/ml mouse TNFα(R&D Systems). After 24 h incubation, cell death was determined by the Annexin V Apoptosis Detection Kit with PI (Biolegend, San Diego, CA) according to the manufacturer’s recommendations. Samples were measured by FACS Calibur flow cytometer (BD Biosciences), data were analyzed by Flowing Software (Cell Imaging Core, Turku Center for Biotechnology, Finland) where percent of positive cells was determined by relative fluorescence intensity and the results were expressed as mean of percentage of positive cells (%)±SD. Cells that are annexin-V/PI double positive show the sign of late apoptosis, while cells that are annexin-V positive and PI negative indicate early apoptosis. Annexin-V negative and PI positive cells are necrotic, viable cells are both annexin-V, and propidium iodide (PI) negative.
RNA Preparation, Melan-A, and Mitf Quantitative Real-Time PCR (QRT-PCR)
Total RNA of biological samples was purified using the Quick- RNA MiniPrep isolation kit of #R1054S (Zymo Research Irvine, CA). All the preparation steps were carried out according the manufacturer’s instructions. RNA samples were stored at−80◦C in the presence 30 U of Prime RNAse inhibitor (Fermentas, part of Thermo Fisher Scientific) for further analysis. The quantity of isolated RNA samples was checked by spectrophotometry (NanoDrop 3.1.0, Rockland, DE).
QRT-PCR was performed on a RotorGene 3000 instrument (Corbett Research, Sydney, Australia) with gene-specific primers and SybrGreen protocol to monitor gene expression. One microgram of total RNA was reverse transcribed with random primers using the High-Capacity cDNA Archive Kit (Applied Biosystems) according to the manufacturer’s instructions in final volume of 30 µl. The temperature profile of the reverse transcription was the following: 10 min at room temperature, 2 h
at 37◦C, 5 min on ice, and finally 10 min at 75◦C for enzyme inactivation. These steps were carried out in a Thermal Cycler machine (MJ Research, Marshall Scientific, Hampton, NH). After dilution with 30µl of water, 1µl of the diluted reaction mix was used as template in the QRT-PCR. Reactions were done with FastStart SYBR Green Master mix (Roche) according to the manufacturer’s instructions at a final primer concentration of 250 nM under the following conditions: 15 min at 95◦C, 40 cycles of 95◦C for 15 s, 60◦C for 25 s, and 72◦C for 25 s. The fluorescence intensity of SybrGreen dye was detected after each amplification step. Melting temperature analysis was done after each reaction to check the quality of the products. Primers were designed using the online Roche Universal Probe Library Assay Design Center. The quality of the primers was verified by MS analysis provided by Bioneer (Daejeon, Republic of Korea).
Relative expression ratios were calculated as normalized ratios to MmRpl27 (Mus musculusribosomal protein L27) gene. Non- template control sample was used for each PCR run to check the primer-dimer formation. The final relative gene expression ratios were calculated as delta-delta Ct values. Information about the genes and the primers is collected inTable S1.
RNA Isolation, Reverse Transcription, and TaqMan Panel
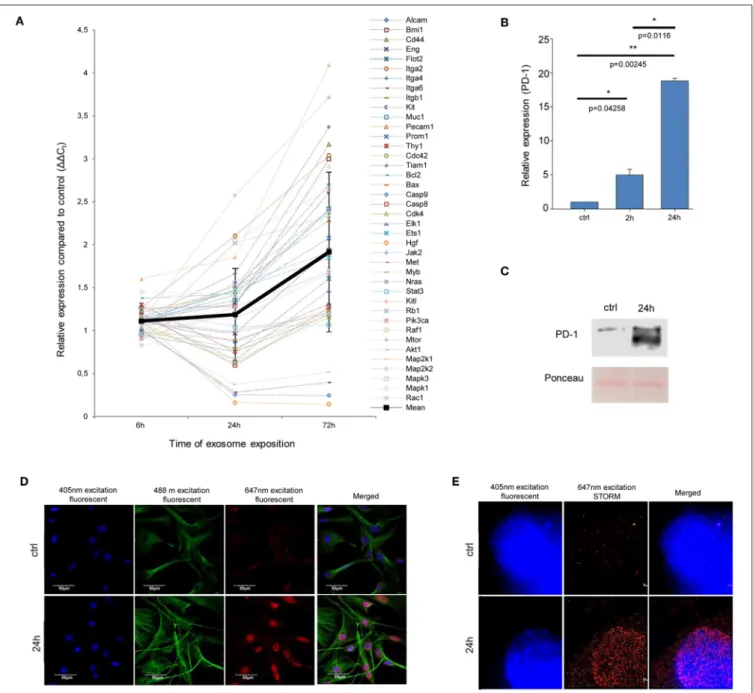
RNAs were isolated from MSC cells with Qiagen RNeasy mini kit (Qiagen) based on the manufacturer’s instruction. RNA concentrations were measured by NanoDrop spectrophotometer (NanoDrop). cDNAs were reverse transcribed with TaqMan Reverse Transcription Reagents (Thermo Fisher Scientific) following the manufacturer’s instruction. For the TaqMan QRT- PCR panel, cDNA mixture of three parallel samples was used in case of each condition: control, 6, 24, and 72 h exosome treatment applied on MSC cells derived from four mice. Eighty nanogram cDNA and TaqMan Gene Expression Master Mix (Thermo Fisher Scientific) were used for the qPCR experiment. Expression of the examined 44 genes was calculated by 11Ct method and normalized to the average Ct values of 4 internal controls (PPIA, 18S RNA, ACTB, and GAPDH).
PD-1 Detection
PD-1 detection by Western blotting
The cells were washed three times in PBS, then were lysed in TENT Buffer (50 mM Tris-HCl, 2 mM EDTA, 150 mM NaCl, 1% TritonX-100, completed with 1x protease inhibitor cocktail (Roche). Protein samples were separated and blotted as described above.
For PD-1 protein level detection, anti-PD-1 (clone: RMO1- 14, Biolegend) antibody was used in 1:1,000 dilution. Anti-rat horseradish peroxidase (HRP)-conjugated secondary antibody (R&D Systems) was used in 1:500 dilution.
PD-1 detection by Immunofluorescence microscopy
MSC cultures were fixed with 4% paraformaldehyde for 10 min, and blocked in PBS buffer containing 5% BSA (Sigma-Aldrich) for 60 min at room temperature. After blocking, cells were incubated with primary antibody in DPBS buffer containing
1.2% BSA overnight at 4◦C. As primary antibodies, 1:200 anti- PD-1 (clone: RMO1-14, Biolegend,) and 1:200 anti-MLANA (Byorbit) were used. After incubation, cells were washed three times in PBS, and incubated for 1 h at room temperature with 1:100 Alexa Fluor 647-conjugated anti-rat antibody (Jackson ImmunoResearch Laboratories, Baltimore, PA) or 1:500 Alexa Fluor 555-conjugated anti-rabbit antibody (Thermo Fisher Scientific). Tubulin was stained with 1:500 Alexa Fluor 488- conjugated anti-tubulin-α antibody (clone: 10D8, Biolegend).
Nucleus staining was performed using DAPI (Life Technologies).
Slides were washed three times with DPBS between each step.
Images were obtained at 60x magnification using an Olympus confocal laser scanning microscope.
PD-1 detection by STORM super-resolution imaging
All dSTORM super-resolution experiments were performed on a custom-made inverted microscope based on a Nikon Eclipse Ti-E frame. After being conditioned (through spatial filtering via fiber coupling and beam expansion) the applied laser beams were focused into the back focal plane of the microscope objective (Nikon CFI Apo 100x, NA=1.49), which produced a collimated beam on the sample. The angle of illumination was set via a tilting mirror mounted into a motorized gimbal holder and placed into the conjugate plane of the sample. All the dSTORM images were captured under EPI illumination at an excitation wavelength of 647 nm (Nikon: 647 nm, 300 mW). The laser power, controlled via an acousto-optic tunable filter (AOTF), was set to 4 kW/cm2on the sample plane. An additional laser (Nichia, Anan, Tokushima, Japan, 405 nm, 60 mW) was used for both reactivation and reference measurements. Images were captured by an Andor iXon3 897 BV EMCCD digital camera (512×512 pixels with pixel size of 16µm). The size of the illuminated region of the sample was matched to the size of the detector, which determined the field of view (FOV=80×80µm2). Frame stacks for dSTORM super-resolution imaging were typically captured at a reduced image size (crop mode), when only the central 128 × 128 pixel region was selected. A fluorescence filter set (Semrock, Rochester, NY, LF405/488/561/635-A-000) was used to select and separate the excitation and emission lights in the microscope. Additional emission filters (Semrock, BLP01- 647R-25) were used in the detection path to further clean the fluorescent light spectrally for the reduction of spectral crosstalk.
During the measurements, the perfect focus system of the microscope was used to keep the sample in focus with a precision of<30 nm. The storage buffer on the sample was replaced with a special switching buffer (20). Typically, 10,000 frames were captured with an exposure time of 30 ms. Reference images with full size FOV were captured at low intensity when the majority of fluorescent molecules were still active and the overall structure of the labeled sample could be visualized.
The captured and stored image stacks were evaluated and analyzed by rainSTORM localization software (21). The individual images of single molecules were fitted with a Gaussian point spread function and their center positions were associated with the position of the fluorescent molecule. Localizations were filtered via their intensity, ellipticity and standard deviation values. Localizations with precisions of<45 nm were only used
to form the final image. The estimated mean precision of the accepted localizations was 19 nm. Mechanical drift introduced by either the mechanical movement of the sample or thermal effects was analyzed and reduced by means of a blind drift correction algorithm. Spatial coordinates of the localized molecules were stored and the final super-resolved image was visualized. The multicolor merged images were generated by ImageJ software.
In vivo Experiments
Mouse Model
B16F1 melanoma cells were administrated intravenously (1×10⁵ cell/100 µl) to 6–8 week old female C57BL/6N mice (Charles River Laboratories). One week later, tumor bearing mice were randomized and divided into 3 groups (n = 10/group). Mice were injected intravenously with control buffer (100µl), exosome exposed MSCs (1× 10⁵ cell/100 µl) or exosomes (40 µg/100 µl) 7, 8, 9, 10, 11 days after the tumor injection (Table S2).
One week after the first MSC administration, 3 animals/group were euthanized, their lungs were removed, photographed and stored at −80◦C for further protein, mRNA and histological analyses. The remained mice were observed for 10 more days.
At the end point, the animals were euthanized, and the tumor metastases were investigated not only in their lung, but also in their entire body and removed for histological analysis.
Experiments were repeated 3 times. All animal experiments were performed in accordance with national (1998. XXVIII;
40/2013) and European (2010/63/EU) animal ethics guidelines.
The experimental protocols were approved by the Animal Experimentation and Ethics Committee of the Biological Research Centre of the Hungarian Academy of Sciences and the Hungarian National Animal Experimentation and Ethics Board (clearance number: XVI./03521/2011 and XV./78/2018).
Tumor Coverage
Tumor coverage of lungs was determined by the analysis of acquired images using the ImageJ software. The area of tumors and the healthy regions was measured and the mean percentage, SD, andpvalues were calculated in Microsoft Excel.
Quantification of Metastases Associated Vessel Diameters
From native animal lungs 4µm criostat sections were made on silanized slides, than fixed and retrieved by Fix and Perm A-B solution (Thermo Fisher Scientific, USA) for 20 min. Sections were counterstained by conventional hematoxilin for 30 min than washed in tap water and coverslipped. Sections were digitalized by automatic slide-scanner (3DHistech, Hungary), using the software 3DHISTECH Pannoramic Viewer (3DHistech, Hungary). Strict tumor border was carefully marked then vessel diameters were measured.
Cytokine and Chemokine Array
Lung samples were lysed in NP40 cell lysis buffer (Thermo Fisher Scientific, USA) and protein content was measured by the Pierce BCA Protein Assay kit (Thermo Fisher Scientific, USA).
Expression levels of different cytokines in pooled lung specimens were determined using Mouse Cytokine Array Panel A (R&D
Systems, Cat. no. ARY006), according to the manufacturer’s instructions. Immunoreactive signals were detected by using LI- COR ODYSSEY Fc (Dual-mode imaging system) imager followed by analysis with Image Studio Lite v5.2.
Custom TaqMan Array Panels
QRT-PCR was performed on an ABI Prism 7000 sequence detection system (Applied Biosystems) using specific pre- designed customized 96-well TaqMan Array oncogene panels (Thermo Fisher Scientific) containing 44 specifically selected primers and probes according to extensive literature work.
Total RNA was isolated using TRIzol (Thermo Fisher Scientific), DNase treatment was performed according to the manufacturer’s protocol, and then total RNA was transcribed into cDNA using High Capacity cDNA Kit (Thermo Fisher Scientific). PCR amplification was performed using TaqMan primers and probes and thermal cycle conditions were set as follows: 2 min at 50◦C, 10 min at 95◦C, and 40 cycles of 15 s at 95◦C and 1 min at 60◦C. As internal control transcripts of ACTB (Assay ID:
Mm00607939_s1), GAPDH (Assay ID: Mm99999915_g1), and PPIA (Assay ID: Mm02342430_g1) were determined.
The amount of the transcripts was normalized to those of the housekeeping genes using the 1Ct method. Finally the results were normalized to the expression of the vehicle control (11Ct method).
For relationship discovery Hierarchical Cluster Analysis was performed by R software. In detail, the “bottom up”
agglomerative hierarchical clustering strategy was used and results represented in a tree-based dendrogram [For refer the R software: (22)].
Network Representation by Ingenuity Pathway Analysis
According to literature data, we established a protein network from the in vivo overexpressed genes. A custom graphical representation of this network was generated using the Path Explorer tool of the IPA Path Designer. Genes are represented as red nodes, using various shapes that represent the functional class of the gene product. In a few cases proteins are substituted with the complex, which they are involved in.
To identify the potential exosomal factors, which can induce the activation of the network, a list was generated from the exosomal proteins detected by LC-MS/MS and the exosomal miRNAs identified by SOLiD sequencing. The Grow tool in the IPA Path Designer revealed significant interactions between the network and the generated list (the interacting exosomal factors are listed in gray boxes and the types of relationships are indicated in parentheses). During construction in the IPA, the significance level was set to “experimentally observed” data to avoid the representation of predicted, unproven interactions.
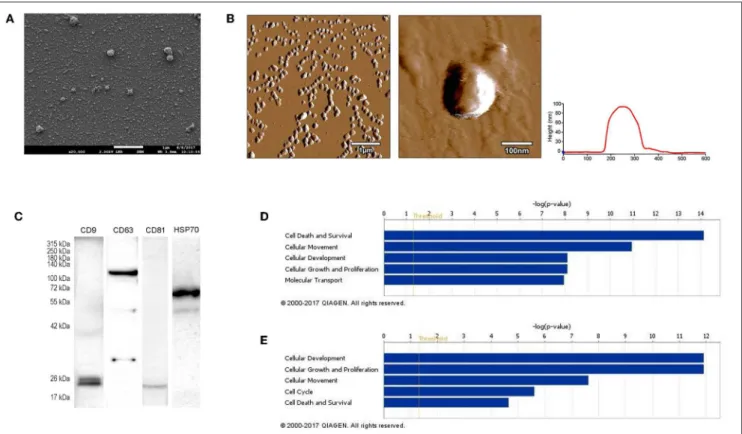
FIGURE 1 |Characterization of B16F1 melanoma cell culture-derived exosomes.(A)Scanning electron micrograph of melanoma exosomes.(B)Atomic force microscopy images of exosomes. Left and middle pictures represent the shape and surface topography of vesicles, right graph represents height profile.(C)Western blot analysis of common exosome markers (CD9, CD63, CD81, and HSP70).(D,E)Top 5 molecular and cellular functions identified by Ingenuity Pathway Analysis of exosomal proteins and miRNAs.
TABLE 1 |List of exosomal proteins identified by LC-MS/MS.
ID Symbol Entrez gene name
P97857 ADAMTS1 ADAM metallopeptidase with thrombospondin type 1 motif 1 Q3TNX8 ADAMTS4 ADAM metallopeptidase with
thrombospondin type 1 motif 4 Q640N1 AEBP1 AE binding protein 1
P05064 ALDOA Aldolase, fructose-bisphosphate A
P97429 ANXA4 Annexin A4
P48036 ANXA5 Annexin A5
P08226 APOE Apolipoprotein E
Q3TWT5 ASAH1 N-acylsphingosine amidohydrolase 1 Q3TXF9 ATP1A1 ATPase Na+/K+transporting subunit alpha 1 P97370 ATP1B3 ATPase Na+/K+transporting subunit beta 3 Q1XID4 ATP6AP2 ATPase H+transporting accessory protein 2 Q9JL18 BACE2 Beta-site APP-cleaving enzyme 2
O55107 BSG Basigin (Ok blood group)
Q8R2Q8 Bst2 Bone marrow stromal cell antigen 2
Q9WVT6 CA14 Carbonic anhydrase 14
P41731 CD63 CD63 molecule
P35762 CD81 CD81 molecule
P10605 CTSB Cathepsin B
P18242 CTSD Cathepsin D
P29812 DCT Dopachrome tautomerase
P57776 EEF1D Eukaryotic translation elongation factor 1 delta
Q3UAM9 ENG Endoglin
P17182 ENO1 Enolase 1
P19096 FASN Fatty acid synthase
P30416 FKBP4 FK506 binding protein 4
P11276 FN1 Fibronectin 1
P09528 FTH1 Ferritin heavy chain 1
P16858 GAPDH Glyceraldehyde-3-phosphate dehydrogenase P08752 GNAI2 G protein subunit alpha i2
Q3TAV1 GPNMB Glycoprotein nmb
P19157 GSTP1 Glutathione S-transferase pi 1
P11499 HSP90AB1 Heat shock protein 90 alpha family class B member 1
B1B0C7 HSPG2 Heparan sulfate proteoglycan 2
Q9CQW9 IFITM3 Interferon induced transmembrane protein 3 G3UYZ1 IGSF8 Immunoglobulin superfamily member 8 Q91VK4 ITM2C Integral membrane protein 2C P02468 LAMC1 Laminin subunit gamma 1
Q60961 LAPTM4A Lysosomal protein transmembrane 4 alpha P35951 LDLR Low density lipoprotein receptor Q07797 LGALS3BP Galectin 3 binding protein
Q3U2W5 LGALS8 Galectin 8
P16056 MET MET proto-oncogene, receptor tyrosine kinase
P21956 MFGE8 Milk fat globule-EGF factor 8 protein
Q2TA50 MLANA Melan-A
Q6NVG5 MREG Melanoregulin
Q9EPX2 PAPLN Papilin, proteoglycan like sulfated glycoprotein
(Continued)
TABLE 1 |Continued
ID Symbol Entrez gene name
Q3UIP2 PCOLCE Procollagen C-endopeptidase enhancer Q811J2 LOC72520 LOC72520 protein
Q80Y09 PDCD6IP Programmed cell death 6 interacting protein
P62962 PFN1 Profilin 1
P09411 PGK1 Phosphoglycerate kinase 1
P52480 PKM Pyruvate kinase, muscle
Q9CZB2 PMEL Premelanosome protein
P17742 PPIA Peptidylprolyl isomerase A
P35700 PRDX1 Peroxiredoxin 1
Q61171 PRDX2 Peroxiredoxin 2
Q543S0 PRELP Proline and arginine rich end leucine rich repeat protein
P53994 RAB2A RAB2A, member RAS oncogene family Q8CCG5 RALB RAS like proto-oncogene B
O89086 RBM3 RNA binding motif (RNP1, RRM) protein 3 P35980 RPL18 Ribosomal protein L18
Q3U5P4 SCPEP1 Serine carboxypeptidase 1 O08992 SDCBP Syndecan binding protein
Q0VGP2 SEMA3B Semaphorin 3B
P32261 SERPINC1 Serpin family C member 1 P10852 SLC3A2 Solute carrier family 3 member 2 Q3UQM7 SLC7A5 Solute carrier family 7 member 5 O09044 SNAP23 Synaptosome associated protein 23
Q64337 SQSTM1 Sequestosome 1
Q8CI59 STEAP3 STEAP3 metalloreductase
Q3TDG9 STX12 Syntaxin 12
O70439 STX7 Syntaxin 7
P40749 SYT4 Synaptotagmin 4
O88968 TCN2 Transcobalamin 2
Q542D9 TFRC Transferrin receptor
P39876 TIMP3 TIMP metallopeptidase inhibitor 3 Q4FJX7 TINAGL1 Tubulointerstitial nephritis antigen like 1 Q9DCS1 TMEM176A Transmembrane protein 176A Q9R1Q6 TMEM176B Transmembrane protein 176B Q9CZX7 TMEM55A Transmembrane protein 55A Q9QY73 TMEM59 Transmembrane protein 59
O88746 TOM1 Target of myb1 membrane trafficking protein O89023 TPP1 tripeptidyl peptidase 1
Q3UCW0 TSG101 Tumor susceptibility 101
Q4FJW7 TSPAN4 Tetraspanin 4
Q8BJU2 TSPAN9 Tetraspanin 9
P11344 TYR Tyrosinase
P07147 TYRP1 Tyrosinase related protein 1
O70404 VAMP8 Vesicle associated membrane protein 8 Q8R0J7 VPS37B VPS37B, ESCRT-I subunit
Q8R105 VPS37C VPS37C, ESCRT-I subunit
O88384 VTI1B Vesicle transport through interaction with t-SNAREs 1B
A8DUQ1 HBBT1 Beta-globin
P70356 MELA Gag-pol poliprotein
P70355 MELA Envelope protein
Statistical Analysis
All of the data are presented as the mean ± SD or SEM and represent minimum of three independent experiments. Statistical parameters including statistical analysis, statistical significance, and n value are reported in the figure legends. For in vivo experimentsn=number of animals. For statistical comparison, we performed two-tailed Student’s t-test. A value of p < 0.05 was considered significant [represented as ∗p < 0.05, not significant (n.s.)].
RESULTS
Isolated Vesicles Show Exosomal Properties
First, we isolated extracellular vesicles from B16F1 mouse melanoma cells. As it was shown by SEM and AFM (Figures 1A,B), the isolated fraction indeed contained exosomes as the particles were cap-shaped, and their size was within the 40–120 nm range. Then, presence of molecules (CD9, CD63, CD81, and HSP70), characteristic for exosomes (4, 17) was assessed by Western blotting (Figure 1C).
Exosomes were then subjected to large-scale analysis to determine their protein and miRNA profiles. Whole proteome analysis (using LC-MS/MS) and bioinformatics tools (used to identify elements of the exosome’s proteomics spectrum in the UniProt database, and to compare the findings with entries of the ExoCarta database) revealed that 95 distinct proteins were identified in melanoma exosomes (Table 1).
These proteins exhibited 86.3% overlap with molecules listed as characteristic exosome protein markers in ExoCarta. Further, miRNA sequencing (using SOLiD 5500xl technology) identified 168 known miRNA elements (Table 2) which, similarly to the proteomics data, exhibited a large (93.5%) overlap with molecules listed as characteristic exosome miRNA markers in ExoCarta.
To uncover the functional significance of the proteomics and miRNA sequencing data, IPA was employed. This analysis has shown that the identified proteins most probably participated in cellular and molecular processes such as “Cell Death and Survival,” “Cellular Movement,” “Cell-to-Cell Signaling and Interaction,” “Cellular Growth and Proliferation,” and “Cell Morphology” (Prange =7.53×10⁻¹⁵-9.32×10⁻⁴significance range) (Figure 1D). Very similarly to these data, functions of the identified miRNAs were suggested to be linked to mechanisms of “Cellular Development,” “Cellular Growth and Proliferation,” “Cellular Movement,” “Cell Cycle,” and “Cell Death and Proliferation” (Prange = 1.25× 10⁻¹²-4.88×10⁻² significance range) (Figure 1E).
Tumor Exosome Exposure Resulted in Oncogenic Reprogramming of MSCs in vitro
Then, we investigated the effect of exosomes on biological processes (e.g., proliferation, survival, malignant transformation, etc.) of MSCs, which are generally considered as properin vitro models of tumor stroma (12). For these experiments, MSC
TABLE 2 |List of exosomal miRNAs identified by SOLiD 5500xl technology.
Symbol Seed regio ID
let-7a-3p UAUACAA mmu-let-7a-1-3p
mmu-let-7b-3p mmu-let-7c-2-3p mmu-let-7f-1-3p
let-7a-5p GAGGUAG mmu-let-7a-5p
mmu-let-7b-5p mmu-let-7c-5p mmu-let-7d-5p mmu-let-7e-5p mmu-let-7f-5p mmu-let-7g-5p mmu-mir-98-5p
let-7d-3p UAUACGA mmu-let-7d-3p
let-7i-3p UGCGCAA mmu-let-7i-3p
miR-100-5p ACCCGUA mmu-mir-99a-5p
mmu-mir-99b-5p
miR-101-3p ACAGUAC mmu-mir-101a-3p
miR-103-1-5p GCUUCUU mmu-mir-107-5p
miR-103-3p GCAGCAU mmu-mir-103-3p
mmu-mir-107-3p
miR-10a-5p ACCCUGU mmu-mir-10a-5p
mmu-mir-10b-5p
miR-1191a AGUCUUA mmu-mir-1191a
miR-1249-3p CGCCCUU mmu-mir-1249-3p
miR-125b-5p CCCUGAG mmu-mir-125a-5p
mmu-mir-125b-5p mmu-mir-351-5p
miR-126a-5p AUUAUUA mmu-mir-126a-5p
miR-128-3p CACAGUG mmu-mir-128-3p
miR-129-1-3p AGCCCUU mmu-mir-129-1-3p
mmu-mir-129-2-3p
miR-129b-5p CUUUUUG mmu-mir-129b-5p
miR-130a-3p AGUGCAA mmu-mir-130a-3p
mmu-mir-130b-3p mmu-mir-301a-3p mmu-mir-301b-3p
miR-130a-5p CUCUUUU mmu-mir-130a-5p
miR-130b-5p CUCUUUC mmu-mir-130b-5p
miR-132-3p AACAGUC mmu-mir-132-3p
miR-132-5p ACCGUGG mmu-mir-132-5p
miR-135a-5p AUGGCUU mmu-mir-135a-5p
miR-138-5p GCUGGUG mmu-mir-138-5p
miR-139-5p CUACAGU mmu-mir-139-5p
miR-140-3p ACCACAG mmu-mir-140-3p
miR-140-5p AGUGGUU mmu-mir-140-5p
miR-142-3p GUAGUGU mmu-mir-142a-3p
miR-143-5p mmu-mir-143-5p
miR-144-3p ACAGUAU mmu-mir-144-3p
miR-144-5p GAUAUCA mmu-mir-144-5p
miR-145-5p UCCAGUU mmu-mir-145a-5p
(Continued)
TABLE 2 |Continued
Symbol Seed regio ID
miR-146a-5p GAGAACU mmu-mir-146a-5p
miR-148a-3p CAGUGCA mmu-mir-148b-3p
miR-151-3p UAGACUG mmu-mir-151-3p
miR-15a-3p AGGCCAU mmu-mir-15a-3p
miR-15b-3p GAAUCAU mmu-mir-15b-3p
miR-16-2-3p CCAAUAU mmu-mir-16-2-3p
miR-16-5p AGCAGCA mmu-mir-15a-5p
mmu-mir-15b-5p mmu-mir-16-5p mmu-mir-195a-5p mmu-mir-322-5p mmu-mir-497a-5p
miR-17-3p CUGCAGU mmu-mir-17-3p
miR-17-5p AAAGUGC mmu-mir-106b-5p
mmu-mir-17-5p mmu-mir-20a-5p mmu-mir-93-5p
miR-181a-1-3p CCAUCGA mmu-mir-181a-1-3p
miR-181a-5p ACAUUCA mmu-mir-181a-5p
mmu-mir-181b-5p mmu-mir-181c-5p mmu-mir-181d-5p
miR-1827 GAGGCAG mmu-mir-709
miR-1839-3p GACCUAC mmu-mir-1839-3p
miR-185-5p GGAGAGA mmu-mir-185-5p
miR-186-5p AAAGAAU mmu-mir-186-5p
miR-187-3p CGUGUCU mmu-mir-187-3p
miR-188-3p UCCCACA mmu-mir-188-3p
miR-188-5p AUCCCUU mmu-mir-188-5p
miR-18a-5p AAGGUGC mmu-mir-18a-5p
miR-191-5p AACGGAA mmu-mir-191-5p
miR-193a-3p ACUGGCC mmu-mir-193a-3p
miR-1981-3p AUCUAAC mmu-mir-1981-3p
miR-199a-3p CAGUAGU mmu-mir-199a-3p
mmu-mir-199b-3p
miR-199a-5p CCAGUGU mmu-mir-199a-5p
mmu-mir-199b-5p
miR-19b-3p GUGCAAA mmu-mir-19a-3p
mmu-mir-19b-3p
miR-204-5p UCCCUUU mmu-mir-211-5p
miR-21-5p AGCUUAU mmu-mir-21a-5p
miR-210-3p UGUGCGU mmu-mir-210-3p
miR-210-5p GCCACUG mmu-mir-210-5p
miR-219a-5p GAUUGUC mmu-mir-219a-5p
miR-22-3p AGCUGCC mmu-mir-22-3p
miR-22-5p GUUCUUC mmu-mir-22-5p
miR-221-3p GCUACAU mmu-mir-222-3p
miR-223-3p GUCAGUU mmu-mir-223-3p
miR-224-5p AAGUCAC mmu-mir-224-5p
miR-23a-3p UCACAUU mmu-mir-23a-3p
mmu-mir-23b-3p
(Continued)
TABLE 2 |Continued
Symbol Seed regio ID
miR-24-1-5p UGCCUAC mmu-mir-24-2-5p
miR-24-3p GGCUCAG mmu-mir-24-3p
miR-26a-5p UCAAGUA mmu-mir-26a-5p
miR-26a-5p UCAAGUA mmu-mir-26a-5p
mmu-mir-26b-5p
miR-27a-3p UCACAGU mmu-mir-27a-3p
mmu-mir-27b-3p
miR-29a-5p CUGAUUU mmu-mir-29a-5p
miR-29b-1-5p CUGGUUU mmu-mir-29b-1-5p
miR-29b-3p AGCACCA mmu-mir-29a-3p
mmu-mir-29b-3p mmu-mir-29c-3p
miR-3065-5p CAACAAA mmu-mir-3065-5p
miR-30c-5p GUAAACA mmu-mir-30a-5p
mmu-mir-30b-5p mmu-mir-30c-5p mmu-mir-30d-5p mmu-mir-30e-5p
miR-31-3p GCUAUGC mmu-mir-31-3p
miR-31-5p GGCAAGA mmu-mir-31-5p
miR-3176 CUGGCCU mmu-mir-378d
miR-324-5p GCAUCCC mmu-mir-324-5p
miR-328-3p UGGCCCU mmu-mir-328-3p
miR-329-3p ACACACC mmu-mir-362-3p
miR-33-5p UGCAUUG mmu-mir-33-5p
miR-330-5p CUCUGGG mmu-mir-326-3p
miR-331-3p CCCCUGG mmu-mir-331-3p
miR-339-5p CCCUGUC mmu-mir-339-5p
miR-340-3p CCGUCUC mmu-mir-340-3p
miR-344a-5p CAGGCUC mmu-mir-484
miR-345-5p CUGACCC mmu-mir-345-5p
miR-3473b GGCUGGA mmu-mir-3473b
mmu-mir-3473e
miR-34a-5p GGCAGUG mmu-mir-34a-5p
mmu-mir-34b-5p mmu-mir-34c-5p
miR-34c-3p AUCACUA mmu-mir-34b-3p
miR-350 UCACAAA mmu-mir-350-3p
miR-361-5p UAUCAGA mmu-mir-361-5p
miR-362-5p AUCCUUG mmu-mir-362-5p
miR-374b-5p UAUAAUA mmu-mir-374b-5p
miR-378a-3p CUGGACU mmu-mir-378a-3p
mmu-mir-378c
miR-378a-5p UCCUGAC mmu-mir-378a-5p
miR-3909 GUCCUCU mmu-mir-877-3p
miR-423-3p GCUCGGU mmu-mir-423-3p
miR-423-5p GAGGGGC mmu-mir-423-5p
miR-425-5p AUGACAC mmu-mir-425-5p
miR-451a AACCGUU mmu-mir-451a
miR-501-5p AUCCUUU mmu-mir-501-5p
miR-503-5p AGCAGCG mmu-mir-503-5p
(Continued)
TABLE 2 |Continued
Symbol Seed regio ID
miR-532-5p AUGCCUU mmu-mir-532-5p
miR-542-3p GUGACAG mmu-mir-542-3p
miR-574-5p GAGUGUG mmu-mir-574-5p
miR-582-5p UACAGUU mmu-mir-582-5p
miR-652-3p AUGGCGC mmu-mir-652-3p
miR-670-5p UCCCUGA mmu-mir-670-5p
miR-700-5p AAGGCUC mmu-mir-700-5p
miR-744-3p UGUUGCC mmu-mir-744-3p
miR-744-5p mmu-mir-744-5p
miR-7a-5p GGAAGAC mmu-mir-7a-5p
miR-872-3p GAACUAU mmu-mir-872-3p
miR-872-5p AGGUUAC mmu-mir-872-5p
miR-9-5p CUUUGGU mmu-mir-9-5p
miR-92a-3p AUUGCAC mmu-mir-25-3p
mmu-mir-32-5p mmu-mir-92a-3p
cultures were initiated from mouse abdominal adipose tissue (17) and were subjected to melanoma exosome treatment.
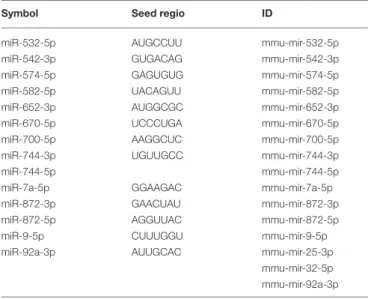
First, we assessed whether exosomes were internalized by MSCs. High-throughput microscopy showed that MSCs [labeled green by the DiOC18(3) lipid dye] indeed took up exosomes [labeled red by the DilC18(3) lipid dye] as early as 1–2 h after application (Figure S1). Importantly, after 24 h, the majority of MSCs were loaded by exosomes (Figures 2A,B). Indeed, image analysis and statistical evaluation revealed a 91% internalization efficacy. This suggests that functional alterations demonstrated by this study were due to exosome-induced cell-population, and not individual cell level effects.
Then, we determined whether the internalized exosomes could induce a melanoma-like malignant transformation of the MSCs. By employing two complementary cell-counting methods, we found that proliferation rate of the MSCs significantly accelerated 72 h after exosome exposure (Figure 2C). By flow cytometry, we also showed that the exosome-treated MSCs exhibited a partial resistance to the cell death-inducing effects of 100 ng/ml tumor necrosis factor-α (TNFα) as the fraction of the dead cells was significantly decreased in these cultures (Figure 2D).
Since the exosomes were isolated from melanoma cells, we were then intrigued to uncover whether the above alterations (which all argue for the malignant transformation of the susceptible cells) also resulted in de novo appearance of melanoma-specific features in the transformed MSCs. To answer this question, expression of the melanoma-specific markers MLANA and MITF were investigated. By QRT-PCR, we found that mRNA transcript levels of both markers elevated markedly in MSCs upon exosome treatment (Figure 2E and Figure S2), albeit the kinetics of elevation of the two molecules were slightly different. Moreover, in good accordance with the mRNA data, immunofluorescence labeling showed that exosome exposure markedly increased the expression of MLANA at the protein level as well (Figure 2F).
Next, we assessed whether the above effects of exosomes inducing a malignant-like transformation of the MSCs was
accompanied by a cellular-molecular oncogenic reprogramming of the target cells. Naïve MSCs were exposed to a standardized volume of exosomes for various time intervals (to avoid the experimental fluctuations, we collected pooled samples from multiple independentin vitroexperiments). Then, samples were subjected to QRT-PCR analysis using a self-designed panel of 40 oncogenes and tumor suppressor genes which were previously suggested to play a role in melanoma progression (Table 3).
As shown in Figure 3A, gene expression pattern of MSCs exposed to melanoma exosomes, exhibited a clear oncogenic dominance (compared to the non-exposed cells). This was verified by statistical analysis of the mean relative gene expression levels of all molecules investigated. Statistically higher values were obtained in the case of exosome-treated cells (p= 1.9× 10⁻⁵,p=0.031 andp=2.3×10⁻⁸for the 6, 24, and 72 h time points, respectively).
As mentioned above, Kleffel et al. has recently shown that melanoma cell subpopulations which overexpress PD-1, quite intriguingly exhibit remarkably increased invasiveness and aggressive growth properties (15). However, the authors did not define the factor(s) which induced the above PD-1 overexpression. Since the above finding strongly suggested an
“MSC re-education” capacity of melanoma exosomes to induce malignant-like behavior, we next assessed the expression of PD-1 in MSC cultures.
As expected, only insignificant PD-1 expression (both at the mRNA and protein levels) could be identified in control, non- treated MSCs. In contrast, a marked, significant, and time- dependent elevation of PD-1 expression was detected upon exosome treatment by QRT-PCR (Figure 3B), Western blot and an immunocytochemical analysis (Figures 3C,D). Further, by employing super-resolution microscopy, we were able to identify a dramatic upregulation of PD-1 at the single molecular level in exosome-treated MSCs (Figure 3E).
Importantly, since proteomics analysis did not identify the presence of PD-1 in exosomes, these data suggest that the high PD-1 protein content in exosome-exposed MSCs was a result ofde novoinduction and not of exosome-mediated molecular transfer. Our findings therefore suggest that melanoma exosome- mediated “re-education” of the cells resulted in a novel MSC population which could be identified as MSCPD-1+.
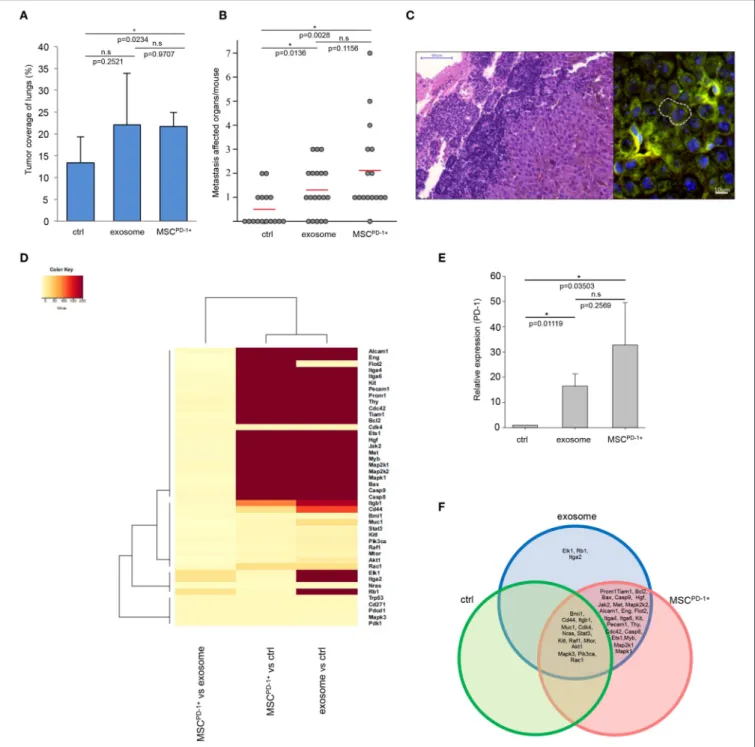
B16F1 Exosomes Augment in vivo Tumorigenesis and Tumor Progression
After presenting evidence for thein vitrotumorigenic induction potential of exosomes on cultured MSCs, we hypothesized that this phenomenon could be identified in vivo as well. To probe this assumption, we employed the well-known animal model, routinely used in our laboratories (46), in which tumors, developed mostly in the lungs, are induced in mice by intravenous administration of mouse B16F1 melanoma cells (to the tail vein). Then, tumor-bearing mice received buffer, or exosomes isolated from the same B16F1 melanoma cells, or exosome-induced MSCPD-1+cells.
Notably, the exosome-related groups (i.e., exosome, MSCPD-1+) were characterized by a markedly increased size of tumor-covered lung tissues (the increase proved to be significant in the MSCPD-1+ group) (Figure 4A). Of further
FIGURE 2 |Internalized melanoma exosomes induce malignant transformation of the recipient MSCs.(A)Fluorescent images of exosome uptake by MSCs. DiO (green lipid dye)-labeled cells were exposed to Dil (red lipid dye)-labeled exosomes for 24 h and fixed in 4% PFA. Control cells were treated in the same manner without exosomes. Pictures were acquired by an Operetta high content screening system (Perkin Elmer). Lower two images represent an experiment, where nuclei were counterstained with DAPI. Exosomes were detected with a customized version of A-trous wavelet transform, and were highlighted with yellow.(B)Quantitative analysis of exosome uptake. The graph shows the number of detected exosomes (Y axis) in each cell (X axis) in three exosome-exposed (24 h) and three control cell cultures (ctrl).(C)Cell proliferation assay of exosome-exposed MSCs. Cells were plated at 1×10⁴cell/cm2density in control and exosome-exposed cultures, and 72 h after the exosome treatment, the cell number was determined by manual counting and by an automated cell counter. Both methods showed a significantly increased cell proliferation of exosome-treated cells. Results are presented as mean±SD (n=3).(D)Apoptosis analysis of exosome-exposed MSCs by flow cytometry.
Exosome-pre-exposed cells were treated by 100 ng/ml TNFαfor 24 h, stained with Annexin V-FITC and propidium iodide. They were analyzed by flow cytometry both in the case of the TNFα-treated and the untreated control cell cultures. The graph represents the percentage of early apoptotic, late apoptotic and necrotic cells. Both TNFα-induced total cell death (Σ) and necrosis were significantly lower (Σp=0.03 andp=0.02, respectively) in exosome-pretreated cell cultures compared to the corresponding control cells. Results are presented as mean+SD (n=3).(E)QRT-PCR analysis of Mlana and Mitf in MSC cultures treated by exosomes in every 24 h indicated by arrows in the graph. The expression of both mRNAs increased after exosome exposure, but they showed different kinetics.(F)Fluorescent
immunocytochemistry of MLANA in exosome-exposed MSC cultures using a primary rabbit antibody to MLANA and a secondary AlexaFluor555-conjugated antibody to rabbit IgG (red).α-tubulin network of cells was directly labeled by an AlexaFluor488-conjugated antibody (green) and the nuclei were stained with DAPI (blue).