However, it can be harmful when coordination patterns are limited, or when social efficiency differs from the goals of decision makers (eg, in oligopoly). Starting from the non-cooperative equilibrium, the representative citizen would either benefit or be harmed by some degree of international tax coordination. It is precisely the purpose of regional tax coordination (or simply centralized taxation) in this leftist view, since governmental goals are identified as social.
Indeed, we can hardly believe that the coordination activity of regions, once started, can stop at infinitesimal changes (just as competition cannot stop once started). More realistic is to expect, that after the constitutional rules of the game begin to make cooperation possible, the cooperation will develop to its full extent, to some new equilibrium in this new coordination game.9. The findings of the current paper 1) adjust E&K's local "undertax measure". for our extended context, 2) use it to identify economic conditions, when global switch from competition to coordination welfare is warranted.
In Section 3, the question of welfare comparison between competition and coordination .. in large” is decomposed into two sub-questions. If both answers are positive, there is no need to "jump" from competition to coordination.
Entrepreneur’s residual and tax revenue: what is the pie to be splitted?
Legislator’s and governor’s objectives: what is (non-) benevolence?
This mainly includes households' satisfaction, but some benefits to business can also be assumed, unless it causes non-convexity of optimization programs. So, decisive for the follow-up is only the difference between governor's goals and federal legislature's goals (β∗, γ∗, λ∗). As for the legislator's attitude towards luxury, we will assume that he (not entirely realistically) opposes luxury at the regional level: λ∗ =λi∗ =λj∗ = 0.
But both of these options do not play an important role in our discussion, since the federal legislature hardly has an obvious way to implement such a policy, due to the agency problem and the lack of information about the actual tax base. The latter may not be the case for at least two reasons that need to be explained: 1) populism; 2) export tax. We put the name of "populism" to all situations where local governments are following the goals of their voters (mainly families) in a very direct way.
Solution concept and assumptions: what is tax-competition equilibrium?
Leviathan” regarding overload, due to its specific position in the political game. If one of them is in some sense 'more quickly satiable', then the demand for this good is concave. It is difficult to say, is it a realistic assumption or not, to assume that the governor's demand for public goods will be "satisfied more quickly" than the demand for luxury, as we need.
The reason for the assumption is that it is closely linked to the uniqueness of equilibria and it is very difficult to make welfare predictions 'large' without it. This assumption is only used in one section to compare the magnitude of coordination and equilibrium tax rates and it is explained when it is used. To answer the question, there may be a general approach (applicable to many types of coordination regimes) that combines reasoning 'in-small' with global comparisons, as we shall now see.
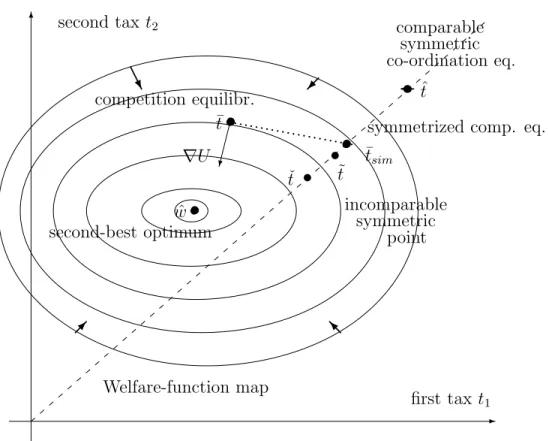
15 As mentioned earlier, it is not easy to make any predictions without serious constraints such as concavity. Basically, this formula makes it possible to transfer "in a small" (marginal) indicator of overload in a "large" (global) indicator. Moreover, unlike Edwards and Keen's 'in-small' indicator, which only holds for symmetrically equal regions and symmetrically increasing taxes, this formula qualifies the whole set of welfare-reducing change directions for quite general situations (the set is half - space above the dashed line).
It is only a sufficient, not necessary, condition: if the coordination point is located like point ˜t, then it is incommensurable. Here the magnitude ˙g∗iT(T) is interpreted as the share of the increase in the regional budget that goes to general interest expenditure. When regions have more or less the same tax rate, it is reasonable to assume that the same investment projects implemented there generate almost the same tax revenues as here: (P . j6=1∂Tj/∂T1)≈kmoveT1 := (∂ T1move/∂ T1), otherwise wekmove must multiplyT1 by the relationship between the tax rates.
Under simplified assumptions, it suffices to know the mobility of net profit kmoveV(t) and the mobility of taxes kmoveT(t) (both of which may depend on the current situation), plus goodwill. We now turn to the main topic: the application of our diagnosis of welfare "in small" to a global comparison of federalist regimes. Sometimes it is realistic to assume majority rule (under our assumptions it means the median vote that provides a uniform peak of preferences for the tax rate).
Externalities at work: does co-ordination really increase taxes?
One case of tax rise: (almost) symmetric equilibria
So we need symmetry assumption and a mild additional assumption (assumption 4) about externality effect to avoid ambiguity. Let us study the region's objective function when it chooses its vote θ=θi ≥0 as the tax level and assumes itself to be a median voter or α voter. of expenditure problem to eliminate wi and obtain P. We cannot get monotonicity directly from concavity of the region's objective function used in competition, since here we must include externalities.
The first summation here is the second derivative of the competition problem, it must be negative by concavity. Now, to generalize our result a bit, recall that we assumed twice continuously differentiable functions. Note again, that we are not assuming identical or similar regions here, only taxa are assumed to be similar, so it is a rather broad generalization of "common wisdom".
Another special case: race to the bottom
Note again that we're not assuming the same or similar regions here, just that the taxes are assumed to be similar, so it's a broad enough "common wisdom" generalization. tries to make this measurement more practical and extends this approach to several aspects relevant to a federation like Russia: 1) regions can be assumed to be non-identical (heterogeneous country); 2) it is possible to study the taxation of individual industries or economic sectors, as well as the taxation of the entire economy; 3) in addition to corruption, another major source of ill will - populism - was included in the analysis; 4) the large leap from competition to coordination is considered alongside small or "incremental" regulation. If the index of "rivalry" is less than the index of "benevolence", then this is a sign that our economy is overburdened and taxation should be slightly reduced, since their difference measures the marginal social welfare from additional taxation. Let us explain how "regional demand for capital" and its "mobility" are derived from initial data on investment projects and why our assumptions about the demand function Di may be justified.
If we treat “project” as an economic actor (entrepreneur), we have in mind someone who knows the technology and would like to implement it with borrowed capital, or with his/her own capital. A typical project is characterized by a fixed total amount of required investments and by the expected gross profitability which we define as the revenues after deducting material costs, federal taxes and wages (it is unusual to exclude federal taxes from the 'gross profit', but this is useful here). Complete immobility would result in a diagonal matrix of gross profitability [πji] (profit of the jth project in the ith region), while perfect mobility can be reflected by a matrix where all columns [πi] coincide.
To analyze the response of investments to taxes, we need a compact display of the project data, i.e. the region's demand for capital function Di(p0, t1, .., tm), which is. If p∗j ≥ p0, the project can be fulfilled and it requires as much as dj investment from the capital market. To get regional capital demand, we simply sum up these requirements for all profitable projects that choose this region:24.
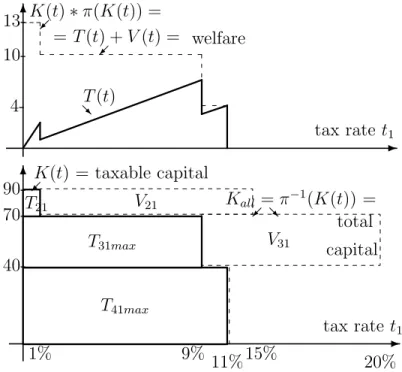
In other words, the i-th capital demand or "investment curve" can be constructed (for fixed other taxes) in the same way as the demand curve in any market where each consumer takes one unit. Second, represent each project with a rectangle aji(0, t−i)×dj and stack these rectangles on top of each other starting from the most extra-profitable at the bottom to the least profitable at the top. The top graph in this figure contains the integrals of the curves from the bottom graph to describe tax revenue T1(t) and entrepreneur residual V1(t) in our region 1.
23By the way, our model can be applied to the case where one region uses property tax, while the other region uses profit tax or some other tax.

Appendix 2: deriving welfare from capital demand
Then the capital supply is very elastic and p∗0(t) appears almost constant, so any taxes we apply make no difference to the welfare of investors (but for the case of insider investors and the small elasticity of Supp(.) makes our calculation of welfare has some bias). To get wealth from capital, we must first consider the simpler case: the property tax, which means that the tax base is the amount of capital employed itself and the tax revenue is defined as Ti(t). In the same way, we can also infer tax revenues and welfare in the “least disruptive” case.
Appendix 3: Example of rivalry index calculation
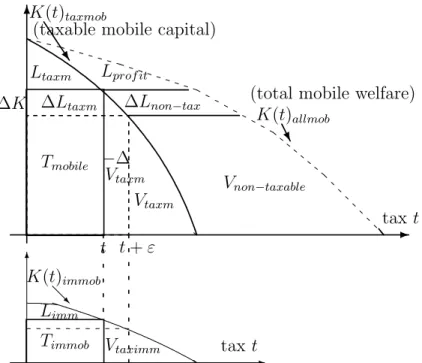
Note: as explained above, the capital function Ki(t) differs here from the distortionary taxation Ki(t), although the investment projects are the same.). taxable mobile capital) Ltaxm Lprof it. Suppose that the tax rate in our region has increased from t to t +ε, as in the picture, and the corresponding reduction in mobile capital amounted to ∆K = -1 (so, stationary ∆Kimm = -1/3). Consequently a part |∆Vtaxm + ∆Vimm| taxable profit (movable and immovable) is transferred from the welfare of entrepreneurs to additional tax revenue.
Still, some tax revenue ∆Ltaxm+ ∆Limm along with some surplus ∆Lprof is transferred to our additional deadweight loss, partly (∆Ltaxm + ∆Lprof) to the benefit of other regions. So, if we assume that our rival region #2 has a tax rate 2 times more than ours, the rivalry index can be expressed as. So one can calculate R1 using either our knowledge of 'budget starvation' ˙u2g˙2 in our rival region #2, or knowledge of its marginal excess burden, populism and corruption.
Appendix 4: concavity of indirect welfare function