CHEMICAL INDUSTRY AND VALUE-ADDED TRADE – A COMPARATIVE STUDY ON HUNGARY
AND POLAND
Pawel FOLFAS – Beáta UDVARI
(Received: 16 May 2017; revision received: 27 December 2017;
accepted: 16 May 2018)
Nowadays, global production networks (GPN) and global value chains (GVC) play an important role in the world economy intensifying the trade and production networks and resulting in prod- ucts having value-added in different countries. The analysis of how many intermediate products a country imports in order to produce a product and of how many products a country exports to another country in order to produce new products draws the attention to value-added trade. In the present study, we compare the Hungarian and Polish value-added trade of chemicals and chemical products. We use the OECD-WTO data of value-added trade, which is based on an input-output table. By calculating numerous indices, we reveal that the domestic value-added of chemicals and chemical products in the two countries was relatively low and should be increased by adequate economic policy.
Keywords: chemical industry, value-added trade, Hungary, Poland JEL classifi cation indices: F14
Pawel Folfas, Warsaw School of Economics, Collegium of World Economy, Warsaw, Poland.
E-mail : pawel.folfas@sgh.waw.pl
Beáta Udvari, corresponding author. Faculty of Economics and Business Administration, Institute of Finance and International Economic Relations, University of Szeged, Hungary.
E-mail: udvari.beata@eco.u-szeged.hu
1. INTRODUCTION
Nowadays, production has become globally fragmented owing to trade liberaliza- tion and the relatively free movements of capital and labour in many parts of the world. The production of a product is realized in several countries establishing the global value chain (GVC) or the vertical division of labour (WTO 2011), in which both less developed and more developed countries take part (OECD, WTO and World Bank Group 2014; Pomfret – Sourdin 2018). In order to be- come a participant in the GVC, a country needs to ensure the flow of inputs and outputs and the access to high quality trade services and information technology (Pomfret – Sourdin 2018). Concerning international trade, it should be analysed how many intermediate products a country imports in order to produce another product, and how many products a country exports to another country in order to produce new products (WTO 2011). As a result, the existence of GVC draws the attention to analysing international trade more carefully and to investigating value-added trade.
This paper aims at answering the question of how and why the content of do- mestic (foreign) value-added in the Hungarian and Polish gross exports of chemi- cals and chemical products changed during the years of 1995–2014. We assume that the share of foreign value-added in the gross exports of chemicals and chemi- cal products of these two countries rose because the role of Hungary and Poland in GVC has been changed.
A branch of chemicals and chemical products (C24 by the Organization for Economic Cooperation and Development (OECD) – World Trade Organisation (WTO) classification) was chosen because of numerous reasons. Firstly, in this branch production fragmentation plays a significant role, which is important in the context of domestic value-added share in gross trade. Secondly, other branch- es in the case of which production fragmentation is important – such as machin- ery, vehicles, electric and optic equipment – are frequently studied, so far there has been little discussion about the chemical industry.
The study is limited to the chemicals and chemical products, not including the whole industry called chemicals and non-metallic products (C23T26 by the OECD-WTO classification). This can be explained by the fact that the branch of coke, refined petroleum products and nuclear fuel (C23) are strongly affect- ed by the oil supply and its prices, which might cause some serious distortions in the analysis. Chemicals and chemical products include products, such as fertilizers, pesticides, pharmaceuticals, soap and detergents. Finally, chemicals and chemical products account for about 5% of the Polish and Hungarian gross exports.
The paper consists of three Sections: (i) literature review on value-added trade, (ii) general overview of chemical industry in the world and in Hungary and Po- land, and (iii) a detailed study on the value-added trade of chemicals and chemi- cal products in the two countries.
2. VALUE-ADDED TRADE
2.1. Literature review
Research in trade measured by value-added is a new form of analysing interna- tional trade. Its history goes back to the end of the first decade of the 21st century. It is not only a new approach but also important to empirical research in international economic cooperation, since analysing value-added trade differs substantially from analysing trade measured by gross value. The need for this new approach is quite simple: in the last few decades, trade in intermediate products has become more significant and trade in finished goods has lost space. Measuring gross trade (trade in finished goods) does not show the real picture of global relations (Grossman – Rossi-Hansberg 2007; Javorsek – Camacho 2015). For instance, if country A ex- ports intermediate goods worth 100 to country B, and country B exports final goods worth 110 to country C, the export from B to C measured by value-added is 10 (rather than 110 by gross measure), and the export from A to C is 100 (rather than 0).
Generally, in traditional terms, double (or triple, or multiple) counting may distort the results, and we cannot gain any relevant information on the multi-production networks (Power 2012; Johnson – Noguera 2012a; Javorsek – Camacho 2015).
Double counting may reach around one-third of total gross exports (Javorsek – Camacho 2015). These differences inspired experts of international economics and the WTO analysts. The World Trade Report 2013 (WTO 2013) contains a frag- ment devoted to the new method of measuring international trade of intermediate products and it is referred to as an example of the novel approach.
In numerous advanced economies (e.g. Australia, Japan or Western Europe), the share of export in GDP and the share of domestic value-added export in GDP is relatively similar, but in emerging economies, there is a large difference be- tween these two ratios showing that their exports contain more foreign value-add- ed (Power 2012). For example, Johnson – Noguera (2012a) reflected that trade imbalances between the US and China were 30–40% smaller in value-added trade than in gross trade. Concerning iPhone trade, Javorsek – Camacho (2015) point out that China gives only a small value-added to the iPhones exported to the USA, so the trade balance in value-added is much smaller than in the case of traditional
trade (–73.5 million USD and –1,901.2 million USD, respectively). However, exports from China are largely driven by foreign value-added: one-third of the Chinese exports contains foreign value-added, though it varies across industries (OECD – WTO 2015). The statistical results also represent that China has in- creased the domestic value-added part from 1995 to 2011 (OECD – WTO 2015).
In their analysis concerning Australia, Kelly – La Cava (2013) also conclude that value-added trade shows a more precise picture of the Australian trade. Further- more, Nagengast – Stehrer (2015) showed that there was a difference between gross trade and value-added trade in services and manufacturing industries during the great trade collapse after the 2007/8 global crisis. Johnson – Noguera (2012b) analysed the value-added trade in global terms over 40 years. They showed that there was a relatively large decrease in the share of value-added trade (10–15 per- centage points, p.p.) in the world; however, this fall differs across countries (0–25 p.p.). These results show that although a positive trend can be shown in the case of global gross trade, the analysis of real trade (value-added) shows the opposite.
Altogether, when analysing the value-added trade instead of (or besides) the traditional gross trade, one can understand the origin of domestic value-added, the role of domestic companies in exports and the impacts of a crisis (or other shocks) on trade better; and one gains a more precise picture of trade imbalances (Javorsek – Camacho 2015).
2.2. The concept of trade in value-added (TiVA) and value-added in trade (VAiT) The first way to measure trade by means of value-added is to calculate the value of trade (export and import) in value-added (TiVA). In these calculations, the size of demand for final goods is considered (final demand approach). In the case of exports, the size of demand is domestic value-added embodied in foreign final demand, that is, domestic value-added created to satisfy foreign final demand. As a result, we measure the intensity of relation between national manufacturers and foreign consumers, regardless of them being in direct commercial relation. Ana- logically, the imports of value-added measure how much of foreign value-added is embodied in domestic final demand (Stehrer 2012).
We start from discussing the formula for value-added exports (VAX) gener- ated in country 1. In order to calculate VAX, the values of shares of value-added in the global production (GP) in country 1 (for other countries, we put a zero vector), inverted Leontief matrices (determined based on international table of inter-industry flows) and the values of demands for final goods reported in all remaining countries (for country 1 we put zero values) are needed. As a result, the value-added exports from country 1 are:
11 1 12 1
1 2
1 1
VAX [ 0 . ]
0
0
m m
m mm m mm
0
L L
L L
f f
f v
f
(1)
Therefore, we will calculate the VAX generated in country i based on the equa- tion (2):
VAXi = viLf-i , (2)
where: vi consists of the vector of shares of value-added in the GP of country i and zero vectors for other countries, L is a set of inverted Leontief matrices, and f-i consists of the vectors of demand for final goods in all countries except for country i.
Analogical formulas for calculating value-added imports (VAM) by country 1 and country i are shown by equations (3) and (4):
(3)
VAMi = v-iLfi . (4)
By using formulas for value-added exports and imports, it is also possible to calculate the value of trade in value-added between the two countries i and j:
VAXij = viLfj , (5)
VAMij = vjLfi . (6)
The second way to measure trade by means of value-added is to calculate the content of value-added in trade (VAiT). It differs from TiVA because in calcula- tions, instead of the size of demand for final goods, the sizes of gross trade (ex- ports and imports) are considered. Thus, domestic value-added content of gross exports (DVAiX) of country i is:
DVAiXi = viLei , (7)
where: v i consists of the vector of shares of value-added in the GP of country i and zero vectors for other countries, L is a set of inverted Leontief matrices and ei consists of the vectors of gross export of country i. Analogically, foreign value- added content of gross exports (FVAiX) of country i is:
11 1
1 2
11
1 1
0 0
,
0 0
VAM [0 . ]m
m
m mm m
L L
L L
v v
f f
FVAiXi = v-iLei. (8) Based on formulas (7) and (8), the content of national and foreign value-added in the import of country i can be calculated by changing the set of vectors of gross exports into the set of vectors of gross import. While considering only the vector of gross exports (imports) to (from) the given country j, the content of national and foreign VAiT between i and j can be determined (Stehrer 2012).
Contrary to the concept based on the demand for final goods, when calculating the content of VAiT, the values of exports (imports) of both intermediate and final goods are considered. This results in double counting of the value-added. Thus, on the one hand, this fact (double counting) can be considered and appropriate values subtracted from DVAiX and FVAiX are calculated based on formulas (7) and (8). On the other hand, double counting refers to both national and foreign value-added. Therefore, if we want to calculate the percentage shares of DVAiX and FVAiX in the gross exports, use of formulas (7) and (8) is reasonable, and the information on double calculation of value-added can be presented separately.
It is worth noting that either with single or double counted value-added, DVAiX is a broader category than VAX (exports of value-added). The component that differentiates them is the content of domestic value-added in imports (DVAiM), or otherwise returned value-added generated in the country (Stehrer 2012).
In the followings, we will compare the value-added trade of Hungary and Po- land. Although most of the literature concentrates on manufacturing and services as a whole, we concentrate only one branch and we analyse how the value-added trade in chemical industry is developing in the two countries. Since only one branch is analysed, a more precise conclusion can be made.
3. CHEMICAL INDUSTRY – GENERAL OVERVIEW
Chemical industry is a significant manufacturing branch in both Western Europe and the United States. Besides the products of the chemical industry being regu- larly used in households or in further production, chemical industry is an impor- tant employer of labour force, too (MAVESZ 2015). Additionally, the developing countries can also play a quite important role in the global chemical industry, especially due to the fact that they are the host countries of dirty processing.
Chemical industry is a special industry in the GVC due to the specific char- acteristics of the chemical products as they contain several steps with complex activities (Kannegiesser 2008). Sometimes the “neighboured products” are pro- duced in one factory. Kannegiesser (2008) also details the main trends in the chemical industry, such as globalisation; consolidation of industries (mergers and acquisition); innovation with the emergence of new industries (e.g. bio technology,
nanotechnology); growing role of national, regional and global legislation (con- cerning health and trade issues); and the importance of sustainable development and environmental issues.
The innovations and researches in chemistry may play a crucial role to pro- mote sustainable development and build green economy via its green innovations (Debref 2012; Clark et al. 2012). As a result, chemical industry is shaped by pol- icy decisions on sustainability and resource efficiency (López – Montalvo 2015).
However, people find chemical industry hazardous and risky (Eurobarometer 2011), although products of the chemical industry are used in our daily life (elec- tronic machines, cleaning products, etc.). Furthermore, chemical industry offers inputs to other industries (e.g. metallurgical industries, mechanical and electrical, textile and clothing branches, automotive industry, stationery and printing prod- uct manufactures). The risk in chemical processing is very high (e.g. accidents, and its effects on human health), which resulted in a number of risk studies in scientific literature (e.g. Visan 2010; Gholami et al. 2015, 2016).
Concerning the European chemical industry, the largest EU Member States are the most dominant actors (MAVESZ 2015): Germany, France, the Nether- lands, the United Kingdom, Spain, Belgium and Italy account for 85% of the whole EU chemical sales in 2012. Comparing Hungary and Poland, Hungary gives 0.9% of the total EU chemical sales, while Poland performs a bit better and accounts for 2.8%.
In Hungary, the rise of the chemical industry started at the beginning of the 20th century, when the first chemical companies were established. However, World War I and the border changes caused severe problems in the industry; a signifi- cant resources remained outside the country (MAVESZ 2015). Although, World War II also destroyed one third of the chemical industry, the re-construction was extremely successful and by 1949 the Hungarian chemical production reached the pre-war production level. As a result of the intensive development and structural changes, the Hungarian chemical industry became one of the world’s best by the 1970s. This development continued in the 1980s, and new petrol-chemical invest- ments were realised in the country. As a result of the privatization in the 1990’s, the dominance of state-owned companies decreased sharply, and by 2000, 60% of the chemical companies were owned by foreign investors (MAVESZ 2015).
Although chemical industry is still an important branch in manufacturing, its share decreased during the transition period: before the transformation in 1990, the share of the chemical industry was more than 20%, while this proportion is below 10% nowadays. Currently about one fourth of the Hungarian industrial investments are realized in the chemical industry. The most dominant branch is petrol-chemical, and the largest companies are MOL, TVK and BorsodChem.
There are about 2000 enterprises in the chemical industry, although only 6 com-
panies have more than 2000 employees. The most important export markets are the EU and Russia; and they play a growing role.
The history of the Polish chemical industry is very similar to that of the Hun- garian one from several aspects. There was an intensive development after World War I when Poland became an independent state. The sector experienced an al- most total destruction during the World War II and a fast recovery under the Communist regime. This fast recovery was linked with the demand of the Soviet Union for Polish chemicals and with the destruction of natural environment in many regions of Poland. Despite the massive privatisation of many industries in the 1990s, the lion share of its chemical industry still belongs to state-owned companies (Kaliński – Landau 2003).
Figure 1 represents the chemical exports and imports of Hungary and Poland, and it also represents their share in the global chemical trade. Generally, in both countries the chemical imports are higher than the exports. This means that ex- pectedly these countries use intermediary chemical products for their own chemi- cal exports. The share of Polish and Hungarian chemical trade in global chemical trade shows how these countries take part in the global division of labour in the chemical field. In Poland, the share is higher. While in the case of Hungary the import and export share are very close to each other, in Poland the import share is much higher than the export share.
According to the statistics of the Polish Chamber of Chemical Industry, in 2011 the biggest (in terms of revenues and employment) enterprises manufac- turing chemicals and chemical products were state-owned companies, such as
Figure 1. Polish and Hungarian chemical exports and imports in thousand USD (left axis) and proportion in global chemical exports and imports (right axis)
Source: Authors’ own calculations based on UNCTADStat (2016).
Zakłady Azotowe “Puławy” S.A., Zakłady Chemiczne “Police” S.A. and Zakłady Azotowe w Tarnowie-Mościcach S.A. In 2003, the situation was very similar, consisting three biggest players in the market of chemicals and chemical products (Polish Chamber of Chemical Industry 2003). It seems that the situation in the market has been stable and the state-owned companies keep playing a signifi- cant role. During the period of 2010–2013, there was a merger between Zakłady Azotowe “Puławy” S.A., Zakłady Chemiczne “Police” S.A., Zakłady Azotowe w Tarnowie-Mościcach S.A. and a number of smaller enterprises. Consequently, Grupa Azoty S.A. was established, which improved the position of the state- owned companies in the Polish chemical industry. These state-owned companies specialise in manufacturing basic chemicals, especially fertilizers. The share of fertilizers in Polish exports of chemicals and chemical products declined from 18% in 1995 to only about 6% in 2011 (World Bank 2016). Thus, even if the state- owned companies have been enhancing their position and the share of domestic value-added in exports of these companies is relatively high, it is not enough to stop the tendency of falling domestic value-added share in Polish gross exports of chemicals and chemical products. Moreover, the share of soap and detergents in its exports of chemicals and chemical products grew from 8.5% in 1995 to al- most 25% in 2011 (World Bank 2016), and the production of soap and detergents is dominated rather by the transnational corporations than the Polish companies.
Consequently, the share of foreign value-added in the gross exports of chemicals and chemical products has been rising.
In the case of Hungary, chemical industry stands in a good position thanks to its good geographical location and the growing importance in the Russian and Ukrainian markets. At the same time, exports of pharmaceuticals appear to be crucial. According to COMTRADE statistics (World Bank 2016), the share of pharmaceuticals in exports of chemicals and chemical products in 1995 was about 22.5%, and in 2011 it became more than 45%. There were also some huge FDIs in the pharmaceutical branch coming from the EU into Hungary after its ac- cession to the EU – for example 275 million EUR in 2006 and 193 million EUR in 2007 (Eurostat 2016). All these numbers allow understanding of the increase of foreign value-added in Hungarian gross exports of basic pharmaceuticals and pharmaceutical products, and, consequently, that of all chemicals and chemical products.
The main challenge the Hungarian chemical industry faces is that basic materi- als have to be imported, and this may worsen the situation/perspectives/chances of value-added trade. Other factors explaining the worse results are as follows:
First, more than half of the Hungarian chemical companies are run by foreign investors. Second, although 60% of the manufacturing researchers work in the
chemical industry, the entire research and development (R&D) activity is rela- tively low in Hungary. For example, when Sanofi acquired Chinoin, the whole R&D activity was moved to France. Third, there is a lack of labour force1.
4. VALUE-ADDED TRADE IN THE HUNGARIAN AND POLISH CHEMICAL INDUSTRY
4.1. Methodological issues of our analysis
When analysing the value-added trade in the Polish and Hungarian chemical in- dustry, we conducted two research projects. Both aim at answering the question of how the content of domestic (foreign) value-added in these two countries’ gross exports (DVAiX and FVAiX defined in Chapter 2.2) of chemicals and chemical products has changed over the past two decades. We also tried to find the reasons of the changes, namely the statistical studies focus on the role of intermediate and final goods. The two statistical analyses only differ in terms of the used statistics and the years included.
The first research project was based on the statistics of OECD and WTO – Measuring Trade in Value-added: An OECD-WTO joint initiative (TiVA data- base). The database created and prepared in the framework of this joint initiative includes statistics concerning gross trade and value-added trade of the OECD and selected non-OECD countries between 1995 and 2011 (the last update of the database was made in December 2016). Unfortunately, the OECD-WTO da- tabase does not include most recent statistics, but we are still able to show long term tendencies (from the end of the transition period through the EU’s biggest enlargement and the global crisis to the economic rebound after the crisis). Avail- able statistics in this database refer to total trade as well as to trade in selected commodities and services. Unfortunately, the level of the disaggregation is not impressive (maximal 2-digit level industries). A branch of chemicals and chemi- cal products (C24 by the OECD-WTO classification) was chosen as the subject of the comparative analysis of value-added trade in Hungary and Poland.
The second research project is based on the World Input-output database (WIOD) (last update was in 2016), which includes statistics for years 2010–2014,
1 For example, a Japanese company wanted to settle a subsidiary in Szeged, which city has a well-known university with a strong Faculty of Natural Sciences. During the negotiation phase, it came up that the university could not ensure enough labour force in the field of chem- istry to this company because of the small number of students. Thus, the Japanese company chose another country.
and it contains more disaggregated statistics than the OECD-WTO database. The 2016 release of WIOD contains world Input-Output tables (WIOT) in current prices, denoted in millions of dollars. The database covers 28 EU countries and 15 other major countries from 2000 to 2014. Namely, we are able to distinguish chemicals and chemical products other than pharmaceuticals (we call them non- pharma chemicals and chemical products) and basic pharmaceuticals and phar- maceutical products.
4.2. Results of the fi rst project (TiVA database)
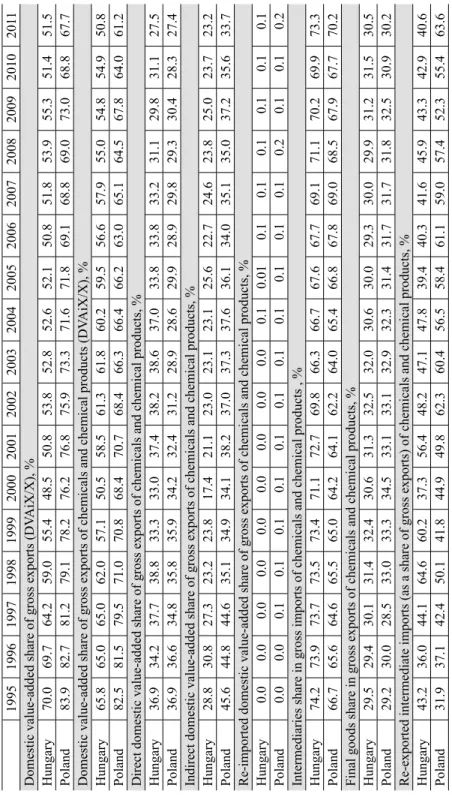
Since 1995, domestic value-added shares of Hungarian and Polish gross exports have been decreasing. In 2011, the share of Hungarian value-added in its gross exports accounted only for about 51.5% (in 1995 it was almost 70%). The share of Polish value-added in its gross exports was about 67.5% in 2011, compared to almost 84% in 1995 (Table 1a).
It seems that the most probable conclusion shown in Table 1a is the greater participation in global production networks (GPN) and GVC due to the intensive FDI inflows at the expense of smaller content of the domestic value-added in goods and services exported from Hungary and Poland, because these two coun- tries have become subcontractors (assemblies) for richer states. Such a condition can be considered unsatisfactory for a relatively well-developed country belong- ing to the EU (most integrated regional group of the world) for over 10 years.
A similar conclusion refers also to the gross exports of chemicals and chemical products (Table 1a). In 2011, the share of Hungarian value-added in Hungarian gross exports of chemicals and chemical products accounted only for about 51%
(in 1995 it was more than 66%; a fall by 15 p.p.). The share of Polish value-added in its gross exports was about 61% in 2011 compared with the amount of about 82.5% in the year 1995 (decrease by 21.5 p.p.).
In Hungary, the fall of 15 p.p. consists of the fall by 9.4 p.p. of direct domestic value-added, the fall by 5.6 p.p. of indirect value-added and the increase of 0.1 p.p. of re-imported domestic value-added. It means that the majority of the fall in Hungarian value-added share of gross exports of chemical and chemical products accounted for the decrease of direct domestic value-added.
In the case of Poland, the situation is the opposite. Analogical numbers equal:
9.5 p.p. (fall in direct domestic value-added), 11.9 p.p. (fall in indirect domestic value-added) and 0.2 (growth in re-imported domestic value-added) – see Table 1a. In the case of both countries, the changes in re-imported domestic value- added play a marginal role.
Table 1a. Indices of value-added trade, Hungary and Poland, 1995–2011 19951996199719981999200020012002200320042005200620072008200920102011 Domestic value-added share of gross exports (DVAiX/X), % Hungary70.069.764.259.055.448.550.853.852.852.652.150.851.853.955.351.451.5 Poland83.982.781.279.178.276.276.875.973.371.671.869.168.869.073.068.867.7 Domestic value-added share of gross exports of chemicals and chemical products (DVAiX/X), % Hungary65.865.065.062.057.150.558.561.361.860.259.556.657.955.054.854.950.8 Poland82.581.579.571.070.868.470.768.466.366.466.263.065.164.567.864.061.2 Direct domestic value-added share of gross exports of chemicals and chemical products, % Hungary36.934.237.738.833.333.037.438.238.637.033.833.833.231.129.831.127.5 Poland36.936.634.835.835.934.232.431.228.928.629.928.929.829.330.428.327.4 Indirect domestic value-added share of gross exports of chemicals and chemical products, % Hungary28.830.827.323.223.817.421.123.023.123.125.622.724.623.825.023.723.2 Poland45.644.844.635.134.934.138.237.037.337.636.134.035.135.037.235.633.7 Re-imported domestic value-added share of gross exports of chemicals and chemical products, % Hungary0.00.00.00.00.00.00.00.00.00.10.010.10.10.10.10.10.1 Poland0.00.00.10.10.10.10.10.10.10.10.10.10.10.20.10.10.2 Intermediaries share in gross imports of chemicals and chemical products , % Hungary74.273.973.773.573.471.172.769.866.366.767.667.769.171.170.269.973.3 Poland66.765.664.665.565.064.264.162.264.065.466.867.869.068.567.967.770.2 Final goods share in gross exports of chemicals and chemical products, % Hungary29.529.430.131.432.430.631.332.532.030.630.029.330.029.931.231.530.5 Poland29.230.028.533.033.334.533.133.132.932.331.431.731.731.832.530.930.2 Re-exported intermediate imports (as a share of gross exports) of chemicals and chemical products, % Hungary43.236.044.164.660.237.356.448.247.147.839.440.341.645.943.342.940.6 Poland31.937.142.450.141.844.949.862.360.456.558.461.159.057.452.355.463.6 Source: Authors’ own calculation based on OECD – WTO (2017) statistics.
Increasing foreign value-added share in Hungarian and Polish gross exports of chemicals and chemical products has been accompanied by the rising gross imports of intermediaries. In 2011, gross imports of intermediate chemicals and chemical products to Hungary accounted for about 4.3 billion USD (compared with 1.2 billion USD in 1995) and to Poland for about 14.9 billion USD (com- pared with 1.9 billion USD in 1995)2.
In Poland, even more important than the growing absolute values is the in- creasing share of intermediaries in gross imports of chemicals and chemical prod- ucts – see Table 1a. Since 2003, this share has been noticeably growing – from 63% in 2004 to more than 70% in 2011 (in 1995 it was 67.7%, so it was lower than in 2011). In the case of Hungary, the situation is more complicated as the in- termediaries’ share of gross imports of chemicals and chemical products in 2011 (73.3%) was higher than in 2005 (67.6%), but lower than in 1995 (74.2%).
According to the previous considerations, it is worth to check whether the final goods’ share in Hungarian and Polish gross exports of chemicals and chemical products has been increasing. If it is true, it means that the two countries im- port intermediaries, process them and export final goods. Unfortunately, statistics shown in Table 1a do not confirm this phenomenon. Final goods’ share in gross exports of chemicals and chemical products has been fluctuating, so the situation is more complicated. It is possible that the two countries import and export a lot of intermediaries, as the role of re-exported intermediate imports of chemicals and chemical products is relatively important (see the last row in Table 1a). Thus, these two countries are somewhere in the middle of the GPN and GVC in the case of chemical industry.
To sum up, Table 1a contains the set of statistics illustrating the growing role (especially in the case of Poland) of imported intermediaries for gross exports of chemicals and chemical products in the two countries. The increasing role of imported intermediaries has been going together with the diminishing domestic value-added share in their gross exports of chemicals and chemical products. If the mentioned assumption that these two countries are somewhere in the middle of GPN and GVC is true, country B on the Figure 2 will illustrate the possible position of both countries.
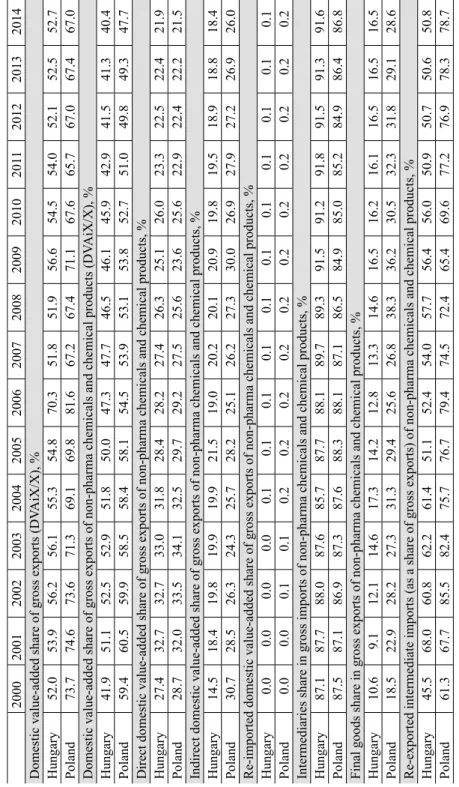
4.3. Results of the second project (WIOD database)
Since 2000, the domestic value-added share of Hungarian gross exports has been quite stable. In 2014, the share of Hungarian value-added in its gross exports ac-
2 According to the OECD & WTO (2017) statistics.
counted for almost 53.4% (in 2000 it was 52%). The share of Polish value-added in its gross exports was 67% in 2014 compared with almost 74% in 1995 (Tables 1b and 1c). Tables 1a, 1b and 1c reveal similar tendencies in domestic value-add- ed share in the gross exports of the two countries over the period of 2000–2011.
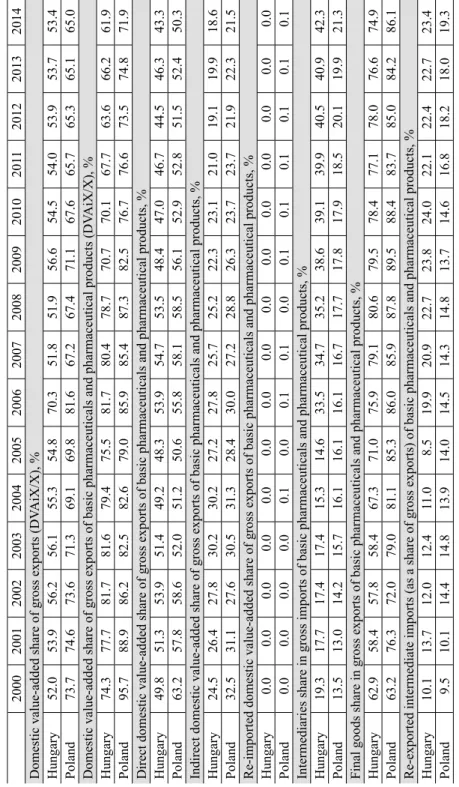
In 2014, the share of Hungarian value-added in its gross exports of non-phar- ma chemicals and chemical products accounted only for about 40.5% (in 2000 it was similar, but in 2003 it was almost 53%). The share of Polish value-added in its gross exports of non-pharma chemicals and chemical products was about 60%
in the years of 2000–2002 compared with 47.5% in 2014 (Table 1b). The tenden- cies in the case of exports of basic pharmaceuticals and pharmaceutical products are similar, but generally the share of domestic value-added is much higher than in the case of exports of non-pharma chemicals and chemical products. In 2014, the domestic value-added share of Hungarian gross exports of basic pharmaceu- ticals and pharmaceutical products was almost 62% compared with ca. 74.5%
Figure 2. Domestic and foreign value-added in gross exports of all chemicals and chemical products
Source: Authors’ own construction based on UNCTAD (2013: 123).
Table 1b. Indices of value-added trade, Hungary and Poland, 2000–2014 200020012002200320042005200620072008200920102011201220132014 Domestic value-added share of gross exports (DVAiX/X), % Hungary52.053.956.256.155.354.870.351.851.956.654.554.052.152.552.7 Poland73.774.673.671.369.169.881.667.267.471.167.665.767.067.467.0 Domestic value-added share of gross exports of non-pharma chemicals and chemical products (DVAiX/X), % Hungary41.951.152.552.951.850.047.347.746.546.145.942.941.541.340.4 Poland59.460.559.958.558.458.154.553.953.153.852.751.049.849.347.7 Direct domestic value-added share of gross exports of non-pharma chemicals and chemical products, % Hungary27.432.732.733.031.828.428.227.426.325.126.023.322.522.421.9 Poland28.732.033.534.132.529.729.227.525.623.625.622.922.422.221.5 Indirect domestic value-added share of gross exports of non-pharma chemicals and chemical products, % Hungary14.518.419.819.919.921.519.020.220.120.919.819.518.918.818.4 Poland30.728.526.324.325.728.225.126.227.330.026.927.927.226.926.0 Re-imported domestic value-added share of gross exports of non-pharma chemicals and chemical products, % Hungary0.00.00.00.00.10.10.10.10.10.10.10.10.10.10.1 Poland0.00.00.10.10.20.20.20.20.20.20.20.20.20.20.2 Intermediaries share in gross imports of non-pharma chemicals and chemical products, % Hungary87.187.788.087.685.787.788.189.789.391.591.291.891.591.391.6 Poland87.587.186.987.387.688.388.187.186.584.985.085.284.986.486.8 Final goods share in gross exports of non-pharma chemicals and chemical products, % Hungary10.69.112.114.617.314.212.813.314.616.516.216.116.516.516.5 Poland18.522.928.227.331.329.425.626.838.336.230.532.331.829.128.6 Re-exported intermediate imports (as a share of gross exports) of non-pharma chemicals and chemical products, % Hungary45.568.060.862.261.451.152.454.057.756.456.050.950.750.650.8 Poland61.367.785.582.475.776.779.474.572.465.469.677.276.978.378.7 Source: Authors’ own calculation based on WIOD (2017) statistics and Timmer et al. (2015).
in 2000. In the case of Poland, the analogical shares were almost 72% and 96%, respectively (Table 1c).
There are also significant disparities in the role of intermediaries in gross im- ports and the role of final goods in gross exports between non-pharma chemicals and pharmaceutical products. Intermediaries’ share in Hungarian gross imports of non-pharma chemicals and chemical products during the period of 2000–2014 was fluctuating around 90% (recently it has been higher than it was at the be- ginning of 21st century). Further, its gross imports of basic pharmaceuticals and pharmaceutical products, the share of intermediaries has been much lower (only about 19.5% in 2000 and about 42.5% in 2014). Additionally, during the period of 2000–2014, the final goods’ share in Hungarian gross exports of non-pharma chemicals was fluctuating around 13% and analogical share in the case of phar- maceuticals was much higher (between 58–81%). The situation in the case of Po- land is quite similar. Intermediaries’ share in Polish gross imports of non-pharma chemicals and chemical products during the period of 2000–2014 was fluctuating around 86%. And its gross imports of basic pharmaceuticals and pharmaceutical products, the share of intermediaries was much lower (only about 13.5% in 2000 and about 21.5% in 2014). Moreover, during the period of 2000–2014, the final goods’ share in Polish gross exports of non-pharma chemicals was fluctuating around 25% and the analogical share in the case of pharmaceuticals was much higher (between 63–90%). Consequently, Figure 2 is adequate for Hungary and Poland in the case of non-pharma chemicals and chemical products, but it is not proper for basic pharmaceuticals and pharmaceutical products.
5. CONCLUSION
Measuring the value-added trade has become a crucial aspect in analysing the international division of labour. Since trade in intermediary products are very intensive, the analysis of gross trade is misleading because of double-counting.
Our study aimed to analyse two countries (Hungary and Poland) and one branch, chemical industry to reveal the tendencies of value-added trade. Our findings reveal that both countries intensively participate in production fragmentation and global value chain, but they rely rather on intermediaries from richer coun- tries than on home-made semi-products with high domestic value-added content.
However, there is one exception which should be noticed, namely the case of the pharmaceutical branch. But even in the case of gross exports of basic pharma- ceuticals and pharmaceutical products, the share of domestic value-added has been recently declining. Increasing domestic value-added is needed to have more competitive export which appears to be a fundamental postulate for industrial
Table 1c. Indices of value-added trade, Hungary and Poland, 2000–2014 200020012002200320042005200620072008200920102011201220132014 Domestic value-added share of gross exports (DVAiX/X), % Hungary52.053.956.256.155.354.870.351.851.956.654.554.053.953.753.4 Poland73.774.673.671.369.169.881.667.267.471.167.665.765.365.165.0 Domestic value-added share of gross exports of basic pharmaceuticals and pharmaceutical products (DVAiX/X), % Hungary74.377.781.781.679.475.581.780.478.770.770.167.763.666.261.9 Poland95.788.986.282.582.679.085.985.487.382.576.776.673.574.871.9 Direct domestic value-added share of gross exports of basic pharmaceuticals and pharmaceutical products, % Hungary49.851.353.951.449.248.353.954.753.548.447.046.744.546.343.3 Poland63.257.858.652.051.250.655.858.158.556.152.952.851.552.450.3 Indirect domestic value-added share of gross exports of basic pharmaceuticals and pharmaceutical products, % Hungary24.526.427.830.230.227.227.825.725.222.323.121.019.119.918.6 Poland32.531.127.630.531.328.430.027.228.826.323.723.721.922.321.5 Re-imported domestic value-added share of gross exports of basic pharmaceuticals and pharmaceutical products, % Hungary0.00.00.00.00.00.00.00.00.00.00.00.00.00.00.0 Poland0.00.00.00.00.10.00.10.10.00.10.10.10.10.10.1 Intermediaries share in gross imports of basic pharmaceuticals and pharmaceutical products, % Hungary19.317.717.417.415.314.633.534.735.238.639.139.940.540.942.3 Poland13.513.014.215.716.116.116.116.717.717.817.918.520.119.921.3 Final goods share in gross exports of basic pharmaceuticals and pharmaceutical products, % Hungary62.958.457.858.467.371.075.979.180.679.578.477.178.076.674.9 Poland63.276.372.079.081.185.386.085.987.889.588.483.785.084.286.1 Re-exported intermediate imports (as a share of gross exports) of basic pharmaceuticals and pharmaceutical products, % Hungary10.113.712.012.411.08.519.920.922.723.824.022.122.422.723.4 Poland9.510.114.414.813.914.014.514.314.813.714.616.818.218.019.3 Source: Authors’ own calculations based on WIOD (2017) statistics and Timmer et al. (2015).
policy of both countries. This policy should be connected with the investments in physical and human capital, and maybe more money from the EU funds should be directed to the industry rather than to the services sector.
The most fundamental limitation of our study is the level of aggregation of statistics. Our research based on OECD-WTO statistics (pure level of disaggrega- tion) and compared with the research based on WIOD statistics (more disaggre- gated statistics but the level of disaggregation is still not very high). This allowed us to show differences between non-pharma chemicals and pharmaceuticals.
However, there may still be some differences within non-pharma chemicals and chemical products, which we are not able to capture due to lack of proper disag- gregated statistics.
REFERENCES
Clark, W. C. – Anastas, P. T. – Zimmerman, J. B. – Matus, K. J. M. (2012): Barriers to the Imple- mentation of Green Chemistry in the United States. Scholarly Articles, No. 9639957, Harvard Kennedy School of Government.
Debref, R. (2012): The Paradoxes of Environmental Innovations: The Case of Green Chemistry.
Journal of Innovation Economics & Management, 9(1): 83–102.
Eurobarometer (2011): Consumer Understanding of Labels and the Safe Use of Chemicals. Report.
Special Eurobarometer, No. 360.
Gholami, P. S. – Nassiri, P. – Yarahmadi, R. – Hamidi, A. – Mirkazemi, R. (2015): Assessment of Health Safety and Environment Management System Function in Contracting Companies of One of the Petro-Chemistry Industries in Iran, a Case Study. Safety Science, 77(8): 42–47.
Grossman, G. – Rossi-Hansberg, E. (2006): The Rise of Offshoring: It’s Not Wine for Cloth Any- more. Proceedings of the Economic Symposium “The New Economic Geography: Effects and Policy Implications”, pp. 59–102. Federal Reserve Bank of Kansas City, August 24–26.
Javorsek, M. – Camacho, I. (2015): Trade in Value-added: Concepts, Estimation and Analysis.
ARTNeT Working Paper Series, No. 150, Bangkok, ESCAP.
Johnson, R. C. – Noguera, G. (2012a): Accounting for Intermediates: Production Sharing and Trade in Value-Added. Journal of International Economics, 86(2): 224–236.
Johnson, R. C. – Noguera, G. (2012b): Fragmentation and Trade in Value-Added over Four De- cades. http://www.colorado.edu/economics/seminars/SeminarArchive/2011-12/johnson.pdf (ac- cessed February 4, 2017)
Kaliński, J. – Landau, Z. (2003): Gospodarka Polski w XX wieku (The Polish Economy in the 20th Century). Warszawa: PWE.
Kannegiesser, M. (2008): Value Chain Management in the Chemical Industry: Global Value Chain Planning of Commodities. Springer Science & Business Media.
Kelly, G. – La Cava, G. (2013): Value-Added Trade and the Australian Economy. Bulletin March Quarter: 29–37, Reserve Bank of Australia.
López, F. J. D. – Montalvo, C. (2015): A Comprehensive Review of the Evolving and Cumula- tive Nature of Eco-Innovation in the Chemical Industry. Journal of Cleaner Production, 102:
30–43.
MAVESZ (2015): Vegyipar Magyarországon. Jubileumi kiadvány a Magyar Vegyipari Szövetség megalakulásának 25. évfordulója alkalmából (Chemical Industry in Hungary. Jubielium Report on the Occasion of the 25th Anniversary of the Establishment of the Hungarian Chemical Asso- ciation). http://mavesz.hu/fi le/MAVESZ_25_kiadvany_v8b_HU_72dpi.pdf (accessed: October 24, 2016)
Nagengast, A. J. – Stehrer, R. (2015): The Great Collapse in Value-Added Trade. ECB Working Paper, No. 1833. European Central Bank.
OECD – WTO (2015): Trade in Value-Added: China. https://www.oecd.org/sti/ind/tiva/CN_2015_
China.pdf (accessed May 1, 2017)
OECD – WTO (2017): TiVA Statistics. https://stats.oecd.org/index.aspx?queryid=75537 (accessed October 10, 2017)
OECD – WTO – World Bank Group (2014): Global Value Chains: Challenges, Opportunities, and Implications for Policy. Report prepared for submission to the G20 Trade Ministers Meeting.
Polish Chamber of Chemical Industry (2003): Chemical Industry in Poland. Annual Report 2003.
Warsaw: Polish Chamber of Chemical Industry.
Polish Chamber of Chemical Industry (2011): Chemical Industry in Poland. Annual Report 2011.
Warsaw: Polish Chamber of Chemical Industry.
Pomfret, R. – Sourdin, P. (2018): Value Chains in Europe and Asia: Which Countries Participate?
International Economics, 153: 34–41.
Power, W. (2012): The Value of Value-added: Measuring Global Engagement with Gross and Val- ue-Added Trade. Offi ce of Economics Working Paper, No. 2012–11A, US International Trade Commission.
Stehrer, R. (2012): Trade in Value-Added and the Value-Added in Trade. WIIW Working Papers, No. 81. Vienna: The Vienna Institute for International Economic Studies.
Timmer, M. P. – Dietzenbacher, E. – Los, B. – Stehrer, R. – de Vries, G. J. (2015):
An Illustrated User Guide to the World Input–Output Database: The Case of Global Automotive Production. Review of International Economics, 23: 575–605.
UNCTAD (2013): World Investment Report 2013. Global Value Chains: Investment and Trade for Development. Geneva – New York.
Visan, S. (2010): Risk and Risk Management in Chemical Industry. Review of International Com- parative Management, 11(3): 526–533.
World Bank (2016): COMTRADE Statistics. http://wits.worldbank.org (accessed December 10, 2016)
WTO (2011): Trade Patterns and Global Value Chains in East Asia: From Trade in Goods to Trade in Tasks. Geneva: World Trade Organization.
WTO (2013): World Trade Report 2013. Geneva: World Trade Organization.
WIOD (2017): World Input-Output Tables. http://www.wiod.org/database/wiots16 (accessed on October 10, 2017).