THE CEECS IN GLOBAL VALUE CHAINS:
THE ROLE OF GERMANY*
Łukasz AMBROZIAK
(Received 29 August 2016; revision received: 18 February 2017;
accepted: 20 March 2017)
This paper aims to present the role of Germany in the global value chains (GVCs) of 10 Central and Eastern European countries (CEECs) in 1995–2011. GVCs, being a result of the fragmentation of production processes, have changed the nature of economic globalisation. The study covers fi ve Central European countries (CECs) (the Czech Republic, Hungary, Poland, Slovakia and Slovenia), the three Baltic States (Estonia, Lithuania and Latvia) as well as Bulgaria and Romania. Germany is chosen because it is the main trading partner of the majority of the CEECs. The illustration of the position of Germany in GVCs of the CEECs is based on trade statistics in value added terms. The research results show that Germany has become an engine of increasing integration of the CECs in the GVCs. The role of Germany as a supplier of inputs to the CECs’ exports (backward linkages) is larger than its role as an exporter of value added originating from the CECs (forward linkages).
Keywords: trade in value added, value added in trade, global value chains (GVCs), Central and Eastern European countries (CEECs)
JEL classifi cation indices: F14, F62
* This article is a result of the research project carried out in the Warsaw School of Economics and financed by the National Science Centre, grant: DEC-2014/13/D/HS4/01426.
Łukasz Ambroziak, Assistant Professor in the Institute of Agriculture and Food Economics – National Research Institute and Assistant Professor in the Institute for Market, Consumption and Business Cycles Research (IBRKK) – National Research Institute, Warsaw, Poland.
E-mail: la28204@doktorant.sgh.waw.pl
1. INTRODUCTION
Since the 1980s, the increasing involvement of countries in the process of produc- tion fragmentation has contributed to a strong internationalisation of production, which means that the final product supplied to the customer is composed of the value added of goods and services from a number of countries. As a result, there has also been a fundamental change in the role of countries in the international di- vision of labour. At present, countries specialise in particular stages of production rather than in the manufacture of specific goods. It leads to increased interrela- tions between individual economies. In addition, the phenomenon of production fragmentation causes changes in international trade, i.e. a greater importance of trade in tasks, building supply chains and the related buoyant growth in trade in semi-finished goods (Baldwin – Robert-Nicoud 2014).
Since the early 1990s, the majority of the Central and Eastern European coun- tries (CEECs) have been actively involved in the processes of production frag- mentation, becoming destinations for foreign capital in the form of foreign direct investment. The phenomenon triggered major changes in the foreign trade of the countries concerned (Havlik 2014; Kawecka-Wyrzykowska et al. 2017). Trade in intermediates gained in importance, the share of domestic value added content of exports declined and trade values were overstated due to the multiple calcula- tions in trade statistics of goods at different production stages. Despite a number of differences between the CEECs, they had shared a common characteristic of having Germany as the main trading partner. During 1995–2011 in five Central European countries (CECs), i.e. the Czech Republic, Hungary, Poland, Slovakia and Slovenia, Germany was the largest recipient of goods and services from those countries, as well as the largest supplier to those markets. Germany played a slightly lesser role in the trade of Bulgaria and Romania. In addition to Russia and Italy in Romania, as well as to Russia and Turkey in Bulgaria, Germany ranked among the most important trading partners of those countries. Germany’s share in trade was the lowest for the Baltic States, i.e. Estonia, Latvia and Lithuania. They still had strong trade linkages with Russia as well as with Poland (Lithuania), Finland (Estonia) and Lithuania (Latvia).
The concept of a value added chain is understood as the full range of econom- ic activities constituting subsequent stages of manufacturing a product (OECD 2013). Those include pre-production (research and development, design), pro- duction and post-production phases (distribution, logistics, marketing and after- sales services, e.g. servicing and repairs). Specific tasks tend to be undertaken by various businesses (branches of a business), located in a number of countries. The concept of global value chains (GVCs) refers to value added chains where par- ticular stages of manufacturing a product are distributed across many countries.
Studies are mostly concerned about the participation of the USA, the euro area countries, Japan and China in GVCs. Fewer investigations addressed the partici- pation of Central and Eastern European countries. Olczyk – Kordalska (2017: 92) discovered that “the degree of participation in GVCs is surprisingly greater among CEE than in other EU countries (i.e. 62.4% for the Czech Republic, 56.6% for Hungary, 50.2% for Lithuania, 49.5% for Germany, 45.9% for France).”Grodzicki (2014) emphasises that even among the CEECs there were distinct differences in involvement in GVCs. “Small countries – the Czech Republic, Hungary and Slo- vakia – are to a much higher extent dependent on global supply and demand than Poland” (Grodzicki 2014: 30). Hagemejer – Ghodsi (2017) analysed the position of the new EU Member States in the GVCs in the period of 1995–2011 and con- cluded “While the world production has become increasingly fragmented and on average more upstream, the NMS economies have moved against this trend to become relatively closer to the final consumer” (Hagemejer – Ghodsi 2017: 14).
Folfas (2016) compared the world and Poland’s gross trade and trade in value add- ed. A review of the literature revealed the lack of a study to comprehensively dis- cuss issues related to the participation of Germany in the GVCs of the CEECs.
Thus, this paper aims to present the role of Germany in the GVCs of 10 CEECs in 1995–2011. The study covers five CECs, the three Baltic States (Estonia, Lithuania and Latvia) as well as Bulgaria and Romania. The illustration of the position of Germany in GVC is based on trade statistics in value added terms covering trade in value added as well as the share of value added in trade.
I put the following research questions in this study:
• Why is the concept of measuring trade in value added terms important?
• To what extent do individual CEECs participate in GVCs and what are the reasons for such differences?
• What are the reasons for a different position of Germany in the GVCs of the CEECs?
• What is the role of FDI in the participation of the CEECs in GVCs?
• Why do geographical patterns of the CEECs’ gross trade and the CEECs’
value added trade with Germany differ?
The starting point of this paper is the presentation of selected aspects relating to trade statistics in value added terms. It is followed by a description of the re- search method. Further, the paper discusses the analysis results, in particular: the participation of the CEECs in GVCs; Germany’s backward and forward linkages in the value chains of the CEECs; the importance of Germany as a trading partner of the CEECs according to statistics in gross and value added terms; bilateral trade balances with Germany in accordance with the two approaches and the de- composition of bilateral exports and imports between the CEECs and Germany.
The paper concludes in the recapitulation of the main findings from the study.
2. MEASURING GLOBAL VALUE CHAINS:
TRADE IN VALUE ADDED AND VALUE ADDED IN TRADE
The literature distinguishes between two main concepts connected with the flow of value added between countries (Stehrer 2012, 2013; Nagengast – Stehrer 2014).
One of them, ‘trade in value added’, allows determining how much of the value added created in a country is absorbed or consumed in another country. Value added may flow to the destination country directly in the form of final product or indirectly in the form of a semi-finished product through other countries. It means that the country concerned exports an intermediate product to a country in which it is used for the manufacture of the final product, subsequently exported to the country of destination where it is consumed or absorbed (Johnson – Noguera 2012). In addition to value added exports, there are also value added imports, which allow specifying the origin of the value added consumed or absorbed in the importing country.
The concept related to value added flows between countries also enables the calculation of trade balance in value added terms. Although with regard to the overall trade of a country the trade balances in gross terms and in value added terms are the same, they differ in bilateral trade. Trade statistics in value added exclude trade in intermediate goods which are exported to other countries after processing or assembly (Koopman et al. 2014). Therefore, this leads to divergent statistics according to the two concepts. In the literature, it is emphasised that trade flows in value added terms reflect the benefits derived by particular coun- tries from trade in respect of income and employment well (Foster-McGregor – Stehrer 2013; Timmer et al. 2013).
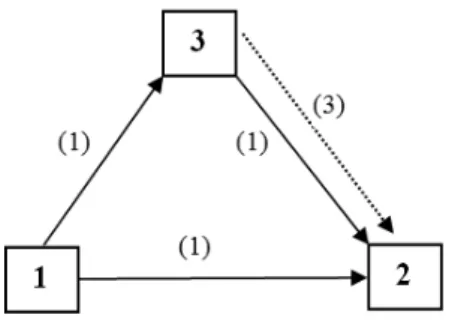
In order to demonstrate the differences between bilateral trade balances in gross terms and in value added terms, Figure 1 presents an example of trade be- tween three countries. The trade balance in gross terms between countries 3 and 2 was USD 4. However, trade between the two countries also comprises value added from country 1, worth USD 1 (an intermediate product embodied in the final product manufactured by country 3). Thus, the trade balance in value added terms between country 3 and country 2 amounted to USD 3 since exports from country 3 to country 2 contained foreign value added worth USD 1.
The other concept connected with value added flows between countries is
‘value added in trade’. It allows identifying the origin of the value added con- tained in the total foreign trade of a country or in bilateral trade – between two countries. It enables the decomposition of exports of one country to another (or of the total exports of a country) by origin of the value added embodied in those ex- ports. Koopman et al. (2010) distinguished between the following components of bilateral exports: 1) domestic value added content of exports in the form of final
goods absorbed or consumed by the direct importer, 2) domestic value added content of exports of intermediates used by the direct importer to produce final goods for the domestic market, 3) domestic value added content of exports of intermediates used by the direct importer to produce goods for export – indirect value added exports, 4) domestic value added content of exports of intermediates used by the direct importer to produce goods returned to the country of origin of intermediate goods (reflected domestic value added), 5) foreign value added content of exports. At the same time, imports from one country to another can be decomposed into the following: a) value added created in the country of the importer contained in both final and intermediate goods (direct value added im- ports), b) re-imports – value added created in the importing country and exported to the country of the importer for its production needs, subsequently brought to the importing country, c) value added content of the imports of a given country created in a country other than the country of the importer (Stehrer et al. 2012).
Statistics on value added in trade also served to determine the participation of the CEECs in GVCs (for more on this subject see Section 3).
To sum up, the concept of value added in trade refers to trade flows in gross terms, enabling to decompose them by origin of value added. The notion of trade in value added is not directly related to trade flows in gross terms. Whereas tra- ditional trade statistics include the value of specific products in circulation in the world economy, trade in value added is somewhat an ‘abstract’ concept. Statistics on trade in value added terms register the flow of value added across countries.
This value is frequently not the same as that of products moved as those comprise components manufactured in various countries.
Figure 1. Diagram of trade between three countries
Note: The gross trade balance between countries 1 and 2 is USD 1, that between country 1 and country 3 – USD 1, whereas that between country 3 and country 2 – USD 4. Trade balance in value added terms will differ from gross trade balance on account of trade in intermediate goods, amounting to USD 2 between countries 1 and 2, USD 0 between countries 1 and 3, USD 3 between countries 3 and 2.
Source: Nagengast – Stehrer (2014).
3. RESEARCH METHOD AND DATA
Based on an input-output approach, the well-known fundamental equation is (Stehrer 2013):
x = Ax + f, (1)
where:
x denotes the CG × 1 vector of gross output (where C denotes the number of countries and G is the number of sectors considered),
A = [ai jr s,, ] i jr s,, 1,...,1,...,GC denotes the CG× CG matrix of technical input-output coeffi- cients (costs) with each element representing the input used in a particular indus- try in one country per unit of gross output,
f denotes the CG × 1 vector of final output.
Transformations result in the equation referred to the Leontief model:
(I – A)x = f, (2) where:
(I – A) denotes the Leontief matrix transforming the vector of gross output x into the vector of final output f,
and subsequently in the following equation:
x = (I – A)–1f = Lf, (3) where:
(I – A)–1 = L denotes the matrix of material-intensity (or additional demand) coef- ficients, also referred to as the Leontief inverse.
For three countries and using partitioned matrices, the equations can be written as follows:
(4)
3.1. Indicator of participation in GVCs
In order to calculate the participation rate of a country in GVCs, the value added trade flow matrix T was used, in the following form (Stehrer 2013):
T = vLt, (5) where:
1 11 12 13 1 1 11 12 13 11 12 13
2 21 22 23 2 2 21 22 23 21 22 23
3 31 32 33 3 3 31 32 33 31 32 33
x A A A x f L L L f f f
x A A A x f L L L f f f
x A A A x f L L L f f f
v denotes the 1 × CG vector of value added coefficients, i.e., value added created per unit of gross output,
t denotes the CG×1 vector of exports of individual countries by sectors.
For three countries and one industry, the matrix of value added flows T formu- lated in equation (6) is as follows1:
(6)
This matrix allows to assess both the origin of the value added contained in the exports of each country (and industry) and the distribution of the value added across countries. In order to determine the composition of exports by country of the origin of value added, we need to look at the columns of the above matrix, whereas the directions of the distribution of value added in exports of destination countries are shown in the rows. Exports are composed of domestic value added and foreign value added.
The first column of matrix T includes elements describing the country of ori- gin of the value added content of country 1’s exports. For example, v1L11e1*de- notes the value added created in country 1, subsequently exported by that country to foreign markets. In turn, v2L21e1*is the value added created in country 2 and contained in the exports of country 1. A similar interpretation concerns v3L31e1*. The value of domestic content in exports of individual countries can be seen on the diagonal of matrix T (v1L11e1*, v2L22e2*, v3L33e3*). The sum of elements of each column is equal to the gross exports of specific countries.
The first row of matrix T (with the exception of v1L11e1*) shows which part of the value added exported by country 1 is re-exported by country 2 (v1L12e2*) and country 3 (v1L13e3*). In the literature it is referred to as indirect value added exports (Koopman et al. 2010). On the global scale, the sum of foreign content in exports of particular countries must be equal to the sum of the value added of particular countries in third countries’ exports (i.e. to the sum of indirect value added exports).
The determination of the position of individual countries in GVCs was based on the GVC participation rate. It establishes the participation of exports of a country in the multi-stage process of creating trade flows by capturing the foreign value added content of exports and the domestic value added content of exports
1 In order to present the matrix T as a square matrix, diagonalisation of vectors v and t was needed.
1 11 1* 1 12 2* 1 13 3*
2 21 1* 2 22 2* 2 23 3*
3 31 1* 3 32 2* 3 33 3*
v L e v L e v L e T v L e v L e v L e v L e v L e v L e
of the destination countries. (Koopman et al. 2010). The GVC participation rate can be expressed as follows:
(7),
where:
FVA – foreign value added in exports of a country,
DVX – indirect domestic value added exports of a country,
DVA – domestic value added exports of a country absorbed by direct partner.
The indicator in question is calculated as the ratio of the sum of the foreign value added (FVA) content of exports of a country and the indirect value added (DVX) exports to the value of gross exports of that country (FVA + DVA + DVA).
The first element of the sum, i.e. the foreign value added embodied in exports, determines the nature of backward linkages of a country in the production chain, whereas the second one, i.e. domestic value added embodied as intermediate in- puts in third countries’ exports, shows forward linkages in the production chain (UNCTAD 2013).
3.2. Value added in bilateral trade
In order to decompose the bilateral trade flows according to the origin of value added, let us begin with equation (5), where t denotes the CG×1 vector of bilat- eral trade between two countries.
Using three countries and one sector approach, the vector of bilateral trade between country 1 and country 2 is as follows: 1221
0 e
t e
. Note that exports of
country 2 to country 1 equal to imports of country 1 from country 22. The square matrix of value added flows between country 1 and country 2 is as follows (Stehrer 2013):
(8)
2 In contrast to traditional trade statistics, trade data on flows of goods and services from the world input-output table are characterised by the lack of differences in mirror statistics (Timmer et al. 2015).
FVA DVX FVA DVX
GVC FVA DVX DVA FVA DVX DVA FVA DVX DVA
1 11 12 1 12 21 2 21 12 2 22 21 3 31 12 3 32 21
0 0 0 v L e v L e T v L e v L e v L e v L e
The first column contains elements describing the country of origin of value added in exports of country 1 to country 2. For example, element v1L11e12denotes the value added created in country 1, subsequently exported to country 2 (the so-called direct exports). Element v2L21e12is the value added generated in country 2, exported by country 2 to country 1 and subsequently embodied in exports of country 1 to country 2 (the so-called re-export). In turn, element v3L31e12denotes the value added created in country 3 and embodied in exports of country 1 to country 2.. The sum of the elements from the first column is equal to gross exports from country 1 to country 2. It is also important to determine the part of the value added created in country 1 and shipped to country 2 through other countries. To this end, the input-output table of value added flows in exports and imports of country 2 is calculated.
The second column of the matrix contains elements describing the country of origin of the value added content of imports of country 1 from country 2. For exam- ple, element –v2L22e21denotes the value added created in country 2, subsequently brought to country 1 (the so-called direct imports). Element – v1L12e21denotes the value added created in country 1, subsequently exported to country 2 as inputs to its export-oriented production and then again brought to country 1 (the so-called re-imports). In turn, element – v3L32e21denotes the value added created in country 3 and embodied in imports of country 1 from country 2. The value added created in country 2 may be also shipped to country 1 through other countries. To this end, the input-output table of value added flows in exports and imports of country 1 is calculated.
3.3. Trade in value added
For the purpose of estimating trade in value added of the countries under analysis, in equation (5) vector t (the trade flow vector) was replaced with the vector of final demand f. Equation (5) is then expressed in equations (9) and (10) as fol- lows:
VAX = vLf (9)
or
VAM = vLf, (10)
where:
VAX denotes the matrix of value added exports, VAM denotes the matrix of value added imports and f denotes the CG×1 vector of final demand.
The value added exports of country 1 to country 2 are computed according to equation (11):
(11).
The first element of the last equation denotes the value added created in coun- try 1 and exported in the form of final goods to country 2. The second element refers to the value added created in country 1 and exported as intermediates to country 2, to be consumed or absorbed after further processing. The third element denotes the value added of country 1 and exported as intermediates to country 3, to be shipped after processing as final goods to country 2.
The calculation of the value added imports of country 1 from country 2 will be based on the equation to estimate the value added exports of country 2 to country 1:
(12).
The first element of the equation (12) is the value added created in country 2 and exported as intermediate goods to country 1, where it is absorbed or con- sumed after further processing. The second element denotes the value added cre- ated in country 2 and shipped as final goods to country 1. The third element is the value added created in country 2, shipped in the form of intermediates to country 3 for its processing, and subsequently sent as the final product to country 1.
Therefore, trade balance between country 1 and country 2 in value added terms can be computed according to the following formula in equation (13):
12 ( 1 11 12 1 12 22 1 13 32) ( 2 21 11 2 22 21 2 23 31) NVAX v L f v L f v L f v L f v L f v L f (13).
Trade statistics in value added terms were calculated on the basis of data from the World Input-Output Database (WIOD Release 2013)3.
3 The database contains a set of international supply and use tables and world input-output tables by industry. The WIOD Release 2013 covers 40 countries, including 27 EU Member States and 13 other major economies such as: the USA, Canada, Brazil, Mexico, China, India, Japan, South Korea, Australia, Taiwan, Turkey, Indonesia and Russia. The database includes data for the period from 1995 to 2011 (17 years), for 35 sectors by 59 products (supply and use tables) and for 35 sectors by 35 sectors (input-output tables) (Timmer et al. 2015).
11 12 13 12
12 1 21 22 23 22 1 11 12 1 12 22 1 13 32
31 32 33 32
( 0 0)
L L L f
VAX v L L L f v L f v L f v L f
L L L f
11 12 13 11
12 21 2 21 22 23 21 2 21 11 2 22 21 2 23 31
31 32 33 31
(0 0)
L L L f
VAM VAX v L L L f v L f v L f v L f
L L L f
4. RESEARCH RESULTS AND DISCUSSION 4.1. CEECs in global value chains
Economies participating in GVCs can both use intermediates for their export production and supply them to satisfy the production and the export needs of third countries (export destinations). In order to assess the involvement of particular countries in the world system of production and trade, the rate of participation in GVCs was used. It allows to evaluate the nature of both backward linkages and forward linkages in the production chain.
The GVC participation rate is very useful in the determination of the degree to which exports of a country are integrated into the world production system.
A high degree of participation in GVCs allows a country to derive additional benefits from trade, but there are also certain risks involved. Additional benefits will primarily arise from making a better use of their comparative advantages by specific countries (OECD 2013). The production process is divided into many stages which can be located in accordance with the distribution of comparative advantages among countries. At the same time, a high degree of integration of exports into the world production system makes them very sensitive to cyclical movements. In periods of economic slowdown/collapse, such countries experi- ence relatively the most abrupt fall in exports, which further aggravates crisis phenomena in the economy (Gereffi – Luo 2015).
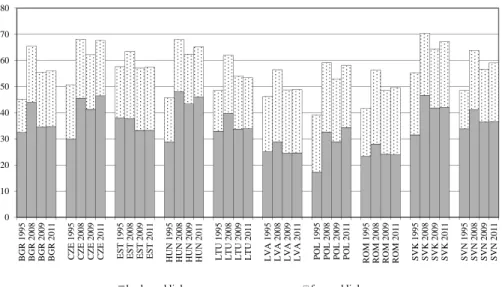
Among the CEECs, in 2011 the highest participation in the global system of production and trade characterised the CECs, in particular the Czech Republic, Hungary and Slovakia. Their GVC participation rates exceeded 65% (Figure 2).
The rates for Poland and Slovenia were lower, at nearly 60%. The lowest GVC participation rates were noted in exports of Romania and Latvia (below 50%). As regards the other three countries, their rates were around 55%. Different partici- pation of the CEECs in GVCs can be explained as follows. The highest partici- pation in GVCs characterised the countries with relatively smaller economies.
According to Vlcková (2015), “Small economies, in general, source more inputs from abroad”. However, a small economy is not necessarily highly integrated into the GVCs. The most important factor seems to be the inflow of foreign direct investment (FDI). Since the 1990s, the CECs (the Czech Republic, Poland, Slo- vakia, Hungary and Slovenia) were the locations for investment projects mainly aimed at improving business efficiency by minimising the production costs – the so-called efficiency-seeking investment (Miškinis – Reinbold 2010; Ambroziak 2012b). It was primarily greenfield investment (rather than brownfield invest- ment aimed at restructuring), mostly made by EU Member States, consisting the building ‘from scratch’ of a production plant in the host country. The factors
shaping FDI inflow to the CECs include a rather good level of transport and communication infrastructure, the availability of relatively cheap (in comparison with the EU-15 countries) and skilled workforce, the proximity to suppliers and outlets, and the intensified economic cooperation with the EU Member States during the 1990s as well as prospects of future EU membership of those countries (Ambroziak 2012a). To a lesser degree, the CECs were also investment destina- tions for Asian and US corporations. However, unlike European enterprises, they were mostly motivated by the desire to evade tariff barriers and maintain previous export markets – the so-called tariff jumping investment (Kaliszuk 2016). For Asian and US firms, the CECs were “a gateway to more developed markets in the EU” (Cieślik et al. 2016).
The main destinations for foreign investment in the CECs were primarily la- bour-intensive manufacturing industries, e.g. the manufacture of transport equip- ment and of certain mechanical and electric machinery and equipment (Soós 2015). The above-mentioned industries are characterised by a low share of do- mestic value added in exports, which translates into the overall share of domestic value added in exports of these countries. Poland was also actively involved in the process of production fragmentation, but due to its larger economy (in com- parison with the other countries in the region), thus a greater internal market and
Figure 2. Participation of the CEECs in global value chains, % of gross exports Source: Own calculations based on WIOD Release 2013 (Timmer et al. 2015).
0 10 20 30 40 50 60 70 80
BGR 1995 BGR 2008 BGR 2009 BGR 2011 CZE 1995 CZE 2008 CZE 2009 CZE 2011 EST 1995 EST 2008 EST 2009 EST 2011 HUN 1995 HUN 2008 HUN 2009 HUN 2011 LTU 1995 LTU 2008 LTU 2009 LTU 2011 LVA 1995 LVA 2008 LVA 2009 LVA 2011 POL 1995 POL 2008 POL 2009 POL 2011 ROM 1995 ROM 2008 ROM 2009 ROM 2011 SVK 1995 SVK 2008 SVK 2009 SVK 2011 SVN 1995 SVN 2008 SVN 2009 SVN 2011
backward linkages forward linkages
lesser importance to foreign trade, its GVC participation rates were lower com- pared to other CECs (Grodzicki 2014).
The comparison of the two components of GVC participation rate suggests that the participation of CEECs in GVCs has varied during 2011. A high domes- tic value added content of exports of third countries/export destinations (DVX) indicates stronger forward linkages in the value added chain. It means that the country concerned is at an early stage of that chain. At the same time, a high foreign value added (FVA) content of exports shows stronger backward linkages in the value added chain. It indicates the position of the country concerned at the final stage of the chain.
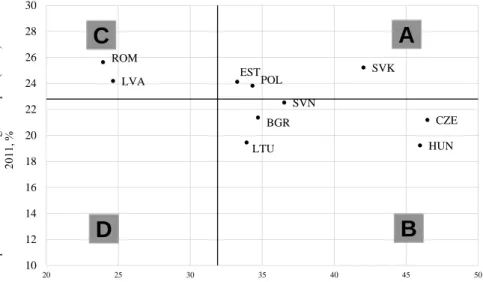
Figure 3 presents the foreign value added content of gross exports of particular CEECs (the horizontal axis) and the domestic value added content of third coun- tries’ exports in gross exports of the CEECs (the vertical axis) in 2011. The axes of the coordinate system intersect at the points representing the average FVA and DVX values for the EU as a whole. It allows to divide the chart area into four fields. Field A includes countries showing strong backward as well as forward linkages in the production chain (FVA and DVX above the average). Among the CEECs those were Slovakia and to a lesser degree, Poland and Estonia. Field B shows countries with a major FVA content of exports (above-average FVA), play- ing a relatively minor role as suppliers of intermediate goods for the production
Figure 3. FVA and DVX rates in the exports of the CEECs, 2011, % of gross exports Source: Own calculations based on WIOD Release 2013 (Timmer et al. 2015).
BGR CZE
EST
LTU HUN
LVA POL
ROM
SVK
SVN
10 12 14 16 18 20 22 24 26 28 30
20 25 30 35 40 45 50
VKDUHRIGRPHFWLFYDOXHDGGHGHPERGLHGLQ H[SRUWVRIWKLUGFRXQWULHVLQJURVVH[SRUW'9;LQ
VKDUHRIIRUHLJQYDOXHDGGHG)9$LQJURVVH[SRUWVLQ
D C
B
A
and exports of third countries (low DVX values). The group comprised Hungary and the Czech Republic, and to a lesser degree, Lithuania and Bulgaria. It allows to suppose that the above-mentioned countries were closer to the end rather than to the beginning of the value chain in 2011. The above-average FVA content of exports also characterised Slovenia, but its downward linkages in the production chain were at the EU average. As regards field C, it contains countries which show strong forward linkages (DVX above the average) and weak backward link- ages (FVA below the average) in the production chain. The group included Ro- mania and Latvia. In field D (weak backward and forward linkages in the value chain) there were no CEECs.
During 1995–2011, some CEECs actively participated in GVCs. Exports of the Czech Republic, Poland and Hungary, and to a lesser degree of Slovakia, showed a marked rise in the foreign value added content (by ca. 16–17 percentage points – pp – in 1995–2011), whereas the importance of those countries as exporters of intermediate goods for the production and exports of third countries (forward linkages) increased to a limited degree. It means that the above-mentioned coun- tries moved towards the end of the global value chain. As regards Slovenia, Bul- garia and Romania, and to a lesser degree Lithuania, the group clearly strength- ened their forward linkages in the value chain, with limited growth in the FVA content of exports. Therefore, these countries moved towards the beginning of the GVC, increasing their foreign sales of intermediate goods for export-oriented production of third countries.
In the literature, it is stressed that countries integrated into GVCs are particu- larly exposed to fluctuations in world demand. It also concerned the majority of the CEECs as the financial and economic crisis during 2008/2009 distinctly weakened their downward linkages and, to a lesser extent, their forward link- ages in the GVCs. During the crisis, the FVA content of the CEECs’ exports dropped more abruptly than the domestic value added content. The reason was that the industries with highly internationalised production processes represent- ing important sectors in the majority of the CEECs, were hit the most by the economic crisis. Such industries produce durable goods (such as cars, house- hold appliances, radio and television equipment) characterised by relatively elastic demand. Consequently, there was a marked decrease in flows of trade in intermediates and final products manufactured in these industries (Stehrer – Stöllinger 2013).
4.2. Backward and forward linkages of the CEECs with Germany
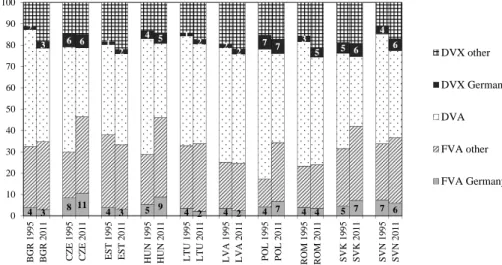
The role of Germany as a supplier of the FVA content of exports of the CEECs (backward linkages) as well as the share of Germany in indirect value added ex- ports of those countries (forward linkages) varied widely. In the Central European countries and Romania, Germany was the largest supplier of intermediates for export-oriented production of those countries (Figure 4). In 2011 German value added accounted for nearly 11% and 9% of Czech and Hungarian exports, re- spectively. In Poland, Slovakia and Slovenia that share was around 7%, whereas it was 4% in Romania. In other CEECs the figure did not exceed 3%. During 1995–2011, there was a rise in the German value added content of gross exports only in the case of the CECs (with the exception of Slovenia).
The differences among the CEECs in their backward linkages (and also for- ward linkages) with Germany can be explained by different trade and investment interdependencies between the economies of the CEECs on the one hand and the German economy on the other hand. The geographical proximity, cultural similarity, relatively low labour costs and skilled workforce encouraged Ger- many to relocate some of its production to the CEECs, especially to the CECs (IMF 2013). Moreover, Miškinis – Reinbold (2010) emphasise the role of state
4 3 8 11 4 3 5 9 4 2 4 2 4 7 4 4 5 7 7 6
2
3 6 6 1
2
4 5 1
2 2
2 7 7 3
5 5 6
4 6
0 10 20 30 40 50 60 70 80 90 100
BGR 1995 BGR 2011 CZE 1995 CZE 2011 EST 1995 EST 2011 HUN 1995 HUN 2011 LTU 1995 LTU 2011 LVA 1995 LVA 2011 POL 1995 POL 2011 ROM 1995 ROM 2011 SVK 1995 SVK 2011 SVN 1995 SVN 2011
DVX other
DVX Germany
DVA
FVA other
FVA Germany
Figure 4. Exports of the CEECs by origin of value added, 1995 and 2011, % of gross exports Notes: DVX other – domestic value added re-exported by a country other than Germany; DVX Germany – domestic value added re-exported by Germany to third countries; DVA – domestic value added consumed or absorbed in export destinations countries; FVA other – foreign value added other than German value added;
FVA Germany – German value added.
Source: Own calculations based on WIOD Release 2013 (Timmer et al. 2015).
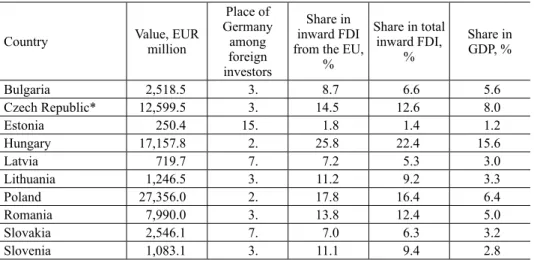
policies towards foreign investors. German investments were targeted mainly at few sectors, namely automotive, electronic/electrical, chemical and machinery industries. As a result, Germany became a major foreign direct investor in most of the CEECs. The majority of German FDI was located in Poland, in Hungary and in the Czech Republic, these countries received as much as 78% of foreign capital inflows of all the CEECs. Although Poland hosted the most German FDI, it played a greater role in the economies of Hungary and the Czech Republic.
German inward FDI accounted for 8% of Czech’s GDP and for as much as 15.6%
of Hungary’s GDP.
The most significant investment by German corporations was attracted by the automotive industry in Central Europe (Túry 2014; Krzywdzinski 2008).
Volkswagen invested in vehicle assembly plants in Poland (passenger cars, vans, lorries and MAN buses), the Czech Republic (Škoda), Slovakia and Hungary (Audi) and also in engine factories in Hungary, the Czech Republic and Poland (Túry 2016). Investment projects in Hungary also included a Mercedes car pro- duction plant of Daimler and an engine factory owned by Opel. In Poland, Opel invested in both a car factory and in an engine production plant.
The forward linkages of the CEECs with Germany in the value added chain were weaker than their backward linkages. With the exception of Estonia, how- ever, Germany was the most important exporter of the value added created in the CEECs. The largest share characterised the CECs, particularly Poland. In 2011 nearly 28% of the Polish value added embodied in other countries’ exports
Table 1. German inward FDI in the CEECs at the end of 2015
Country Value, EUR
million
Place of Germany
among foreign investors
Share in inward FDI from the EU,
%
Share in total inward FDI,
%
Share in GDP, %
Bulgaria 2,518.5 3. 8.7 6.6 5.6
Czech Republic* 12,599.5 3. 14.5 12.6 8.0
Estonia 250.4 15. 1.8 1.4 1.2
Hungary 17,157.8 2. 25.8 22.4 15.6
Latvia 719.7 7. 7.2 5.3 3.0
Lithuania 1,246.5 3. 11.2 9.2 3.3
Poland 27,356.0 2. 17.8 16.4 6.4
Romania 7,990.0 3. 13.8 12.4 5.0
Slovakia 2,546.1 7. 7.0 6.3 3.2
Slovenia 1,083.1 3. 11.1 9.4 2.8
Note: * Data for the Czech Republic refers to 2014.
Source: Own calculation on the basis of WIIW Foreign Direct Investment Database.
was exported by Germany. The value of such exports accounted for over 7%
of Poland’s gross exports. In the case of other CECs, the share was around 6%.
It means that some of these countries’ exports to Germany were hinged on the demand for German products in foreign markets. For instance, a potential fall in Chinese demand for German vehicles would push down German imports of automotive parts and components from Poland.
4.3. Trade in value added of the CEECs: The role of Germany
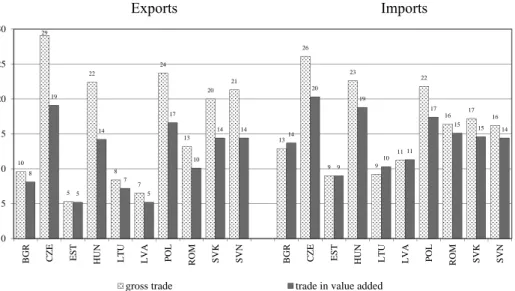
In 2011 the share of Germany in exports of all the CEECs was lower in value add- ed terms compared to gross exports. The most significant differences concerned the CECs. The share of Germany in value added exports of the Czech Republic was 10 percentage points lower than its share in Czech gross exports (Figure 5).
In 2011 slightly more than 19% of Czech value added exported to other countries was absorbed or consumed in Germany. The share of Germany in value added ex- ports of the other four CECs was 6 to 8 pps lower than that of their gross exports.
It was 17% in Poland and 14% in Slovenia, Hungary and Slovakia each.
The differences in the share of Germany in value added exports and gross ex- ports of the CECs can be explained by the strong position of Germany in the glo- bal value chains of these countries. Due to the major importance of intermediate goods in exports of the CECs to Germany, exports to Germany were ‘overstated’
according to traditional statistics. Intermediates were used by German enterprises to produce final goods, often intended for export. Therefore, some of the value added from the CECs exported to Germany was then consumed or absorbed in other countries. The comparison of the geographical composition of the CECs in gross terms and in value added terms implies that the shares of countries such as the United States, China and Japan were higher according to value added statistics than according to traditional statistics4. Hence, Germany was a major exporter of the value added created in the CECs to the above-mentioned non-EU markets.
Among other CEECs, Germany played the greatest role in Romanian exports.
In 2011 around 10% of Romanian value added exports to other countries was ab- sorbed or consumed in Germany. The difference of 3.1 pps between the share of Germany in Romanian gross exports and that in value added exports thus points to the major importance of Germany in the Romanian value added chains. In Bul- garia and in the Baltic States the differences in the share of Germany, computed on the basis of value added and gross statistics, did not exceed 2 pps, whereas the share of Germany did not exceed 10%. The lesser role of Germany in the trade
4 The same findings for Poland were obtained by Folfas (2016).
of the Baltic States primarily stemmed from the greater geographic distance and traditional links between these countries concerned and other countries from the Baltic Sea region, e.g. Sweden and Finland.
The differences in the share of Germany in imports of the CEECs, calculated on the basis of trade statistics in gross and value added terms were lower than differences in their exports. With the exception of Bulgaria and the Baltic States, in 2011 the share of Germany in value added imports was – as in value added ex- ports – lower than in gross imports. The greatest gaps are observed in the Czech Republic (6 pps), Poland (5 pps) and Hungary (4 pps). It indicates that the coun- tries concerned are not only sub-suppliers of parts and components to German enterprises, but they also import German value added in the form of intermedi- ate goods. After appropriate processing or assembly, such intermediates are then exported to other countries. Therefore, some of the German value added, em- bodied in imports of the CECs are not consumed or absorbed in those countries, hence the relatively lesser importance of Germany in their imports in value added terms. In 2011 slightly more than 20% of the value added originated abroad and absorbed or consumed in the Czech Republic had come from Germany. For Hun- gary it was 19%, whereas the figure for Poland was slightly more than 17%. In Slovakia, Romania, Slovenia and Bulgaria around 15% and in the Baltic States only around 10% of the value added originated abroad consumed or absorbed in those countries had come from Germany.
Figure 5. Share of Germany in trade of goods and services in the CEECs, 2011, % Source: Own calculations based on WIOD Release 2013 (Timmer et al. 2015).
10 29
5 22
8 7
24
13 20
21
13 26
9 23
9 11
22
16 17
16
8 19
5 14
7 5
17
10
14 14
14 20
9 19
10 11
17
15 15 14
0 5 10 15 20 25 30
BGR CZE EST HUN LTU LVA POL ROM SVK SVN BGR CZE EST HUN LTU LVA POL ROM SVK SVN
gross trade trade in value added
Exports Imports
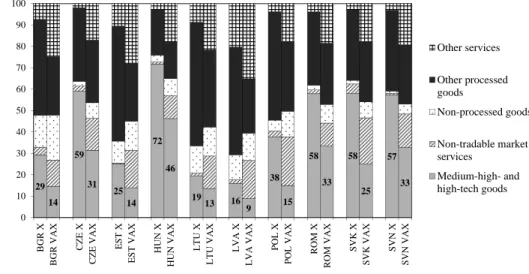
The large differences between geographical patterns of the CECs’ gross trade and the CECs’ value added trade with Germany may be explained by the dis- aggregation of value added trade by industries (Figure 6). In these countries, the dissimilarities resulted from a major share in the gross exports of medium- high- and high-technology products, manufactured in industries characterised by significantly internationalised production (mainly the manufacture of transport equipment, of electrical and optical equipment and of machinery). The propor- tion of the products concerned in the value added exports of the CECs was mark- edly lower. Stehrer – Stöllinger (2013) explain that trade in intermediates is more developed in manufacturing than in services. The specific characteristics of the manufacture of goods allow to divide the process into a number of stages, fre- quently distributed across different countries. It creates flows of foreign trade in semi-finished products between the countries in which specific production stages are located. The most extreme examples are the medium- and medium-high- technology industries. A higher share in the value added exports of the CECs was noted in the case of services, particularly non-tradable services (mostly the sale,
Figure 6. Gross (X) and value added (VAX) exports of the CEECs by sectors, 2011, % Notes: Medium-high- and high-tech goods: chemicals and chemical products, machinery, electrical and optical equipment, transport equipment. Non-tradable market services: sale, maintenance and repair of motor vehicles and motorcycles, wholesale trade and commission trade, retail trade, accommodation and food service activi- ties, real estate activities. Non-processed goods: products of agriculture, mining and quarrying. Other processed goods: other processed goods than medium-high- and high-tech goods. Other services: other services than non- tradable market services.
Source: Own calculations based on WIOD Release 2013 (Timmer et al. 2015).
29 14
59 31 25
14 72
46
1913 16 9
38 15
58 33
58
25 57
33
0 10 20 30 40 50 60 70 80 90 100
BGR X BGR VAX CZE X CZE VAX EST X EST VAX HUN X HUN VAX LTU X LTU VAX LVA X LVA VAX POL X POL VAX ROM X ROM VAX SVK X SVK VAX SVN X SVN VAX
Other services
Other processed goods
Non-processed goods
Non-tradable market services
Medium-high- and high-tech goods
maintenance and repair of motor vehicles as well as wholesale and retail trade) and business services. Services contribute significantly to the process of the man- ufacture of goods, e.g. design, transport, distribution, etc. Trade statistics in gross terms recognise that part of value added as exports of goods which results in the understatement of the actual role of services in international trade.
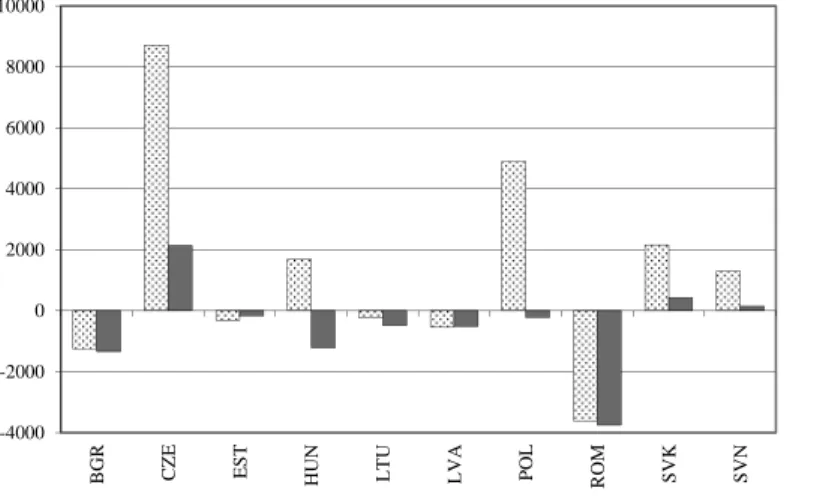
At the level of total trade, the trade balances of a country in value added terms and in gross terms are equal. However, significant differences can be seen in bilateral trade. The phenomenon was also observed, to a varying degree, in the trade of the CEECs with Germany. The greatest differences between the trade balance in gross terms and that in value added terms were observed in the CECs.
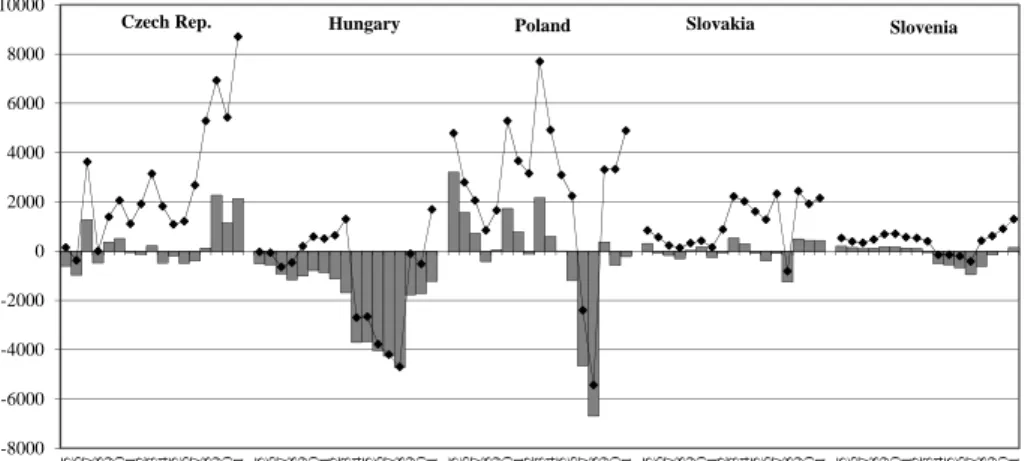
The value of the trade balance computed on the basis of traditional statistics was clearly higher than the trade balance calculated on the basis of value added sta- tistics (Figures 7 to 9). According to traditional trade statistics, in 2011 the Czech Republic recorded a surplus of USD 8.7 billion in trade of goods and services with Germany. In value added terms, the surplus was less than one-fourth of the figure, at USD 2.1 billion. A similar situation concerned Slovakia and Slovenia – the trade surplus in value added terms was markedly smaller than the surplus in gross trade. Poland and Hungary achieved positive trade balances with Ger- many according to traditional statistics, whereas they recorded deficits in value added terms. Foster-McGregor – Stehrer (2013) emphasise that the value added
Figure 7. Trade balance of the CEECs with Germany in gross and value added terms, 2011, USD million
Source: Own calculations based on WIOD Release 2013 (Timmer et al. 2015).
-4000 -2000 0 2000 4000 6000 8000 10000
BGR CZE EST HUN LTU LVA POL ROM SVK SVN
gross trade
trade in value added
Czech Rep. Hungary Poland Slovakia Slovenia
-8000 -6000 -4000 -2000 0 2000 4000 6000 8000 10000
1995 1996 1997 1998 1999 2000 2001 2002 2003 2004 2005 2006 2007 2008 2009 2010 2011 1995 1996 1997 1998 1999 2000 2001 2002 2003 2004 2005 2006 2007 2008 2009 2010 2011 1995 1996 1997 1998 1999 2000 2001 2002 2003 2004 2005 2006 2007 2008 2009 2010 2011 1995 1996 1997 1998 1999 2000 2001 2002 2003 2004 2005 2006 2007 2008 2009 2010 2011 1995 1996 1997 1998 1999 2000 2001 2002 2003 2004 2005 2006 2007 2008 2009 2010 2011
trade in value added gross trade
Bulgaria Romania Estonia Latvia Lithuania
-7000 -6000 -5000 -4000 -3000 -2000 -1000 0 1000
1995 1996 1997 1998 1999 2000 2001 2002 2003 2004 2005 2006 2007 2008 2009 2010 2011 1995 1996 1997 1998 1999 2000 2001 2002 2003 2004 2005 2006 2007 2008 2009 2010 2011 1995 1996 1997 1998 1999 2000 2001 2002 2003 2004 2005 2006 2007 2008 2009 2010 2011 1995 1996 1997 1998 1999 2000 2001 2002 2003 2004 2005 2006 2007 2008 2009 2010 2011 1995 1996 1997 1998 1999 2000 2001 2002 2003 2004 2005 2006 2007 2008 2009 2010 2011
trade in value added gross trade
Figure 8. Trade balance of the CECs with Germany in gross and value added terms, 1995–2011, USD million
Source: Own calculations based on WIOD Release 2013 (Timmer et al. 2015).
Figure 9. Trade balance of the Baltic States, Bulgaria and Romania with Germany in gross and value added terms, 1995–2011, USD million
Source: Own calculations based on WIOD Release 2013 (Timmer et al. 2015).
measures of bilateral trade provide better estimates of which countries benefit from trade in terms of income and employment. Trade balance in value added terms only takes account of the value added of the country concerned consumed or absorbed in Germany and of the German value added consumed or absorbed in that country. At the same time, it excludes trade in intermediate goods which are exported to other countries after processing or assembly.
According to Nagengast – Stehrer (2016), differences between bilateral trade balances in gross and value added terms are mostly determined by two factors:
FVA consumed by the respective trading partner and demand in third countries other than the two trade partners. In 2011, 88% of gross trade surplus of the Czech Republic with Germany resulted from the FVA embodied in Czech exports and consumed in Germany. The FVA content of Czech exports to Germany was USD 7.6 billion higher than the FVA content of Czech imports from Germany.
The decomposition of gross trade balance by value added content revealed that the final demand from third countries (mainly China, the USA, France and Aus- tria) explained as much as 68% of gross surplus in Poland’s trade with Germany (Ambroziak 2017). Considering the structure of trade by industry, the distinct differences in trade balances of the CECs with Germany calculated in accordance with the two approaches were attributable to products of medium-high- and high- technology industries (e.g. the manufacture of transport, electrical and optical equipment).
4.4. Bilateral trade of the CEECs with Germany in value added terms
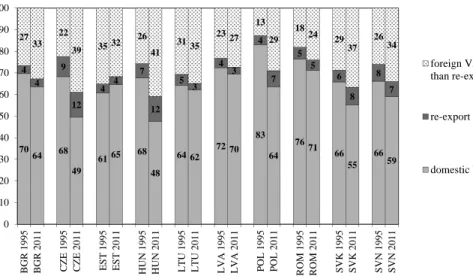
The use of trade statistics in value added terms allows to estimate the sources of value added in gross exports of the CEECs to Germany and the origin of value added in imports of these countries from Germany. During 1995–2011 the domes- tic value added content of exports of the CEECs (with the exception of Estonia ) to Germany (the so-called direct exports) showed a decrease (Figure 10). The most abrupt decline in exports of the CECs were evident particularly in Hungar- ian exports (with a fall in the share by 20 pps in 1995–2011) as well as in Poland and the Czech Republic (a drop by 19 pps). In Slovakia and Slovenia, the impor- tance of direct exports decreased by 11 pps and 7 pps, respectively. In 2011 the most domestic value added was contained in Romanian and Latvian exports to Germany – around 70% of the gross exports. The smallest domestic value added content of exports to the German market were by Hungary and the Czech Repub- lic (slightly below half of gross exports), behind Slovakia and Slovenia (55% and 59%, respectively). In other countries, the share of direct exports ranged between 62% and 65%.
The fall in the domestic value added content of exports of the CEECs to Ger- many was accompanied by the increased importance of FVA. That content repre- sented the German value added supplied in the form of intermediates particularly to CEECs for further processing, to be subsequently exported to Germany (the so-called re-export) and foreign (other than German) value added. In the period covered, there was a rise in the share of re-export in exports to Germany of four CECs, i.e. the Czech Republic, Hungary, Poland and Slovakia. In Slovenia that share dropped slightly, but it was high throughout the period under analysis. In 2011 German value added accounted for as much as 12% of the gross exports of the Czech Republic and Hungary to Germany. In other CECs the share was around 7%–8%. The high proportion of re-export in trade of the CECs with Ger- many corroborates the thesis on the significant involvement of German busi- nesses in the production and exports of those countries.
In 1995–2011 the composition of imports of the CEECs from Germany was similar in all these countries. In the period covered, the share of German value add- ed in imports of these countries (the so-called direct imports) dropped by around 12 to 13 pps. Therefore, there was an increase in the share of FVA (Figure 11). In 2011 direct imports accounted for slightly more than 70% of gross imports of the CEECs from Germany. The importance of re-imports, i.e. value added imports from Germany, which were previously created particularly in CEECs, were mar- ginal. The remaining part of imports of the CEECs from Germany represented FVA other than German value added. The dissimilarities in the composition of the
Figure 10. Bilateral exports of the CEECs to Germany, 1995 and 2011, % Source: Own calculations based on WIOD Release 2013 (Timmer et al. 2015).
7064 68 49
6165 68 48
64 62 72 70 83
64 7671
66 55
66 59 4
4 9
12 4 4
7
12 5 3
4 3
4
7 5
5 6
8 8
7 2733
22
39 35 32 26
41 3135
2327 13
29 1824
29 37
26 34
0 10 20 30 40 50 60 70 80 90 100
BGR 1995 BGR 2011 CZE 1995 CZE 2011 EST 1995 EST 2011 HUN 1995 HUN 2011 LTU 1995 LTU 2011 LVA 1995 LVA 2011 POL 1995 POL 2011 ROM 1995 ROM 2011 SVK 1995 SVK 2011 SVN 1995 SVN 2011
foreign VA (other than re-export)
re-export
domestic VA