Ice-volume-forced erosion of the Chinese Loess Plateau global Quaternary stratotype site
T. Stevens
1, J.-P. Buylaert
2,3, C. Thiel
4, G. Újvári
3,5, S. Yi
6, A.S. Murray
2, M. Frechen
4& H. Lu
6The International Commission on Stratigraphy (ICS) utilises benchmark chronostratigraphies to divide geologic time. The reliability of these records is fundamental to understand past global change. Here we use the most detailed luminescence dating age model yet published to show that the ICS chronology for the Quaternary terrestrial type section at Jingbian, desert marginal Chinese Loess Plateau, is inaccurate. There are large hiatuses and depositional changes expressed across a dynamic gully landform at the site, which demonstrates rapid environmental shifts at the East Asian desert margin. We propose a new independent age model and reconstruct monsoon climate and desert expansion/contraction for the last ~250 ka. Our record demonstrates the dominant in fl uence of ice volume on desert expansion, dust dynamics and sediment preservation, and further shows that East Asian Summer Monsoon (EASM) variation closely matches that of ice volume, but lags insolation by ~5 ka. These observations show that the EASM at the monsoon margin does not respond directly to precessional forcing.
DOI: 10.1038/s41467-018-03329-2
OPEN
1Department of Earth Sciences, Uppsala University, Villavägen 16, 75236 Uppsala, Sweden.2Nordic Laboratory for Luminescence Dating, Department of Geosciences, University of Aarhus, DTU-Risø campus, Frederiksborgvej 399, 4000 Roskilde, Denmark.3Center for Nuclear Technologies, Technical University of Denmark, DTU-Risø campus, Frederiksborgvej 399, 4000 Roskilde, Denmark.4Leibniz Institute for Applied Geophysics, Section S3:
Geochronology and Isotope Hydrology, Stilleweg 2, 30655 Hannover, Germany.5Institute for Geological and Geochemical Research, MTA Research Centre for Astronomy and Earth Sciences, Budaörsi street 45, Budapest H-1112, Hungary.6School of Geography and Ocean Science, Nanjing University, 210023 Nanjing, China. Correspondence and requests for materials should be addressed to J.-P.B. (email:jabu@dtu.dk)
1234567890():,;
T he margins of deserts are highly sensitive to climate change and human influences1. Small changes in vegetation, cli- mate or land use drive major changes in sand dune and dust activity
2, 3, which in turn have major impacts on local populations, global dust emissions and climate forcing
4, 5. By extension, sedimentary records from the margins of deserts are highly sensitive indicators of past environmental change in these crucial areas
6. The desert margin of the Chinese Loess Plateau (CLP; one of the world’s most important terrestrial climate archives) is especially significant in this regard. In addition to recording East Asian Monsoon climate and Asian aeolian dust dynamics in loess and palaeosol units (systems that alter global climate and now affect billions of people), the area also records expansion and contraction of a desert sand sea that has experi- enced significant Holocene and recent desertification
7–9. This is of particular relevance, given that the loess–palaeosol climate proxy record from the CLP desert marginal Jingbian site (Fig. 1) has been adopted as the terrestrial stratotype for the International Commission on Stratigraphy (ICS) global benchmark Quaternary chronostratigraphic scheme
10,11, plotted on the orbitally tuned CHILOPARTS time series
12. The ICS chart for the Quaternary is the reference point for climatic evolution over the past 2.7 Ma, including marine isotope stages, the Antarctic isotope record, and the CLP and Lake Baikal sequences
13; it underpins our funda- mental understanding of past global environmental change and enables correlation of stratigraphic records worldwide. Its accu- racy is therefore of central importance in past climate research.
Nevertheless, our understanding of how processes in desert marginal environments impact the preserved sedimentary record is limited, and the longer-term driving forces behind sand activity remain debated due to the limited preservation potential of dune sediments
9. Sandy desert areas are known to be highly complex and dynamic environments, with the location of deposition and erosion shifting rapidly and across small distances in response to forcing by winds and precipitation
14. Jingbian lies in an area that
has been covered by expanded sand dunes in the past
15. Such processes could therefore severely compromise the completeness of the stratigraphic record and undermine the integrity of cor- relation based, non-independent chronostratigraphic models such as the one used in the ICS scheme. Furthermore, detailed optically stimulated luminescence (OSL) dating of more central CLP sites over the last glacial has shown that age models derived from correlation-based methods contain significant inaccuracies of up to 10 ka
16. More fundamentally, a recent proposal argues that the CLP is a highly dynamic environment which leads to substantial internal aeolian recycling of pre-deposited material and a reduction in CLP area size
17,18. Such sediment recycling would undermine routine desert marginal CLP palaeoenvironmental reconstruction as well as the basis of understanding of past monsoon, dust and desert dynamics in this region. By implication this hypothesis also calls into question the accuracy of the ICS Jingbian chronostratigraphy. It is thus crucial that the past loess and desert record at Jingbian is independently constrained.
Here we develop a fully independent age model for the Jingbian section over the last ~250 ka using a combination of the quartz OSL and K-feldspar post-IR Infra-Red Stimulated Luminescence (IRSL) techniques
19,20applied at high sampling resolution. This model shows that Jingbian is characterised by numerous hiatuses of up to ~60 ka that are highly spatially variable across a heavily eroded gully section (Fig. 2). This radically changes the palaeo- climatic interpretation of the sedimentary sequence preserved at the site, supports a revised model for development of the CLP, provides new insights into East Asian Summer and Winter Monsoon (EASM/EAWM) dynamics, and requires a major revision of the ICS chronostratigraphic scheme for Jingbian.
Results
A luminescence-based chronostratigraphy for the past 250 ka.
Our new luminescence age model is based on 220 ages on
Luochuan Xifeng
Jingyuan Xining
Jingbian
Lantian
Sanbao
EAWM
EASM ISM
Westerlies
100°E 105°E 110°E
100°E 120°E 140°E 160°E
50°N
30°N
10°N
120°E 100°E 80°E 10°N 30°N 50°N
115°E
40°N 40°N
35°N
Loess Desert River 30°N
35°N
30°N 115°E
110°E 105°E
100°E
Fig. 1Map of Chinese Loess Plateau showing surrounding deserts and rivers and location of the ICS stratotype site Jingbian. The Jingbian site location is marked with afilled red triangle and other well-known loess sites (filled red circles) and the Sanbao cave site (filled pink circle) are also indicated. Inset shows location of map in China and main prevailing wind directions of East Asian Winter Monsoon (EAWM), East Asian Summer Monsoon (EASM) and Indian Summer Monsoon (ISM). The data set is provided by Data Center for Resources and Environmental Sciences, Chinese Academy of Sciences (RESDC) (http://www.resdc.cn). The base map is a coloured DEM map derived from SRTM 90 m data84and the inset map is based on http://www.arcgis.
com/home/item.html?id=c3265f30461440c2999add34bcae8e0a. A detailed aerial photograph of the Jingbian site with the studied loess profiles (A,B, C,D,E) marked is given in Supplementary Fig.1
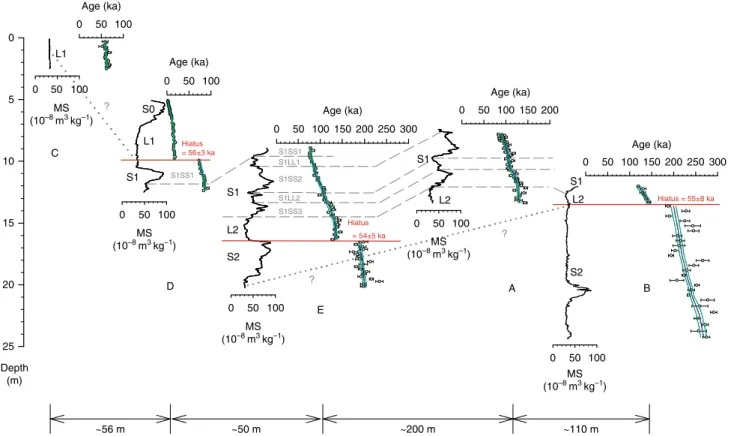
samples taken with a vertical spacing of between 5 and 40 cm at 5 Jingbian sections dug at the ICS stratotype location (Fig. 2). It constitutes the largest and most detailed luminescence data set to date, and to our knowledge is the most comprehensive geo- chronological analysis yet undertaken at a single site. Details on site location, sampling, luminescence dating methodology, age depth modelling and proxy analyses are given in Methods. There are two striking features of the age–depth models for the Jingbian sections (Fig. 2). Large jumps in ages are found in many sections, indicative of large hiatuses in the record of up to 60 ka. Crucially, these substantial gaps are not observable in the visual or proxy stratigraphy and have not been demonstrated previously at Chi- nese loess sites, yet have major implications for the chronos- tratigraphic model and climate reconstruction. In addition, while the age ranges of some of the sections overlap, the nature of the preserved record at each section is inconsistent, indicating a highly spatially variable relationship between age, depth, sedi- ment type and preservation.
As with many CLP-desert marginal sites, Jingbian is located in a relatively flat plateau landscape with the sections exposed in a deeply incised gully system (Figs. 1 and 2, Supplementary Fig. 1).
Some sections show hiatuses where others concurrently show deposition, and yet other sections exhibit extremely high accumula- tion rate phases of short duration (Fig. 2). No single section preserves the full sequence covered at the site, as shown in our composite climate records (Fig. 3). As such, these gully sequences require consideration as dynamic landforms, where gully geomor- phology and local morphological context must be taken into account, together with the stratigraphic sequence. One consequence
of this is that while at many CLP sites the Holocene record has been partly disturbed by human activity
21, a uniquely undisturbed 2 m Holocene sequence is preserved at Jingbian (see Fig. 2, section D), protected by unconformable deposition within the gully system and dated by 31 luminescence ages. Thus, the luminescence results reveal that the gully must pre-date the Holocene and that the gully landform itself is recorded in the stratigraphic record at the site.
While this dynamism adds to the complexity of interpreting these stratigraphic sequences, our independent dating demonstrates that a detailed composite environmental history can be obtained through luminescence dating of multiple overlapping sections (Fig. 3). This is also reflected in the detailed record of the last interglacial in section E (Fig. 2).
Ice-volume-forced processes in a desert marginal environment.
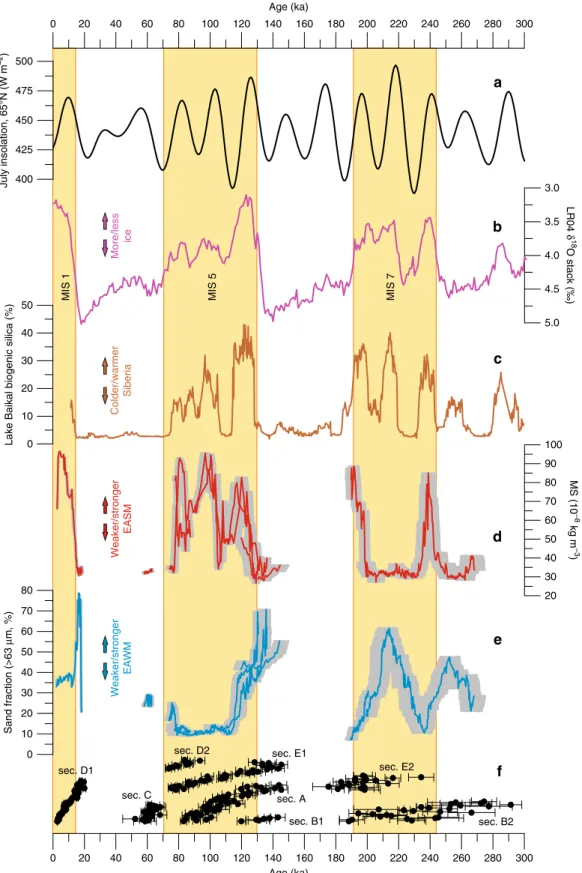
When our climate proxy and stratigraphic records are plotted on our new age model against 65°N July insolation
22, marine oxygen isotope stratigraphy LR04 stack
23and Lake Baikal biogenic silica
13(Fig. 3), some striking patterns become apparent. Notably, there is a near total lack of preserved record during the last two glacial phases (MIS 2–4 and 6), but with preserved material from the glacial stage MIS 8, as well as interglacials MIS 1, 5 and 7. The large hiatuses appear to terminate close to or following the rapid shift away from peak Northern Hemisphere ice volume at the end of the MIS 2–4 and 6 glacial stages (Terminations I and II).
During less positive marine δ
18O isotope stages when Northern Hemisphere ice volume was lower, loess sediments are generally preserved. During MIS 7 and the second half of MIS 8, there is relatively low amplitude variability in ice volume and full
0
Age (ka)
Age (ka)
Age (ka)
Age (ka)
Age (ka) L1
50 100 0
50 100 0 50
MS (10–8 m3 kg–1)
MS (10–8 m3 kg–1)
MS (10–8 m3 kg–1)
50 100 0
MS (10–8 m3 kg–1) S0
S1
S1
S1
S1 L2
?
?
?
L2
S2 S2
D C
E
A B
S1SS1
S1SS1 S1LL1
S1LL2 S1SS2
S1SS3
Hiatus
= 54±5 ka
Hiatus = 55±8 ka
L1
L2 100
0
50 100 0
MS (10–8 m3 kg–1)
50 100 0 50 100
300 250 200 150 100 50 0
300 250 200 150 100 50 0 200 150 100 50 0 0
5
10
15
20
25 Depth
(m)
~56 m ~50 m ~200 m ~110 m
Hiatus
= 56±3 ka
Fig. 2Stratigraphic cross-section at Jingbian showing loess–palaeosol stratigraphy and luminescence age–depth relationship for 5 sections. Loess and palaeosol units are denoted with L and S, respectively. All sections start at the modern surface. Section C has the highest elevation and data from other sections are plotted relative to section C. Dashed lines indicate correlations between sections based on low-field magnetic susceptibility and luminescence ages. Discontinuities are shown as horizontal red lines with the length of hiatus quoted. Where the correlation is solely based on luminescence ages and is less certain because of a discontinuity, a dotted line with question mark is used. Ages are plotted with 1 s.d. errors and Bayesian age–depth models are shown as solid blue (weighted mean age) and green (1 s.d. uncertainty envelope) lines. Detailed luminescence age–depth profiles for the individual sections are given in Supplementary Fig.2a–e
0 20 40 60 80 100 120 140 160 180 200 220 240 260 280 300 400
425 450 475 500
July insolation, 65°N (W m–2)
5.0 4.5 4.0 3.5 3.0 LR04 δ18O stack (‰)
Age (ka) 0
10 20 30 40 50
Lake Baikal biogenic silica (%)
20 30 40 50 60 70 80 90 100
0 10 20 30 40 50 60 70 80
MS (10–8 kg m–3)
Sand fraction (>63 μm, %)
0 20 40 60 80 100 120 140 160 180 200 220 240 260 280 300 Age (ka)
a
b
c
d
MIS 1 MIS 5 MIS 7
More/less iceColder/warmer SiberiaWeaker/stronger EASMWeaker/stronger EAWM
e
f
sec. A
sec. B1 sec. B2
sec. C sec. D1
sec. D2 sec. E1
sec. E2
Fig. 3Comparison of global/Northern Hemisphere proxy records with the Jingbian records on independent timescales for the last 300 ka.a65°N July insolation22record,bbenthic LR04δ18O stack23,cLake Baikal biogenic silica13record anddlow-field magnetic susceptibility (MS) andesand content (>63µm) of the Jingbian loess–paleosol record. Individual luminescence age determinations for each section are shown infwith 1 s.d. age uncertainties.
Grey shading behind the MS/sand fraction curves indicates 1 s.d. age model uncertainties. Marine oxygen isotope stages/boundaries shown are from Lisiecki and Raymo23
preservation of the loess record, including in the comparatively low ice volume glaciation of MIS 8. Two palaeosols associated with the two ice volume minima of MIS 7 are also preserved, separated by a loess unit representing the deep stadial during MIS 7, while MIS 5 and 1, which have no such deep stadials, are only represented as palaeosols at Jingbian.
Based on this pattern and its relationship to the δ
18O record, we propose an explanation of the mechanisms behind desert marginal sediment accumulation, preservation and erosion, and hence the controls on desert dynamics. The greatly enhanced maximal extent of Northern Hemisphere ice limits during peak MIS 2 and 6 is known to have strengthened the Siberian High and moved the polar front southwards, enhancing cold air outbreaks, and strengthening winds and aridity
24. The associated water stress would have reduced vegetation stabilisation of dunes while cold air outbreaks would have driven seasonally strong winds, promoting deflation and sediment movement; these erosive processes changed Jingbian from a depocentre into a dust source and account for the hiatuses at the site. On shorter timescales, the polar front, modulated by Atlantic Meridional Overturning, has been shown to drive strengthened EAWM circulation and dust deposition on the Loess Plateau
25, while the strength of the Siberian High is tied to ice volume and snow cover over multiple timescales
24,26, supporting this model. While the MIS 2–4 and 6 hiatuses cover most of these glacials (Fig. 3), accumulation may still have occurred locally, but the strong erosional events during peak glaciation would have removed previously deposited material. Sand was deposited at the end of both hiatuses, indicating both an expansion of the Mu Us desert and some dune stability. As no sand was preserved during the prior glacial episodes, a highly mobile sand sea is implied, close by or covering the site and providing a plentiful supply of saltating impactor grains to promote deflation of existing deposited material. Thus, the two major hiatuses at Jingbian during MIS 2–4 and 6 are interpreted as erosional unconformities resulting from enhanced dune mobility driving erosion of underlying strata. During glacial MIS 8 and the stadials within MIS 7 and 5, glaciation did not extend as far as during MIS 2 and 6 (Fig. 3) and so cold air outbreaks, winter monsoon intensity and aridity was not sufficient to drive such dune expansion and dust deflation.
Our revised age model and resulting sedimentary history has a fundamental impact on the interpretation of the global benchmark record at Jingbian. In traditional Loess Plateau chronostratigraphic models, loess/sand units and palaeosols are considered of glacial and interglacial age, respectively. Here we propose a different model for Jingbian. In our view, palaeosol units are indeed indicative of interglacial phases of enhanced EASM (high magnetic susceptibility;
MS) and weaker EAWM (finer grain size). However, rather than representative of glacial phases, loess units in the upper part of Jingbian appear to be mainly associated with stadials within interglacials, during which relatively increased ice volume drives cold air outbreaks, aridity and enhanced EAWM circulation, with associated silt transport and dust trapping at Jingbian. Deep glacial phases are removed from the record due to erosion, and sand units occur over more restricted time intervals, both within interglacials and glacials, with both indicating enhanced dune activity and expansion of the Mu Us (Fig. 3). Although the proxy records show general antiphase behaviour of the EASM with the EAWM (Fig. 3), sand accumulation can also occur even during enhanced summer monsoon conditions (e.g., MIS 5e). This suggests that sediment availability, EAWM/Siberian High driven winter aridity, and cold air outbreaks and enhanced wind strength drive dune mobility, desert expansion and sand deposition at desert marginal sites
15. This is in contrast to the idea that dune expansion and deposition is controlled by summer monsoon-driven moisture availability
10. Recent identification of relict dune sediment from the LGM
preserved in isolated frost wedges in the Mu Us
9confirms intense aeolian activity at this time, but also argues for the domination of net erosion due to high winds and aridity. This explains the lack of dune record from the last glacial in the Mu Us
8and supports our deep glacial erosional unconformity model. Thus, desert sand dune activity in this part of China is controlled by the intensity of EAWM circulation in Asia, in turn driven by ice volume in the Northern Hemisphere through the Siberian High. Our findings suggest that during peak ice volume phases, this climatically driven erosion in the Mu Us also extended onto the edge of the CLP, driving development of multiple unconformities in one of the global benchmark Quaternary sediment records. This clearly limits the use of Jingbian as a benchmark site for the Quaternary stratigraphic column, and we suggest that a more central CLP site may be more appropriate for use in the Quaternary chronostratigraphic subdivi- sion. Currently, our results demonstrate that the present ICS scheme for Jingbian is incorrect and should be revised.
In addition, our new chronostratigraphic model has a number of significant implications for understanding the CLP, desert sand and atmospheric dust dynamics, as well as monsoon climate. Jingbian lies just south of an escarpment marking the boundary between the Ordos Platform (including the Mu Us desert) and the northern margin of the CLP. Based on the presence of yardangs and wind- gaps cut into Quaternary strata north of this boundary, as well as on loess provenance data, it has recently been proposed that the escarpment has retreated south and east due to wind erosion during peak glacials in a process of ‘aeolian cannibalism’ of pre-deposited loess material
17,18. Our finding that large amounts of sand and dust are eroded during peak glacial conditions at Jingbian supports the reinterpretation of the CLP as a dynamic landform, with deposits undergoing reworking and recycling along the boundary with the Mu Us desert. This is the first direct, independent evidence to support ‘aeolian cannibalism’ of pre-existing loess
17, 18alongside reworked Yellow River alluvial sediments
27as the source of Quaternary loess to the central CLP and may indicate that indeed the CLP is being reduced in size due to peak glacial wind erosion.
That this reworking at Jingbian occurs during those glacial phases (the most recent) with greatest ice volume is also consistent with a long-term increase in aeolian dust CLP accumulation rates over the Quaternary
28. As glacial stage ice volumes increase and cold air surges penetrate further south, generating large, erosive NW to SE tracking dust storms
29,30over the Mu Us, Yellow River alluvial platform and northern CLP, material is reworked and incorporated into younger CLP deposits further south. As such, this apparent long-term accumulation rate increase may be more tied to increasing ice volume and loess recycling rather than to changing aridity or dust source alone. Kang et al.
31and Stevens et al.
32noted that independently dated central CLP sites show enhanced dust accumulation during the peak of the last glacial (23–19 ka). This general peak in last glacial dust activity coincides with the hiatuses at Jingbian (Fig. 3), and with erosive activity in the Mu Us
9. We propose that enhanced ice volume may then also be the driver of enhanced Asian dustiness during short phases of the late Quaternary, and erosion of desert marginal loess will likely directly contribute to increased atmospheric dust loading downwind on the central CLP.
EASM, ice volume and lagged response to insolation forcing.
EASM-driven MS peaks preserved at Jingbian show a remarkable
match with reductions in ice volume (Fig. 3). MS also shows
variability at the same frequency as precessional cycles in the
Northern Hemisphere summer insolation record, but system-
atically lags behind July insolation at 65°N (Fig. 4). Multiple
independent records and models support a role for precessional
forcing in driving Asian summer monsoon intensity
33–36and
monsoon variation generally is regarded as a function of low latitude solar insolation
37. However, over geologic timescales the degree to which there is a direct, singular forcing response of the monsoon to precession, or one where multiple factors such as CO
2and sea level modulate a lagged EASM response, is unclear. Some
authors advocate a direct response with no lag, based often on speleothem δ
18O records
33,34, while others argue for a c. 8 ka lag compared to absolute annual maximum insolation, based mainly on marine records
35,38. As previous studies only focus on the last glacial termination
39,40, our results permit the first independently
3.8 ka
Age (ka)
July insolation, 65°N (W m–2) MS (10–8 kg m–3)
225 230 235 240 245 250 255
380 390 400 410 420 430 440 450 460 470 480
20 30 40 50 60 70 80 90
a
100Section B
185 190 195 200 205 210
390 400 410 420 430 440 450 460 470 480
30 40 50 60 70 80 90 100
Section E
b
Age (ka)
July insolation, 65°N (W m–2) MS (10–8 kg m–3)
3.3 ka
110 115 120 125 130 135 140
390 400 410 420 430 440 450 460 470 480 490
20 30 40 50 60 70 80 90 100
Age (ka)
July insolation, 65°N (W m–2) MS (10–8 kg m–3)
c
4.8 ka
Section E Section A
6.0 ka
85 90 95 100 105 110 115
390 400 410 420 430 440 450 460 470 480
30 40 50 60 70 80 90
d
100 Section ESection A
5.2 ka
6.1 ka
Age (ka)
July insolation, 65°N (W m–2) MS (10–8 kg m–3)
Age (ka)
July insolation, 65°N (W m–2) MS (10–8 kg m–3)
e
65 70 75 80 85 90 95
400 410 420 430 440 450 460 470
30 40 50 60 70 80 90 100
3.9 ka 8.9 ka
Section E
Section D
0 5 10 15 20 25
410 420 430 440 450 460 470
30 40 50 60 70 80 90 100
Age (ka)
July insolation, 65°N (W m–2) MS (10–8 kg m–3)
f
Section D
1.8 ka –6
–7 –8 –9 –10 –11 δ18O (‰, V-PDB) SB 61
–6 –7 –8 –9 –10 –11
SB 11
–5 –6 –7 –8 –9 –10 –11
SB 11 SB 23
δ18O (‰, V-PDB)
–7 –8 –9 –10 –11 –12 δO (‰, V-PDB)δO (‰, V-PDB)1818 SB 23
SB 22
–6 –7 –8 –9 –10 –11 δ18O (‰, V-PDB)
SB 22
–6 –7 –8 –9 –10 –11 δO (‰, V-PDB)18
SB 3 SB 10
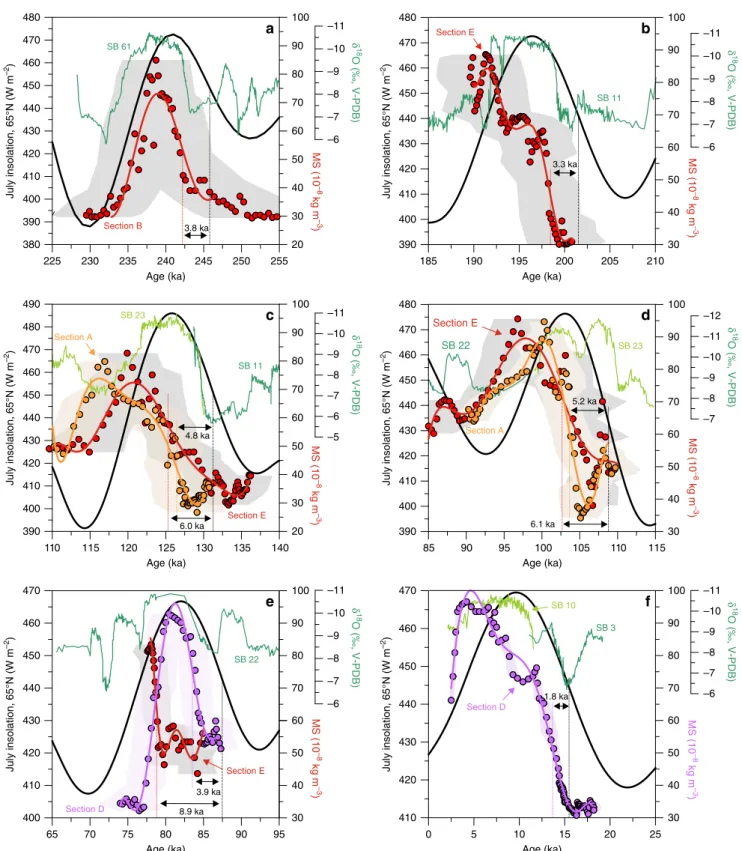
Fig. 4Comparison of insolation with East Asian Summer monsoon proxy time series back to ~250 ka. Records shown include 65°N July insolation22(black curve), the U-Th-dated Sanbao (SB) caveδ18O records34,85(green lines) and the OSL/pIRIR-dated loess/soil magnetic susceptibility (MS) records at Jingbian (red/orange/mauve symbols and lines) foraMIS 8/7,bMIS 7/6,cMIS 6/5,dMIS 5/4,eMIS 5 andfMIS 2/1 transitions. The red/orange/
mauve curves representfitted polynomials to the MS data sets. Lag calculations for the MS records are given against 65°N July insolation and lag values are specified for the inflection points. Shaded area behind the MS data indicates 1 s.d. age model uncertainties
dated analysis of multiple precessional cycle phase lags between EASM proxies and insolation forcing in the loess record, and provide an independent test of these conflicting hypotheses.
A clear, consistent phase lag between 21st July 65°N isolation and the Jingbian EASM is seen across all transitions in our dataset (Fig. 4, Supplementary Table 2). The insolation lag calculation and the effect of different life-time averaged water content assumptions on this lag are outlined in Methods. While the size varies due to age model uncertainty, the average lag is 4.9 ka (s.e.m. = 0.7 ka, n = 9), which would increase to ~7 ka if the target reference curve for phase measurement is taken as the absolute maximum insolation curve, as suggested by Clemens et al
35. This is within uncertainties of the lag proposed from marine records such as the Arabian Sea summer monsoon stack
41, and contrasts sharply with results from speleothem δ
18O
34. We argue that the observed lag is not related to delays in MS signal acquisition; both theoretical models and empirical evidence point to rapid oxidation/reduction response of iron oxides and formation of superparamagnetic minerals that enhance MS
42–45. Although transmission of the forcing signal through the climate system may account for some of the lag, we also note that there is remarkable similarity between our independently dated MS record and global ice volume as represented in the LR04 stack
23(Fig. 3). The only exception is during MIS 7 where a peak in ice volume has no MS/EASM equivalent peak in our Jingbian record (Fig. 3). However this may be an artefact of preservation; the missing peak occurs at the point of increased sand content bracketed by a deeper glacial phase (Fig. 3). Given the larger absolute age uncertainty at this time point and the more scattered ages in the section this data set comes from (B, Fig. 2), it is quite possible an undetected erosional event has removed this peak.
While low latitude insolation directly drives monsoon variability at the precessional band
37, the lagged MS record shows there cannot be a direct response at Jingbian; there must be other factors that heavily modulate the monsoon response in the region. This seems plausible given that the summer monsoon only penetrates as far north as Jingbian due to factors such as land–sea configuration
37. As such, changes in this configuration due to ice volume would be expected to alter summer monsoon patterns at the site. The match between the MS record and the LR04 stack implies a response of the monsoon at Jingbian to insolation forcing that is similar to the response of the Northern Hemisphere ice sheets, potentially controlled by combined eccentricity, obliquity and precession, or alternatively that Northern Hemisphere ice volume dominates the forcing of the EASM
28,36. We suggest that variation in the EASM at Jingbian over the last 250 ka can be explained by combined insolation, ice volume, and CO
2forcing, supported by results from δ
13C of loess organic matter, recent climate model simulations and many marine records
35,38,40. Coupled, ocean–atmosphere–sea ice-land surface climate modelling of the last glacial monsoon suggests that atmospheric CO
2driven high latitude temperature changes drive latitudinal shifts in zonal circulation and the Intertropical Convergence Zone (ITCZ), in turn affecting monsoon precipita- tion
40. These shifts would also have affected meridional temperature gradients, snow and ice cover on high ground, ice sheet dynamics, and hence global sea level (land–sea configura- tion), which in turn will also directly modulate summer monsoon circulation
37,46–49. Additional temperature forcing is driven by insolation at high latitude
40. In monsoon marginal areas like Jingbian, such factors are likely to be the dominant control on summer monsoon dynamics, even if direct precessional forcing dominates monsoon intensity in core monsoon areas
37. Varia- tions in sea-level and CO
2forcing will alter the spatial extent and coverage of the summer monsoon, which will cause significant changes to precipitation levels at monsoon marginal sites, consistent with our record at Jingbian. As such, the previously
widely accepted hypothesis of dominant direct low-latitude precessional forcing of EASM precipitation patterns seems increasingly implausible at the monsoon margin. Variation in monsoon proxies in various archives is consistent with this geographic effect with regard to monsoon forcing
38, with high latitude forcing exerting a dominant control on monsoon precipitation patterns in monsoon marginal areas. Our data apparently conflict with some speleothem δ
18O records of summer monsoon rainfall
34. However, reinterpretations of speleothem δ
18O data suggest that either this proxy is not solely influenced by summer monsoon intensity
50or that δ
18O is a function of integrated rainfall amounts between monsoon source and the cave site
51. If the latter is true it would imply this integrated rainfall was a function of low latitude precessional forcing. However, this is still consistent with our model as we would expect that integrated summer monsoon rainfall prior to precipitation at cave sites close to the southern part of the CLP would be dominated by low latitude precessional forcing, as this rainfall occurs dominantly in the core monsoon region. However, the extent of summer monsoon rainfall closer to the monsoon margins like on the north CLP, would still be dominantly controlled by the spatial extent and coverage of the summer monsoon, itself modulated by ice volume–sea level–CO
2forcing.
Methods
Study site. The study site is located in Jingbian County and comprisesfive sections (A, B, C, D, E; where >1 m of material was removed to freshly expose the sediment) (see Supplementary Fig.1where locations of individual sections are also given).
The elevations of the individual sections were measured to within a few cm using differential GPS and our coordinates measured at section A were 37°29'52.8"N, 108°54'14.4"E. It should be noted that these are different to the coordinates given for the Jingbian site by Ding et al.10. However, as we outline below, there appears to be an error in the site coordinates quoted in Ding et al.10and we here demonstrate that in fact we are working on the same site; the ICS stratotype section. Firstly, coordinates for the stratotype site position subsequently given to us by E. Derby- shire are 37°29'58.74"N and 108°54'2.72"E (E. Derbyshire, personal communication 2015), with an elevation of ~1700 m above sea level (a.s.l.). Note that these coor- dinates refer to the position of a pylon/mast immediately to the west of the gully and are different to the coordinates given for the site by Ding et al.10in which Derbyshire is a co-author. The coordinates provided by Derbyshire are also ~330 m from our differential GPS measured location of section A (see above), consistent with the position of the section on the east side of the gully ~300 m from the pylon (Supplementary Fig.1). Furthermore, Ding et al.52first presented the Jingbian section, which was subsequently analysed in Ding et al.10. Here they noted that the section was located near the settlement of Guojialiang. Indeed, the nearest settle- ment to both our sampling site and the revised coordinates provided by Derbyshire is Guojialiang. However, the coordinates given in Ding et al.10provide a location
~40 km from Guojialiang, inside the Mu Us desert sandfield, with this location also inconsistent with the site descriptions given in Ding et al.10,52and lacking any obvious gully exposure. Finally, during ourfieldwork in, a local farmer confirmed that a group of Chinese scientists had worked previously at our sections D and E, and we could distinguish prior sampling (presumably for grain size and/or MS) at many sections within the gully. We therefore conclude that the site coordinates given in Ding et al.10are erroneous. Given the revised coordinates from Derbyshire and the match of our sections with the site descriptions and nearby settlements in Ding et al.10,52, we are very confident that we were working at the same site as is described in Ding et al.10and therefore the ICS stratotype site.
Luminescence dating. Samples for luminescence dating were collected by ham- mering stainless steel tubes (diameter 2.5 or 5 cm; length up to 25 cm) with a vertical spacing of 5–40 cm into freshly cleaned sediment profiles. The tubes were opened under subdued orange light at the Nordic Laboratory for Luminescence Dating (Aarhus University, DTU Risø campus, Denmark). The outer ~5 cm of each tube end was removed and reserved for dose rate analysis (see below). The inner material was wet-sieved to extract the 63–90 and 90–180 µm grain size fractions.
These fractions were treated with HCl and H2O2to remove carbonates and organic material, respectively. The fractions were etched for 20 min in 10% HF to remove coatings and the outer alpha irradiated layer. After washing in 10% HCl, the fractions were dried and quartz and K-feldspar rich extracts (K content=12.70 ± 0.10%,n=5) were separated using a heavy liquid solution (LST‘Fastfloat’) with density 2.58 g cm−3. For the samples from the D section, the quartz-rich fraction was subjected to concentrated HF treatment for 60 min to remove any remaining feldspar. The purity of the quartz OSL signal was confirmed by the absence of a significant IRSL signal using the OSL IR depletion ratio53. Both quartz and K-
feldspar rich fractions were mounted as multi-grain aliquots containing hundreds of grains on stainless steel cups.
All luminescence measurements were carried out using Risø TL/OSL DA-20 luminescence readers equipped with calibrated90Sr/90Y beta sources delivering between ~0.10 and ~0.20 Gy s−1to multi-grain aliquots in stainless steel cups. Quartz grains were stimulated using blue LEDs (470 nm; ~80 mW cm2) and the OSL signal was detected through 7.5 mm of U-340 glassfilter. Feldspar grains were stimulated using IR LEDs (870 nm; ~140 mW cm−2) with the IRSL signal detected through a blue filter pack (combination of 2 mm BG-39 and 4 mm CN-7-59 glassfilters). Single aliquot regenerative-dose (SAR) protocols54were used to determine the quartz OSL and K-feldspar post-IR IRSL equivalent doses (Supplementary Table1).
For the quartz measurements, a preheat of 260 °C (duration: 10 s) and cut-heat to 220 °C was used; each SAR cycle ended with a high temperature (280 °C) blue light stimulation for 40 s. Natural, regenerative and test dose signals were measured at 125 °C for 40 s. The initial 0.00–0.32 s of the signal minus an early background (0.32–0.64 s) was used for dose calculation. Feldspar aliquots were preheated at 320 °C for 60 s for natural, regenerative and test dose signals. They were then stimulated twice with infra-red light for 200 s. Thefirst IR stimulation temperature was 200 °C (IR signal) and the subsequent IR stimulation temperature was 290 °C (post-IR IRSL signal, pIRIR200,290). The IR clean-out at the end of each SAR cycle was carried out at 325 °C for 200 s. Thefirst 2 s of the post-IR IRSL signal minus a background estimated from the last 50 s was used for dose calculation.
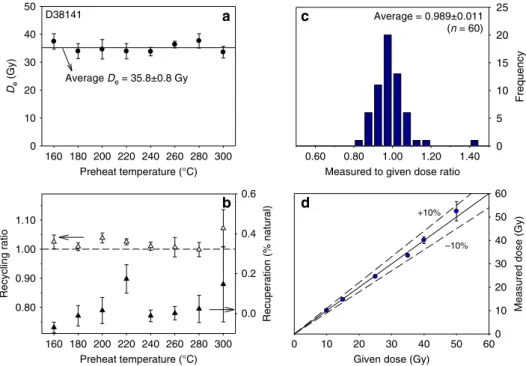
It is well-known that quartz OSL from Chinese loess is dominated by the fast component and generally behaves well in a SAR protocol32,55–57. However, typically age underestimation is observed when doses >~150 Gy are measured in loess using quartz SAR OSL56,58,59. Therefore, we restricted the use of the quartz OSL signal to samples from the upper 480 cm in section D. Below this limit the quartz SAR OSLDevalues are≥160 Gy and these results were not used for age depth modelling. Figure5a, b shows the results of a preheat plateau test on sample D38141. It can be seen that over a wide temperature interval quartzDeis independent of preheat temperature, recycling ratio is close to unity and recuperation is low. A dose recovery test60using the SAR protocol outlined in Supplementary Table1a was carried out on 10 samples from section D (D38102,
−04,−10,−13,−18,−24,−40,−54; 6 aliquots per sample) with given doses ranging between 10 and 50 Gy. Prior to giving the laboratory dose, the natural quartz OSL signal was reset by two blue light stimulations (100 s each) separated by a 10,000 s pause to allow any photo-transferred charge in the 110 °C TL trap to decay. The results of the dose recovery test are shown as a histogram and a measured to given dose plot in Fig.5c, d, respectively. It can be seen from these results that our SAR protocol (preheat 260 °C/10 s, cut-heat 220 °C) is able to measure a quartz dose given prior to any heat treatment with an acceptable degree of accuracy.
Figure6a, b illustrates the relationship between the individual aliquotDevalues (normalised to the sample meanDe) and the recycling ratio and the OSL IR depletion ratio for 54 samples from section D. There does not appear to be any trend in these relationships indicating that theDevalue cannot be improved by
rejecting aliquots with relatively poor recycling ratios (e.g., deviating >10% from unity) and that the quartzDevalues are insensitive to the levels of feldspar contamination present in these extracts. The quartzDevalues for section D are tabulated in Supplementary Data1.
Since the discovery of more stable post-IR IRSL signals61compared to conventional IRSL signals measured at ambient temperature, several SAR protocols have been developed to use IRSL to date beyond the quartz OSL dating range19,62–
64. Section A of the Jingbian site has already been dated using IR stimulation at 290
°C after IR stimulation at 200 °C (i.e., pIRIR200,290; Supplementary Table1b)20. Here we present more laboratory tests of the pIRIR200,290signal from the coarse- grained feldspar extracts.
Figure7a shows afirst IR stimulation plateau19and a multi-elevated temperature (MET)Deplateau (using the protocol described by Li and Li64) for the deepest sample in section B. Thefirst IR stimulation plateau results suggest that an apparently stable pIRIR signal is reached when thefirst IR stimulation temperature is≥170 °C. This is consistent with the observations of Li and Li65who showed that for Chinese loess samples withDevalues >~400 Gy, the pIRIR200,290Devalues are greater than pIRIR50,290Devalues. Unfortunately, we did not observe a plateau region in the MET-pIRIR data from this sample and this protocol was not considered further. Based on thefirst IR stimulation plateau, we chose the pIRIR200,290signal as the preferred dating signal for this study. Three other Chinese loess sections have also been successfully dated using the pIRIR200,290signal from polymineral coarse silt grains66and from sand-sized K-rich feldspar67,68.
Based on extensive laboratory testing, Yi et al.68concluded that in pIRIR dating, it is advisable to check for the dependence of the results on test dose size. Figure7b presents the dependence of the dose recovery result on test dose size for sample D38135 (sample also used in Buylaert et al.20). The dose recovery test was carried out by adding beta doses on top of the natural dose in the sample. From these data we deduce that small test doses (<~20% of the dose to be measured) should not be used when large (>500 Gy) doses are measured, in agreement with the observations of Yi et al.68. Colarossi et al.69have shown that in their sample at least part of this effect could be attributed to charge carry-over from Lxto Tx. Figure7c presents another dose recovery test on bleached (24 h in Hönle SOL2 lamp) 90–125 µm feldspar-rich grains from sample D38146 (test dose was ~40% of dose of interest).
The residual dose in this sample after bleaching was 9.9 ± 0.2 Gy (n=3) and this value was subtracted from the measured doses. It can be seen that for doses up to at least ~800 Gy, our chosen SAR pIRIR200,290protocol is able to satisfactorily recover a dose given in the laboratory. Based on these results, the test dose size for all our Demeasurements was kept between ~30% and ~70% of the measured dose.
Post-IR IRSL signals bleach at a much slower rate than the quartz OSL signal19 and there appears to be a residual very-hard-to-bleach (or un-bleachable) component present in the pIRIR200,290signal which needs to be taken into account70,71. Based on a long-term (>80 days) bleaching experiment, Yi et al.68 concluded that a constant (or very difficult to bleach) residual pIRIR50,290signal amounting to ~6 Gy is reached after bleaching for ~300 h in a Hönle SOL2 solar simulator with a lamp-sample distance of 80 cm. Even though a residual dose of
Given dose (Gy)
0 10 20 30 40 50 60
Measured dose (Gy)
0 10 20 30 40 50 60 +10%
–10%
d
Measured to given dose ratio 0.60 0.80 1.00 1.20 1.40
Frequency
0 5 10 15 20 Average = 0.989±0.011 25
(n = 60)
c
Preheat temperature (°C) 160 180 200 220 240 260 280 300 De (Gy)
0 10 20 30 40 50 D38141
Preheat temperature (°C) 160 180 200 220 240 260 280 300
Recuperation (% natural)
0.0 0.2 0.4 0.6
Recycling ratio
0.80 0.90 1.00 1.10
Average De = 35.8±0.8 Gy
a
b
Fig. 5Quartz OSL characteristics.aandbPreheat plateau test for sample D38141; each data point represents the average of six measurements. Dashed line drawn at unity inbserves as an eye-guide to illustrate perfect recycling. Results of dose recovery test shown as histogram (c) and same data as measured to given dose plot (d) for 10 samples from section D. All error bars represent 1 s.e.m.
5–10 Gy in our samples only makes up between 3% and 5% of the lowest pIRIR200,290Dein our pIRIR200,290age data set (sample D38155), we have estimated this component by comparing the feldspar ages of the upper 450 cm in section D (n=50) with young quartz OSL ages. This is because it has been shown that fast component dominated quartz OSL signals can record very small doses72and for
loess the residual quartz OSL dose at deposition has been shown to be negligible70. From Fig.7d, can be seen that there is overall good agreement between feldspar pIRIR200,290and quartz OSL ages but that there is a small pIRIR200,290offset of 1.43
± 0.47 ka. Translating this age offset into dose using the average feldspar dose rate MET stimulation temperature (°C)
0 50 100 150 200 250 300 350 First stimulation temperature (°C) 0 50 100 150 200 250 300 350
De (Gy)
0 200 400 600 800 1000
pIRIR290
MET (Li and Li, 2012)
128183
a
b
Test dose (% of total dose)
0 20 40 60 80 100 120
Dose recovery
0.00 0.50 1.00 1.50 2.00
nat + 100 Gy nat + 500 Gy
+10%
–10%
D38135
1.43±0.47 ka
1:1
Quartz OSL age (ka)
0 5 10 15 20 25
pIRIR200,290 age (ka) 0 5 10 15 20 25
d
+10%
–10%
D38146, 24 h SOL2 bleach
c
0 200 400 600 800 1000
Added dose (Gy)
0 200 400 600 800 1000
Measured dose (Gy)
Fig. 7Feldspar post-IR IRSL characteristics.aFirst IR stimulation pIRIR290and MET-Deplateau tests for sample 128183 (section B).bNatural+beta dose recovery test for pIRIR200,290signal as a function of test dose size for sample D38135 (pIRIR200,290De=47.8 ± 0.6 Gy, no residual subtracted). Red error bars at low test dose are infinite (saturation).cDose recovery test for pIRIR200,290signal using 24 h SOL2 bleached aliquots of sample D38146 (residual dose of 9.9 ± 0.2 Gy was subtracted from measured doses). Test dose varied systematically between sets of aliquots so that it always was between 40%
and 80% of the measured dose.dPlot of pIRIR200,290ages against quartz OSL ages for upper part of section D; the data are consistent with a straight line of unit slope and intercept of 1.43 ± 0.47 ka. Error bars in all graphs represent 1 s.e.m.
OSL IR depletion ratio 0.60 0.80 1.00 1.20 1.40
Count
0 50 100 150 Mean = 0.970±0.003 200
rsd = 6%
n = 461 Normalised De
0.00 0.50 1.00 1.50 2.00
b
2.50Recycling ratio
0.60 0.80 1.00 1.20 1.40
Count
0 50 100 150
200 Mean = 0.997±0.003 rsd = 6%
n = 461 Normalised De
0.00 0.50 1.00 1.50 2.00 2.50
a
Fig. 6Effect of recycling ratio and OSL IR depletion ratio on quartz OSLDe. Samples D38101 to−54 are from section D and at least six aliquots were measured per sample. Bottom graphs show the recycling and OSL IR depletion ratios as a histogram with mean recycling and OSL IR depletion ratios plotted as blue and red dashed lines, respectively. Top graphs show, for the same aliquots, the normalisedDe(to mean sampleDegiven in Supplementary Data1) plotted as a function of recycling ratio (a) or OSL IR depletion ratio (b). Black dashed lines at unity serve as an eye guide
of 3.5 Gy ka−1gives a residual dose of 5 ± 2 Gy. This dose was subtracted from all the pIRIR200,290Devalues prior to calculation of the age (Supplementary Data1).
Material from the outer end of the tubes was used for dose rate analysis.
Samples werefirst ignited at 450 °C for 24 h, homogenised using a ring-grinder and finally cast in wax in a cup or disc geometry. After storage for >21 days to allow
222Rn to build up to equilibrium with its parent226Ra, they were counted for at least 24 h on one of the six gamma spectrometers from the Nordic Laboratory for Luminescence Dating (Aarhus University). The calibration of the spectrometers is described in Murray et al.73. The resulting238U,226Ra,232Th and40K
concentrations are given in Supplementary Data1. Note that for some analyses, the data for238U is not available due to limited sensitivity of some detectors; in this case the226Ra value was used for the entire U series. Radionuclide concentrations were converted into dry beta and gamma dose rates using the conversion factors of Guérin et al.74. During calculation of the infinite matrix dry dose rate, we assumed a222Rn retention factor of 0.80 ± 0.10 for the238U chain; at two standard deviations, this covers a range from no Rn loss to 40% Rn loss. Total dose rates were calculated using life-time average water contents of 10 ± 5 and 15 ± 5%
(weight water/dry sediment weight) for loess and soil units, respectively (this assumption is discussed in more detail below). A small cosmic ray contribution to the dose rate was added based on Prescott and Hutton75.
For K-feldspar grains, we have added an internal beta dose rate based on a K concentration of the feldspar grains of 12.5 ± 0.5%76. This assumption has been tested by measuring the K concentration in 5 feldspar rich extracts (one from each section) using an XRF-attachment mounted on the Risø TL/OSL reader. After chemical separation, we are confident that our samples are almost entirely made up of quartz and feldspar. Thus, the XRF instrument is calibrated using a set of standards which are notionally identical, in terms of composition, to end members of the alkali- and plagioclase feldspar series and to quartz; these standards are arranged to fully cover the sample area. This allows us to convert our count rates under the Na, K and Ca X-ray peaks into relative feldspar contributions (i.e. % of total made up of K-feldspar, etc.). The calibration further allows us to attribute a proportion of Si counts to the 3 feldspar contributions, and any remaining Si counts are attributed to quartz. In general, the sum of the 4 components will be less than unity because the sample area may not be fully covered, and so all contributions are normalised to 100%. Once the feldspar analyses have been located on the ternary, the results can be converted to absolute concentrations of K (and Na and Ca if desired) using stoichiometry. The average K content of thesefive samples is 12.70 ± 0.10%, in excellent agreement with the value proposed by Huntley and Baril76(Fig.8). A Rb concentration of 400 ± 100 ppm was also assumed77. There is furthermore a small contribution from U and Th in K-feldspar grains78and so an assumed effective internal alpha dose rate contribution from U and Th of 0.06 ± 0.03 Gy ka−1was also included. A lower internal alpha dose rate contribution of 0.02 ± 0.01 Gy ka−1was assumed for quartz grains based on the work by Vandenberghe et al.79.
TheDevalues, radionuclide concentrations, total dose rates and resulting quartz OSL and feldspar pIRIR200,290luminescence ages are given in Supplementary Data1.
Age–depth modelling. Bayesian age-depth modelling was performed using the Bacon code80, based on altogether 220 OSL/pIRIR200,290data points in sections A–E. Inverse accumulation rates (sedimentation times, yr cm−1) were estimated from 3 to 8.8 million Markov Chain Monte Carlo (MCMC) iterations and these
rates formed the age–depth models for each section from A to E (see Supple- mentary Data1and Supplementary Fig.2a–e). Inverse accumulation rates were constrained by non-default prior information: acc.shape=1.5 and acc.mean= 0.025–1.0 for the gamma distribution, and mem.mean=0.7 and mem.strength=4 for the beta distribution describing the memory effects (or autocorrelation) of inverse accumulation rates. In all cases, the modelling thickness was specified as 20 cm and Gaussian error distributions were applied (i.e., normal=TRUE). Age modelling was run to achieve 5 cmfinal resolution.
Proxy analyses. Adjacent to the luminescence sampling tubes, samples for MS and grain size analysis were collected at 5–10 cm depth intervals. MS samples were measured in the laboratory using a Bartington MS2 magnetic susceptibility metre.
Approximately 10 g of each sample was oven-dried at 38 °C, placed into weakly magnetic plastic boxes and measured three times to obtain an average value.
Finally, these average values were normalised by the sample mass in order to obtain the mass-specific MS. Grain-size samples were always collected at 5 cm intervals;
about 0.2–0.3 g of bulk material was measured using a Beckman Coulter LS13320 laser diffractometer. The samples were dispersed in 1% ammonium hydroxide for 24 h, and sonication was employed immediately prior to adding the sample to the water column. The settings were verified by means of reproducibility tests of more than 50 sub-samples on both soil and loess layers. Five sub-measurements were conducted and at least three sub-measurements were used for averaging. Dismissal of sub-measurements from the averaging was employed when individual curve data implied bubbles in the system. The low-frequency (470 Hz) MS and sand fraction (>63 µm) results are summarised in Supplementary Data1.
Lag calculation and water content assumption. To compare the July insolation curve (65°N) with the MS records at Jingbian, polynomials werefitted to the data sets with an output resolution of 0.1 ka. Minimum values of thefirst derivative of the polynomials defined inflection points. Lags of the MS records compared to the insolation curve were calculated as age differences between the respective inflection points (Supplementary Table2).
The effect on the insolation lag of different life-time averaged water content assumptions in luminescence dating is important in this study. Our choice of water content and its uncertainty isfirst discussed with respect to literature values and the relevance to individual samples is then considered using the section containing the Holocene soil (section D). We then investigate the dependence on different water content assumptions of the apparent lag between our luminescence dated MS record and the insolation record.
Firstly, although there is some variability in the published water content values for Chinese loess (see discussion in Stevens et al.81), the values used in this study, of 15 ± 5% w.c. for soil and 10 ± 5% w.c. for loess layers, are similar to previous water content assessments for loess/palaeosols from sites in the N and NW of the CLP57,82. In addition, Chen et al.83used a value of 10 ± 5% for a single sample collected in the S8 palaeosol at Jingbian.
We next consider the water content required to reduce the EASM lag to 0 ka for section D. For the two Holocene samples (D38132, w.c. 15% and D38136, w.c.
10%), this would require increasing the water content to ~30% and ~25%, respectively. These water contents are 3 standard deviations from the values used and are close to saturation for sandy loess deposits. However, it is likely that the upper loess–palaeosol units at Jingbian have been well-drained since deposition:
the gully is at least 10 ka old since the Holocene soil is inset into the gully system and the current water table is now around 300 m below the sampling level in a
>280-m-deep gully system10. The river into which the gullyflows has incised into Pliocene red clay below the Quaternary loess. The age of this feature is unknown but is likely to be at least multiple glacial–interglacial cycles. It is thus expected that the upper loess–palaeosol units have remained at least several tens of metres above the water table for the majority and probably all of their burial life-time. Thus, we consider it unlikely that the life-time average water content of this site could have approached the levels that would be required to reduce the lag to 0 ka. It is also worth noting that the water content values required for a zero lag would exceed almost all published values for even southern CLP sites, where precipitation levels are double than those at Jingbian. If, on the other hand, our water content estimates are too high, the dose rates would be higher, the luminescence ages lower and the lag with the insolation larger. Thus, in all likely water content scenarios, there is a significant lag between the EASM recorded in loess and insolation.
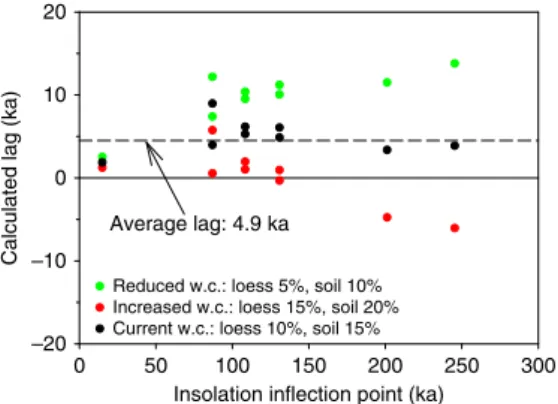
If we now make the additional assumption that the underlying mechanisms causing the insolation lag have not varied systematically with time (which ought to be safe given the lack of an obvious systematic change in ice volume and CO2back in time at insolation inflection points), we would in turn expect the insolation lag to have remained constant within some bounds over the past ~250 ka. This is precisely what is observed in our data (Supplementary Table2and black symbols in Fig.9). However, increasing the water content by one standard deviation (i.e., from 15% to 20% for soil and from 10% to 15% for loess) causes an increase of 4.7% and 4.1% in the quartz and feldspar ages, respectively. Recalculation of the insolation lag using ages based on these higher water contents introduces a negative trend in the insolation lag versus insolation inflection point graph in Fig.9(red symbols). Indeed, using these water contents suggests the physically unrealistic scenario that prior to ~130 ka the loess record of monsoon variability formed before the change occurred in the driving force (change in insolation). A similar
0.00 0.25 0.50 0.75 1.00
0.00
0.25
0.50
0.75
1.00 0.00
0.25 0.50 0.75
1.00 128150 (section A) 128182 (section B) C38125 (section C) D38146 (section D) E38153 (section E)
Na
K
Ca Fig. 8Ternary diagram showing XRF analyses offive K-rich feldspar extracts from Jingbian. Sample averages are based on the results from three-to-six aliquots (each aliquot measured three times). Grain size of K-feldspar extracts was 90–180µm, except for sample D38146 (90–125µm)
but positive trend in the size of the lag is observed when the water content is decreased by 5% (green symbols in Fig.9). In summary, changing the water content by ±5% introduces trends in the lag with time and increases the standard deviation of the lags from the original ~2 ka (Supplementary Table2) to ~3 ka. We conclude that our current water content assumption remains the most likely. It does not produce any systematic trend in the insolation lag with time and, if anything, the uncertainty on the water content has been overestimated.
Data availability. The data that support thefindings of this research can be found in Supplementary Data1or upon request from the corresponding author.
Received: 3 October 2017 Accepted: 2 February 2018
References
1. Yair, A. & Bryan, R. B. inLinking Climate Change to Land Surface Change(eds McLaren, S. J. & Kniveton, D. R.) 49–63 (Kluwer Academic Publishers, Dordrecht, Springer Netherlands, 2000).
2. Li, J., Zhao, Y., Liu, H. & Su, Z. Sandy desertification cycles in the southwestern Mu Us Desert in China over the past 80 years recorded based on nebkha sediments.Aeolian Res.20, 100–107 (2016).
3. Crouvi, O., Amit, R., Enzel, Y. & Gillespie, A. R. Active sand seas and the formation of desert loess.Quat. Sci. Rev.29, 2087–2098 (2010).
4. Lancaster, N., Yang, X. & Thomas, D. Spatial and temporal complexity in Quaternary desert datasets: implications for interpreting past dryland dynamics and understanding potential future changes.Quat. Sci. Rev.78, 301–302 (2013).
5. Mahowald, N. et al. The size distribution of desert dust aerosols and its impact on the Earth system.Aeolian Res.15, 53–71 (2014).
6. Lancaster, N. Palaeoclimatic evidence from sand seas.Palaeogeogr.
Palaeoclimatol. Palaeoecol.76, 279–290 (1990).
7. Sun, J. Origin of eolian sand mobilization during the past 2300 years in the Mu Us desert, China.Quat. Res.53, 78–88 (2000).
8. Lu, H. et al. Chinese deserts and sandfields in Last Glacial Maximum and Holocene Optimum.Chin. Sci. Bull.58, 2775–2783 (2013).
9. Xu, Z. et al. Climate-driven changes to dune activity during the Last Glacial Maximum and deglaciation in the Mu Us dunefield, north-central China.
Earth Planet. Sci. Lett.427, 149–159 (2015).
10. Ding., Z. L., Derbyshire, E., Yang, S. L., Sun, J. M. & Liu, T. S. Stepwise expansion of desert environment across northern China in the past 3.5 Ma and implications for monsoon evolution.Earth Planet. Sci. Lett.237, 45–55 (2005).
11. Cohen, K. M., Finney, S. C., Gibbard, P. L. & Fan, J.-X. The ICS international chronostratigraphic chart.Episodes36, 199–204 (2013).
12. Ding, Z. L. et al. Stacked 2.6-Ma grain size record from the Chinese loess based onfive sections and correlation with the deep-seaδ18O record.
Paleoceanography17, 5-1–5-21 (2002).
13. Prokopenko, A. A., Hinnov, L. A., Williams, D. F. & Kuzmin, M. I. Orbital forcing of continental climate during the Pleistocene: a complete
astronomically tuned climatic record from Lake Baikal, SE Siberia.Quat. Sci.
Rev.25, 3431–3457 (2006).
14. Mason, J. A. et al. Dune mobility and aridity at the desert margin of northern China at a time of peak monsoon strength.Geology37, 947–950 (2009).
15. Sun, J., Ding, Z. L., Liu, T. S., Rokosh, D. & Rutter, N. 580,000-year environmental reconstruction from aeolian deposits at the Mu Us Desert margin.Quat. Sci. Rev.18, 1351–1364 (1999).
16. Stevens, T., Lu, H., Thomas, D. S. G. & Armitage, S. J. Optical dating of abrupt shifts in the late Pleistocene East Asian monsoon.Geology36, 415–418 (2008).
17. Kapp, P. et al. From dust to dust: Quaternary wind erosion of the Mu Us Desert and Loess Plateau, China.Geology43, 835–838 (2015).
18. Licht, A., Pullen, A., Kapp, P., Abell, J. & Giesler, D. Eolian cannibalism:
Reworked loess andfluvial sediment as the main sources of the Chinese Loess Plateau.Geol. Soc. Am. Bull.128, 944–956 (2016).
19. Buylaert, J.-P. et al. A robust feldspar luminescence dating method for Middle and Late Pleistocene sediments.Boreas41, 435–451 (2012).
20. Buylaert, J.-P. et al. A detailed post-IR IRSL chronology for the last interglacial soil at the Jingbian site (northern China).Quat. Geochronol.30, 194–199 (2015).
21. Roberts, H. M., Wintle, A. G., Maher, B. A. & Hu, M. Holocene sediment- accumulation rates in the western Loess Plateau, China, and a 2500-year record of agricultural activity, revealed by OSL dating.Holocene11, 477–483 (2001).
22. Berger, A. & Loutre, M. F. Insolation values for the climate of the last 10 million years.Quat. Sci. Rev.10, 297–317 (1991).
23. Lisiecki, L. E. & Raymo M. E. A Pliocene-Pleistocene stack of 57 globally distributed benthicδ18O records.Paleoceanography20, PA1003 (2005).
24. Hao, Q. Z. et al. Delayed build-up of Arctic ice sheets during 400,000-year minima in insolation variability.Nature490, 393–396 (2012).
25. Sun, Y. et al. Influence of Atlantic meridional overturning circulation on the East Asian winter monsoon.Nat. Geosci.5, 46–49 (2012).
26. Jhun, J. G. & Lee, E. J. A new East Asian winter monsoon index and associated characteristics of the winter monsoon.J. Clim.17, 711–726 (2004).
27. Nie, J. S. et al. Loess Plateau storage of Northeastern Tibetan Plateau-derived Yellow River sediment.Nat. Commun.6, 8511 (2015).
28. Sun, D. H. et al. Magnetostratigraphy and palaeoenvironmental records for Late Cenozoic sedimentary sequence from Lanzhou, Northeastern margin of the Tibetan Plateau.Glob. Planet. Change76, 106–116 (2011).
29. Roe, G. On the interpretation of Chinese loess as a paleoclimate indicator.
Quat. Res.71, 150–161 (2009).
30. Perkins, S. Dust, the thermostat: How tiny airborne particles manipulate global climate.Sci. News160, 200–202 (2001).
31. Kang, S. G., Roberts, H. M., Wang, X. L., An, Z. S. & Wang, M. Mass accumulation rate changes in Chinese loess during MIS 2, and asynchrony with records from Greenland ice cores and North Pacific Ocean sediments during the Last Glacial Maximum.Aeolian Res.19, 251–258 (2015).
32. Stevens, T. et al. Mass accumulation rate and monsoon records from Xifeng, Chinese Loess Plateau, based on a luminescence age model.J. Quat. Sci.31, 391–405 (2016).
33. Wang, Y. J. et al. A high-resolution absolute-dated Late Pleistocene monsoon record from Hulu Cave, China.Science294, 2345–2348 (2001).
34. Wang, Y. et al. Millennial- and orbital-scale changes in the East Asian monsoon over the past 224,000 years.Nature451, 1090–1093 (2008).
35. Clemens, S. C., Prell, W. L. & Sun Y. Orbital-scale timing and mechanisms driving Late Pleistocene Indo-Asian summer monsoons: Reinterpreting cave speleothemδ18O.Paleoceanography25, PA4207 (2010).
36. Kutzbach, J. E., Liu, X., Liu, Z. & Chen, G. Simulation of the evolutionary response of global summer monsoons to orbital forcing over the last 280,000 years.Clim. Dynam.30, 567–579 (2007).
37. Wang, P. X. et al. The global monsoon across timescales: Mechanisms and outstanding issues.Earth-Sci. Rev.174, 84–121 (2017).
38. Sun, Y. et al. Astronomical and glacial forcing of East Asian summer monsoon variability.Quat. Sci. Rev.115, 132–142 (2015).
39. Lu, H. et al. Late Quaternary aeolian activity in the Mu Us and Otindag dune fields (north China) and lagged response to insolation forcing.Geophys. Res.
Lett.32, L21716 (2005).
40. Lu, H. et al. Variation of East Asian monsoon precipitation during the past 21 k.y. and potential CO2forcing.Geology41, 1023–1026 (2013).
41. Clemens, S. C. & Prell, W. L. A 350,000 year summer-monsoon multi-proxy stack from the Owen Ridge, Northern Arabian Sea.Mar. Geol.201, 35–51 (2003).
42. Maher, B. A., Alekseev, A. & Alekseeva, T. Magnetic mineralogy of soils across the Russian Steppe: climatic dependence of pedogenic magnetite formation.
Palaeogeogr. Palaeoclimatol. Palaeoecol.201, 321–341 (2003).
43. Liu, Q. S. et al. Mechanism of the magnetic susceptibility enhancements of the Chinese loess.J. Geophys. Res.109, B12107 (2004).
44. Maher, B. A. The magnetic properties of Quaternary Aeolian dusts and sediments, and their palaeoclimatic significance.Aeolian Res.3, 87–144 (2011).
Insolation inflection point (ka)
0 50 100 150 200 250 300
Calculated lag (ka)
–20 –10 0 10 20
Reduced w.c.: loess 5%, soil 10%
Increased w.c.: loess 15%, soil 20%
Current w.c.: loess 10%, soil 15%
Average lag: 4.9 ka
Fig. 9Insolation lag as a function of insolation inflection point time for different water content assumptions. Dashed line is drawn at the average of the insolation lag data given in Supplementary Table2(black symbols) and shown in Fig.4. Solid line indicates no lag