water
Article
Iron-Loaded Pomegranate Peel as a Bio-Adsorbent for Phosphate Removal
Naoufal Bellahsen1, Balázs Kakuk2 , Sándor Beszédes3 , Zoltán Bagi2, Nóra Halyag4, Tamás Gyulavári5 , Szabolcs Kertész3, Ahmed El Amarti6, Etelka Tombácz7and Cecilia Hodúr3,*
Citation: Bellahsen, N.; Kakuk, B.;
Beszédes, S.; Bagi, Z.; Halyag, N.;
Gyulavári, T.; Kertész, S.; Amarti, A.E.; Tombácz, E.; Hodúr, C.
Iron-Loaded Pomegranate Peel as a Bio-Adsorbent for Phosphate Removal.Water2021,13, 2709.
https://doi.org/10.3390/w13192709
Academic Editor: Laura Bulgariu
Received: 28 July 2021 Accepted: 28 September 2021 Published: 30 September 2021
Publisher’s Note:MDPI stays neutral with regard to jurisdictional claims in published maps and institutional affil- iations.
Copyright: © 2021 by the authors.
Licensee MDPI, Basel, Switzerland.
This article is an open access article distributed under the terms and conditions of the Creative Commons Attribution (CC BY) license (https://
creativecommons.org/licenses/by/
4.0/).
1 Faculty of Science and Informatics, Doctoral School of Environmental Science, University of Szeged, Moszkvai krt. 9, 6725 Szeged, Hungary; naoufal.bel@hotmail.com
2 Department of Biotechnology, University of Szeged, Közép fasor 52, 6726 Szeged, Hungary;
kakuk.balazs@med.u-szeged.hu (B.K.); bagiz@brc.hu (Z.B.)
3 Department of Process Engineering, Faculty of Engineering, University of Szeged, Moszkvai krt. 9, 6725 Szeged, Hungary; beszedes@mk.u-szeged.hu (S.B.); kertesz@mk.u-szeged.hu (S.K.)
4 Institute of Raw Materials Preparation and Environmental Processing, Faculty of Earth Science &
Engineering, University of Miskolc, Egyetemváros, 3515 Miskolc, Hungary; ejtpnora@uni-miskolc.hu
5 Department of Applied and Environmental Chemistry, University of Szeged, Rerrich B. ter 1, 6720 Szeged, Hungary; gyulavarit@chem.u-szeged.hu
6 Department of Chemistry, Faculty of Science of Tetouan, University of Abdelmalek Esaadi, Avenue de Sebta, Mhannech II, Tetouan 93002, Morocco; ahmed-elamarti@hotmail.com
7 Soós Water Technology Research and Development Center, University of Pannonia, 8200 Nagykanizsa, Hungary; tombacz.etelka@sooswrc.hu
* Correspondence: hodur@mk.u-szeged.hu; Tel.: +36-62-546-500
Abstract: This study investigated the adsorption of phosphate from aqueous solutions using pomegranate peel (PP) as a bio-adsorbent. For this purpose, PP was activated via saponification using sodium hydroxide (NaOH) followed by cationization using iron chloride (FeCl3). The iron-loaded PP (IL-PP) was characterized using zeta potential measurement, scanning electron microscopy, and Fourier transform infrared analysis. The batch adsorption method was followed to determine the equilibrium time and effect of pH on the adsorption process. The full factorial design methodology was used to analyze the effects of influencing parameters and their interactions. The effective re- moval of phosphate up to 90% was achieved within 60 min, at pH 9 and 25◦C temperature using a 150 mg dose of IL-PP. A non-linear method was used for the modeling of isotherm and kinetics. The results showed that the kinetics is best fitted to the Elovich model (R2= 0.97), which assumes the dominance of the chemisorption mechanism, whereas the isotherm obeys both Langmuir (R2= 0.98) and Freundlich (R2= 0.94) models with a maximum phosphate uptake of 49.12 mg·g−1. Investigation of thermodynamic parameters indicated the spontaneity and endothermic nature of the process.
These results introduce IL-PP as an efficient bio-adsorbent of phosphate.
Keywords:adsorption; bio-adsorbent; phosphate removal; pomegranate peel; recycling
1. Introduction
Excess release of phosphorus is the main culprit for the eutrophication of freshwater and marine ecosystems [1]. Phosphorus is a nonrenewable and irreplaceable element for plant growth, and its role is crucial in agricultural production [2]. The accelerated growth in food demand has also increased the demand for phosphate fertilizers, which has placed stress on phosphate rock sources and is exhausting existing deposits [3]. The phosphate mining industry is also facing serious challenges regarding water availability for the mining process and a decrease in the quality of phosphate rocks [4]. Thus, the recovery of phosphate from wastewater is highly required to sustain the global food supply, preserve water resources, and protect the environment. Several biological, physical, and chemical methods exist for phosphate removal and recovery from aqueous solutions [5,6]. Among
Water2021,13, 2709. https://doi.org/10.3390/w13192709 https://www.mdpi.com/journal/water
Water2021,13, 2709 2 of 20
them, adsorption technologies are the most advantageous because of their simplicity, cost- effectiveness, and wide availability of existing and potential adsorbents that can potentially be directly applied to soil as fertilizer when loaded with phosphate [3,7].
Expanding agricultural activities in addition to irresponsible food production and consumption has resulted in more than 1.3 billion tons of agricultural and food waste deposited annually according to the Food and Agriculture Organization of the United Nations (FAO), which has had several environmental, financial, and social implications [8,9].
Although reducing this waste is one of the Sustainable Development Goals for 2030, efforts remain insufficient because more awareness and radical changes are needed in consumer attitudes and economic policies of countries. Different approaches have been considered for the revalorization of this biomass waste to gain environmental, financial, and social benefits, such as livestock feed, bioenergy production, bioactive compound recovery, food industry, and soil fertilization [10,11]. One approach has been to convert biomass waste into bio-adsorbents for pollutant removal and recovery [12–16]. However, the biomass waste must be activated to develop desirable physicochemical properties for phosphate uptake [17].
Pomegranate peel (PP) is a widely abundant biomass waste because of the huge production of the pomegranate fruit. Approximately 1.5 million tons of PP is estimated to be produced per year [16], which is a major environmental concern for producer coun- tries (e.g., India, Iran, Turkey, the United States, China, Spain, and Morocco) [18,19]. To mitigate this problem, various revalorization methods have been introduced, such as the production of valuable compounds for essential oils [20,21], food additives [22], and medic- inal products [23], as well as energy and value-added products such as bioethanol and biogas [24,25]. PP is increasingly being used as a bio-adsorbent for heavy metals, dyes, and other contaminants [9,26–42]. The present study investigated the efficiency of activated PP at phosphate removal from an aqueous solution.
2. Materials and Methods 2.1. The Stock Solution
The stock solution of phosphate (1000 mg·L−1) was prepared by dissolving Na2HPO4· 2H2O in deionized water, which was then diluted to the desired concentrations using distilled water. The adjustment of pH values of the phosphate solutions was done using hydrochloric acid (HCl) and sodium hydroxide (NaOH) solutions. All chemicals used in this study were of analytical reagent grade.
2.2. Preparation and Activation of PP
PP was activated using an iron loading method similar to that of Nguyen et al. [43]
for improving the PO43−retention ability. First, PP was collected, cut into small pieces, and washed with distilled water several times until the washing solution became clear. It was oven-dried at 105◦C for 2 h and then ground to the desired particle size (<250µm).
The first step of the activation method was the base treatment or saponification, where 40 g of PP was stirred for 24 h with 1 L of a NaOH solution (0.05 M) at room temperature and then washed carefully with distilled water until the pH of washing solution became neutral. The saponification step aimed to improve the cationic exchange capacity of PP and promote the incorporation of iron ions (Fe3+) on its surface. The second step was the iron loading, where the saponified PP was stirred with 500 mL of an iron chloride (FeCl3) solution (0.25 M) at room temperature for 24 h. Finally, the iron-loaded PP (IL-PP) was carefully washed with distilled water again and oven-dried at 105◦C for 8 h, and then, it was mechanically milled with a planetary ball mill to the desired particle size (<250µm) before use in the adsorption experiments.
2.3. Characterization of IL-PP
The zeta potentials of PP and IL-PP were measured using 10 mg suspensions mixed in bottles containing 30 mL of sodium chloride (NaCl) and disodium hydrogen phosphate
Water2021,13, 2709 3 of 20
(Na2HPO4) solutions at different concentrations and pH values. After mixing, the equilib- rium pH of the samples was measured and adjusted. Then, the zeta potential was measured with a Nano ZS apparatus (Malvern, Worcestershire, UK) using electrophoretic light scat- tering. All samples were prepared in triplicate, and the average of the measurements was used for data analysis.
Scanning electron microscopy (SEM) was also used to image the microstructures of PP and IL-PP and compare their surface morphologies. Samples were analyzed using a Hitachi S-4700 type II scanning electron microscope. A cold field emission gun and 10 kV acceleration voltage were applied to respectively produce and accelerate the electron beam.
Micrographs were recorded by collecting secondary electrons with an Everhart–Thornley detector.
Fourier transform infrared (FTIR) spectra of PP and IL-PP were used to observe the functional groups present on their surface and assess the occurred changes after the activation of PP and the adsorption of phosphate (PO43−) by IL-PP. The spectra were recorded with a BIO-RAD Digilab Division FTS-65A/896 FTIR spectrophotometer having a 4 cm−1resolution in the middle infrared range of 4000–400 cm−1. Each spectrum was scanned 256 times. In addition to the spectra of each sample, single-reflection diamond attenuated total reflection accessory measurements were taken using the diffuse reflection technique and an angle of incidence of 45◦. The software Omnic 7.3 was used for FTIR data collection.
2.4. Batch Adsorption
The batch adsorption method was used to determine the equilibrium time and effect of pH on PO43−adsorption by IL-PP. For this purpose, 50 mL of Na2HPO4solution (PO4-P concentration of 40 mg·L−1) was stirred at 150 rpm with different IL-PP doses (100 and 150 mg) doses and pH values (from 3 to 9) at a constant temperature of 25◦C. To identify the most important factors affecting the removal of PO43−by IL-PP, 23factorial design (three factors each, at two levels) with the Minitab 19 software was used. This technique allows the analysis of several factors simultaneously within a reduced total number of experiments [44]. The initial PO4-P concentration (40 mg·L−1), contact time (60 min), and stirring speed (150 rpm) were kept constant, and the three factors of the pH, adsorbent dose, and solution temperature were varied at two levels, as shown in Table1.
Table 1.Levels of parameters used in the factorial design for PO43−removal by IL-PP.
Parameter Coded Symbol Low Level (−1) High Level (+1)
pH A 3 9
Adsorbent dose (mg) B 100 150
Temperature (◦C) C 25 45
PO4-P concentration was determined by Spectrophotometer Spectroquant Nova 60 (Merck, Germany) after filtering samples through 0.45µm microporous membrane filters.
The PO43−removal rate was calculated using Equation (1):
Removal % = Ci−Cf Ci
·100 (1)
where Ci(mg·L−1) and Cf(mg·L−1) are the initial and final PO4-P concentrations, respectively.
The adsorbed amount of PO4-P was calculated using Equation (2):
qe
mg·g−1
= (Ci−Ce)V
M (2)
where Ci(mg·L−1) and Ce(mg·L−1) are the initial and equilibrium concentrations, respec- tively, of PO4-P in the solution; V (L) is the solution volume; and M (g) is the mass of the adsorbent.
Water2021,13, 2709 4 of 20
The isotherm of PO43− adsorption by IL-PP was studied through a series of batch adsorption experiments at a stable temperature using different doses of IL-PP and a constant initial PO4-P concentration. Factorial design experiments were performed to identify and optimize the adsorption kinetics. To determine the isotherm and kinetic models that adequately describe PO43−adsorption by IL-PP, isotherm and kinetics data were fitted to existing mathematical models by a nonlinear method using the Solver add- in command in Microsoft Excel [45]. The best fitting kinetic and isotherm models were selected mainly based on the value of the nonlinear correlation coefficient (R2). However, the chi-square (χ2) statistics helped confirm this selection. A value ofχ2close to 0 meant that the selected model fit the experimental data well, whereas a high value ofχ2indicated that the model was inappropriate [46]. R2andχ2were calculated using Equations (3) and (4), respectively:
R2= ∑
qe,cal−qe,mean
2
∑
qe,cal−qe,mean2
+∑qe,cal−qe,exp
2
(3)
χ2=
∑
qe,exp−qe,cal
2
qe,cal (4)
where qe,exp(mg·g−1) is the amount of PO4-P uptake at equilibrium obtained from Equation (2), qe,cal(mg·g−1) is the amount of PO4-P uptake calculated from the model using the Solver add-in command, and qe,mean(mg·g−1) is the mean of the qe,expvalues.
To study the thermodynamics of PO43−adsorption by IL-PP, parameters such as the standard Gibbs free energy change (∆G), standard enthalpy change (∆H), and standard entropy change (∆S) were determined using Equations (5) and (6):
∆G =−R T lnKd (5)
LnKd= ∆H
◦
R T +∆S
◦
R (6)
where T is the absolute temperature in kelvins and R is the gas constant (8.314 J mol−1K−1).
Kdis the distribution coefficient for the adsorption and was obtained by plotting ln (qe/Ce) against Ceand extrapolating to zero Ce. Then, the obtained value was multiplied by 1000 as proposed by Milonji´c [47].
3. Results and Discussion 3.1. Characterization Results 3.1.1. Zeta Potential
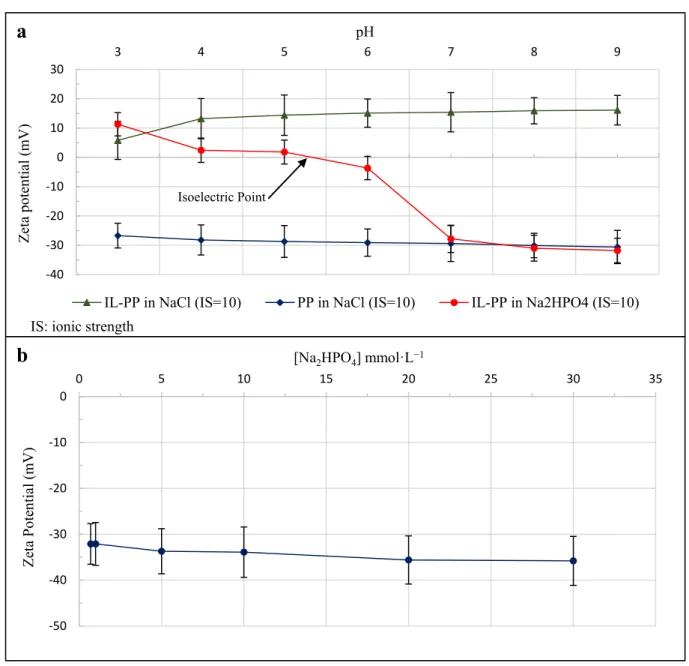
Determining the zeta potential of the electric double layer surrounding the adsorbent surface at various solutions with different pH values and similar ionic strength (IS) is important because it provides insights into the adsorbent surface chemistry and possible interactions with the adsorbate [48]. Figure1a shows that in the NaCl solution (IS = 10), IL-PP showed a positive zeta potential over the entire pH range considered in this study:
from +5.8 mV at pH 3 to +16.1 mV at pH 9. By contrast, PP showed negative values:
from−26.7 mV at pH 3 to−30.6 mV at pH 9. These results indicate that the PP surface became positively charged after the incorporation of Fe3+. The zeta potential of IL-PP in the Na2HPO4solution (IS = 10) decreased from +11.3 to−31.8 mV when the pH was increased from 3 to 9, and the isoelectric point can be interpolated at pH 5.4. This means that the IL-PP surface had an excess negative charge at pH > 5.4 and an excess positive charge at pH < 5.4. The decrease in surface charge is due to the neutralization of positive functional groups present on the IL-PP surface (mainly Fe3+) by PO43−. However, in the NaCl solution, Cl− could not neutralize the IL-PP surface, so the IL-PP surface had a high affinity toward PO43−through a specific adsorption mechanism rather than a simple electrostatic attraction. Figure1b shows that the zeta potential of IL-PP decreased when
Water2021,13, 2709 5 of 20
the Na2HPO4concentration was increased. The compression of the diffuse layer, which caused more PO43−anions to attach to this layer could be the reason for this behavior [49].
Water 2021, 13, x FOR PEER REVIEW 5 of 20
charge at pH < 5.4. The decrease in surface charge is due to the neutralization of positive functional groups present on the IL-PP surface (mainly Fe3+) by PO43−. However, in the NaCl solution, Cl− could not neutralize the IL-PP surface, so the IL-PP surface had a high affinity toward PO43− through a specific adsorption mechanism rather than a simple electrostatic attraction. Figure 1b shows that the zeta potential of IL-PP decreased when the Na2HPO4 concentration was increased. The compression of the diffuse layer, which caused more PO43− anions to attach to this layer could be the reason for this behavior [49].
Figure 1. Zeta potentials of PP and IL-PP in NaCl and Na2HPO4 solutions as functions of pH (a) and IL-PP as a function of the Na2HPO4 concentration (b).
3.1.2. SEM Results
Figure 2 shows SEM micrographs of PP (a) and IL-PP (b) at 50,000× magnification.
The PP surface was relatively smooth and flat, but IL-PP had a much rougher surface with a coarser texture, which proves that Fe3+ was incorporated. This modification of the morphology made the surface irregular and thus more suitable for PO43− uptake [50].
-40 -30 -20 -10 0 10 20 30
3 4 5 6 7 8 9
Zeta potential (mV)
pH
IS: ionic strength
IL-PP in NaCl (IS=10) PP in NaCl (IS=10) IL-PP in Na2HPO4 (IS=10) Isoelectric Point
a
-50 -40 -30 -20 -10 0
0 5 10 15 20 25 30 35
Zeta Potential (mV)
[Na2HPO4] mmol·L−1
b
Figure 1.Zeta potentials of PP and IL-PP in NaCl and Na2HPO4solutions as functions of pH (a) and IL-PP as a function of the Na2HPO4concentration (b).
3.1.2. SEM Results
Figure2shows SEM micrographs of PP (a) and IL-PP (b) at 50,000×magnification.
The PP surface was relatively smooth and flat, but IL-PP had a much rougher surface with a coarser texture, which proves that Fe3+was incorporated. This modification of the morphology made the surface irregular and thus more suitable for PO43−uptake [50].
Water2021,13, 2709 6 of 20
Water 2021, 13, x FOR PEER REVIEW 6 of 20
Figure 2. SEM images of PP (a) and IL-PP (b).
3.1.3. FTIR Analysis
Figure 3 shows the FTIR spectra of PP and IL-PP before and after PO43− adsorption.
Table 2 presents the results of the analysis carried out to identify the functional groups present on their surfaces and understand the possible interactions responsible for the incorporation of Fe3+ onto the surface of PP and for the adsorption of PO43− by IL-PP. The observed bands in the PP surface agree with similar FTIR studies on functional groups present in PP [31,51]. However, the IL-PP spectra showed important changes character- ized mainly by the appearance of a new peak at 801 cm−1, which can be assigned to the Fe–OH band [52,53], and the disappearance of several bands at 1719, 1442, 1223, 876, and 747 cm−1. These variations confirm the incorporation of Fe3+ on the PP surface. The IL-PP spectra after PO43− adsorption revealed the appearance of a new peak at 1601 cm−1, which can be attributed to the bending vibration of Fe–P and, therefore, confirms PO43− adsorp- tion by IL-PP [54].
Table 2. FTIR analysis of PP and IL-PP before and after PO43− adsorption.
Adsorption Band (cm−1)
Assignment PP IL-PP IL-PP after PO43− Adsorption
3323 3306 3327 –OH and N–H
2931 2918 2924 C–H, –CH3, or –CH2
1719 – – C=O and C–C
1615 1617 – C=C, C=O, or N–H
– – 1601 Fe-P
1442 – – –OH
1320 1313 1318 C–H, –CH3, or –CH2
1223 – – O–H
1031 1030 – C-O and C-O–C
876 – – O–H, C=O, and O–H
– 801 – Fe–OH
747 – – C–N
Figure 2.SEM images of PP (a) and IL-PP (b).
3.1.3. FTIR Analysis
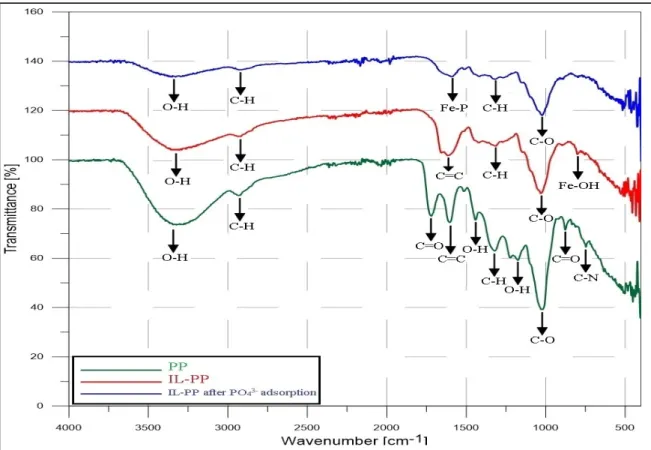
Figure3shows the FTIR spectra of PP and IL-PP before and after PO43−adsorption.
Table2presents the results of the analysis carried out to identify the functional groups present on their surfaces and understand the possible interactions responsible for the incorporation of Fe3+onto the surface of PP and for the adsorption of PO43−by IL-PP. The observed bands in the PP surface agree with similar FTIR studies on functional groups present in PP [31,51]. However, the IL-PP spectra showed important changes characterized mainly by the appearance of a new peak at 801 cm−1, which can be assigned to the Fe–OH band [52,53], and the disappearance of several bands at 1719, 1442, 1223, 876, and 747 cm−1. These variations confirm the incorporation of Fe3+on the PP surface. The IL-PP spectra after PO43−adsorption revealed the appearance of a new peak at 1601 cm−1, which can be attributed to the bending vibration of Fe–P and, therefore, confirms PO43−adsorption by IL-PP [54].
Table 2.FTIR analysis of PP and IL-PP before and after PO43−adsorption.
Adsorption Band (cm−1)
Assignment PP IL-PP IL-PP after PO43−Adsorption
3323 3306 3327 –OH and N–H
2931 2918 2924 C–H, –CH3, or –CH2
1719 – – C=O and C–C
1615 1617 – C=C, C=O, or N–H
– – 1601 Fe-P
1442 – – –OH
1320 1313 1318 C–H, –CH3, or –CH2
1223 – – O–H
1031 1030 – C-O and C-O–C
876 – – O–H, C=O, and O–H
– 801 – Fe–OH
747 – – C–N
WaterWater 2021, 13, x FOR PEER REVIEW 2021,13, 2709 7 of 207 of 20
Figure 3. FTIR spectra of PP and IL-PP before and after PO43− adsorption.
3.2. Batch Adsorption Results 3.2.1. Effect of pH
The pH is a critical parameter in the adsorption process because it affects the chem- istry of the solution and the stability of functional groups present on the adsorbent sur- face, which controls the adsorbent–adsorbate interaction [55]. Depending on the solution pH, PO43− can exist in four species: H3PO4 (pH~2.15), H2PO4− (2.15 < pH < 7.20), HPO42−
(7.20 < pH < 12.33), and PO43− (pH~12.33) [56]. Figure 4 shows that PO43− removal by 100 mg of IL-PP increased from 43.5% to 64.25% when the pH was increased from 3 to 9. This is because there is just one possible interaction between H2PO4− and Fe3+, which is monodentate/mononuclear. However, there are three different possible interactions be- tween HPO42− and Fe3+: monodentate/mononuclear, bidentate/mononuclear, and mono- dentate/binuclear [57]. This led to the high PO43− removal by IL-PP. These results are in agreement with the decrease in the zeta potential of the IL-PP surface in the Na2HPO4 solution when the pH was increased, which indicates that more PO43− ions were attached to this surface. For each sample, the equilibrium pH value was lower than the initial pH value, which indicates that large quantities of hydrogen ions were produced by Fe3+ hy- drolysis and reduced the equilibrium pH [58].
Figure 3.FTIR spectra of PP and IL-PP before and after PO43−adsorption.
3.2. Batch Adsorption Results 3.2.1. Effect of pH
The pH is a critical parameter in the adsorption process because it affects the chemistry of the solution and the stability of functional groups present on the adsorbent surface, which controls the adsorbent–adsorbate interaction [55]. Depending on the solution pH, PO43−can exist in four species: H3PO4(pH~2.15), H2PO4−(2.15 < pH < 7.20), HPO42−
(7.20 < pH < 12.33), and PO43−(pH~12.33) [56]. Figure4shows that PO43−removal by 100 mg of IL-PP increased from 43.5% to 64.25% when the pH was increased from 3 to 9. This is because there is just one possible interaction between H2PO4−and Fe3+, which is monodentate/mononuclear. However, there are three different possible interactions between HPO42− and Fe3+: monodentate/mononuclear, bidentate/mononuclear, and monodentate/binuclear [57]. This led to the high PO43−removal by IL-PP. These results are in agreement with the decrease in the zeta potential of the IL-PP surface in the Na2HPO4 solution when the pH was increased, which indicates that more PO43−ions were attached to this surface. For each sample, the equilibrium pH value was lower than the initial pH value, which indicates that large quantities of hydrogen ions were produced by Fe3+
hydrolysis and reduced the equilibrium pH [58].
3.2.2. Determination of the Equilibrium Time
Figure5shows the equilibrium time for PO43−removal by IL-PP, which was studied using two different doses of IL-PP (100 and 150 mg) and fixed values for the PO4-P concen- tration (40 mg·L−1), pH (9), and temperature (25◦C). Within the first 2 min, rapid PO43−
uptake took place with removal rates of 51% and 76.5% for 100 and 150 mg, respectively, of IL-PP. This fast uptake is due to the presence of a large number of active sites to which a large amount of PO43−anions could attach. Afterward, due to the saturation of available active sites, the removal rate decreased and equilibrium approached [13]. The equilibrium state for PO43−removal was reached within 60 min. Removal rates of 64.25% and 90%
were achieved with 100 and 150 mg, respectively, of IL-PP.
Water2021,13, 2709 8 of 20
Water 2021, 13, x FOR PEER REVIEW 8 of 20
Figure 4. Effect of pH on PO43− removal by IL-PP (PO4-P concentration: 40 mg·L−1, adsorbent dose: 100 mg, temperature:
25 °C, stirring speed: 150 rpm).
3.2.2. Determination of the Equilibrium Time
Figure 5 shows the equilibrium time for PO43− removal by IL-PP, which was studied using two different doses of IL-PP (100 and 150 mg) and fixed values for the PO4-P con- centration (40 mg·L−1), pH (9), and temperature (25 °C). Within the first 2 min, rapid PO43− uptake took place with removal rates of 51% and 76.5% for 100 and 150 mg, respectively, of IL-PP. This fast uptake is due to the presence of a large number of active sites to which a large amount of PO43− anions could attach. Afterward, due to the saturation of available active sites, the removal rate decreased and equilibrium approached [13]. The equilib- rium state for PO43− removal was reached within 60 min. Removal rates of 64.25% and 90% were achieved with 100 and 150 mg, respectively, of IL-PP.
Figure 5. Effect of contact time on PO43− removal by IL-PP (PO4-P concentration: 40 mg·L−1, pH: 9, temperature: 25 °C, stirring speed: 150 rpm).
0 10 20 30 40 50 60 70 80 90 100
0 2 4 6 8 10 20 30 40 50 60
Removal %
Time (min)
100 mg IL-PP 150 mg IL-PP
Figure 4.Effect of pH on PO43−removal by IL-PP (PO4-P concentration: 40 mg·L−1, adsorbent dose: 100 mg, temperature:
25◦C, stirring speed: 150 rpm).
Water 2021, 13, x FOR PEER REVIEW 8 of 20
Figure 4. Effect of pH on PO43− removal by IL-PP (PO4-P concentration: 40 mg·L−1, adsorbent dose: 100 mg, temperature:
25 °C, stirring speed: 150 rpm).
3.2.2. Determination of the Equilibrium Time
Figure 5 shows the equilibrium time for PO43− removal by IL-PP, which was studied using two different doses of IL-PP (100 and 150 mg) and fixed values for the PO4-P con- centration (40 mg·L−1), pH (9), and temperature (25 °C). Within the first 2 min, rapid PO43−
uptake took place with removal rates of 51% and 76.5% for 100 and 150 mg, respectively, of IL-PP. This fast uptake is due to the presence of a large number of active sites to which a large amount of PO43− anions could attach. Afterward, due to the saturation of available active sites, the removal rate decreased and equilibrium approached [13]. The equilib- rium state for PO43− removal was reached within 60 min. Removal rates of 64.25% and 90% were achieved with 100 and 150 mg, respectively, of IL-PP.
Figure 5. Effect of contact time on PO43− removal by IL-PP (PO4-P concentration: 40 mg·L−1, pH: 9, temperature: 25 °C, stirring speed: 150 rpm).
0 10 20 30 40 50 60 70 80 90 100
0 2 4 6 8 10 20 30 40 50 60
Removal %
Time (min)
100 mg IL-PP 150 mg IL-PP
Figure 5.Effect of contact time on PO43−removal by IL-PP (PO4-P concentration: 40 mg·L−1, pH: 9, temperature: 25◦C, stirring speed: 150 rpm).
3.2.3. Factorial Design
The factorial design methodology was used to determine the importance of the three factors (pH, adsorbent dose, and temperature) and their interactions on PO43−removal by IL-PP. Factorial design plots such as plots for the main effects and interactions, Pareto chart, and normal plot for the standardized effects describe the interactive relation between the factors and their levels [59]. This technique investigates all possible combinations and verifies the accuracy of the obtained mathematical model through the analysis of variance (ANOVA) to achieve optimum removal of PO43−. Table3and Figure6present the results
Water2021,13, 2709 9 of 20
of the factorial design experiments and average values for the response variable (PO43−
removal rate) based on the high and low levels of the studied parameters.
Table 3.Design matrix and results of the 23factorial design for PO43−removal by IL-PP.
Run pH (A) Adsorbent
Dose (B)
Temperature (◦C)
Removal Rate (%)
Standard Deviation
1 1 −1 −1 61.08 2.74
2 −1 1 1 87.5 1.32
3 1 1 −1 90 2.5
4 −1 1 −1 81.66 2.93
5 −1 −1 −1 41.16 3.35
6 1 1 1 90.75 1.75
7 1 −1 1 68.25 2.61
8 −1 −1 1 49.16 2.56
Water 2021, 13, x FOR PEER REVIEW 9 of 20
3.2.3. Factorial Design
The factorial design methodology was used to determine the importance of the three factors (pH, adsorbent dose, and temperature) and their interactions on PO43− removal by IL-PP. Factorial design plots such as plots for the main effects and interactions, Pareto chart, and normal plot for the standardized effects describe the interactive relation be- tween the factors and their levels [59]. This technique investigates all possible combina- tions and verifies the accuracy of the obtained mathematical model through the analysis of variance (ANOVA) to achieve optimum removal of PO43−. Table 3 and Figure 6 present the results of the factorial design experiments and average values for the response vari- able (PO43− removal rate) based on the high and low levels of the studied parameters.
Figure 6. Cube plots for PO43− removal by IL-PP.
Table 3. Design matrix and results of the 23 factorial design for PO43− removal by IL-PP.
Run pH (A) Adsorbent Dose (B)
Temperature
(°C) Removal Rate (%) Standard Deviation
1 1 −1 −1 61.08 2.74
2 −1 1 1 87.5 1.32
3 1 1 −1 90 2.5
4 −1 1 −1 81.66 2.93
5 −1 −1 −1 41.16 3.35
6 1 1 1 90.75 1.75
7 1 −1 1 68.25 2.61
8 −1 −1 1 49.16 2.56
Table 4 presents the main and interaction effects, model coefficients, standard devi- ation of each coefficient, standard errors, Fisher test value (F-value), and probability value (p-value). All of the main effects (pH, adsorbent dosage, temperature, and two- and three-way interactions) were significant at a 5% probability level (p < 0.05). Furthermore, the adjusted square correlation coefficient R2 (adj) had a value of 99.99%, which indicates that the presented model perfectly fit the statistical model [44].
Figure 6.Cube plots for PO43−removal by IL-PP.
Table4presents the main and interaction effects, model coefficients, standard deviation of each coefficient, standard errors, Fisher test value (F-value), and probability value (p- value). All of the main effects (pH, adsorbent dosage, temperature, and two- and three-way interactions) were significant at a 5% probability level (p< 0.05). Furthermore, the adjusted square correlation coefficient R2(adj) had a value of 99.99%, which indicates that the presented model perfectly fit the statistical model [44].
Table 4.Estimated effects and coefficients for PO43−removal by IL-PP.
Term Effect Coef SE Coef T-Value p-Value VIF
Constant 71.1979 0.0276 2583.39 0.000
pH 12.6458 6.3229 0.0276 229.42 0.000 1.00
Adsorbent dose 32.5625 16.2813 0.0276 229.42 0.000 1.00
Temperature 5.4375 2.7188 0.0276 590.76 0.000 1.00
pH×Adsorbent dose −6.8542 −3.4271 0.0276 −124.35 0.000 1.00
pH×Temperature −1.4792 −0.7396 0.0276 −26.84 0.000 1.00
Adsorbent dose×Temperature −2.1458 −1.0729 0.0276 −38.93 0.000 1.00 pH×Adsorbent dose×
Temperature −1.0625 −0.5312 0.0276 −19.28 0.000 1.00
S 0.135015
R2 100.00%
R2(Adj) 99.99%
R2(Pred) 99.99%
Water2021,13, 2709 10 of 20
Model for PO43−removal by IL-PP can be expressed using Equation (7):
PO4−3removal % =−72.00+5.583 A+0.92688 B+0.4250 C−0.0209A·B+0.06389A·C −0.000042 B·C
−0.000708 A·B·C (7)
where A is the pH, B is the adsorbent dose, and C is the temperature; AB, AC, and BC represent the two-way interactions; and ABC represents the three-way interaction.
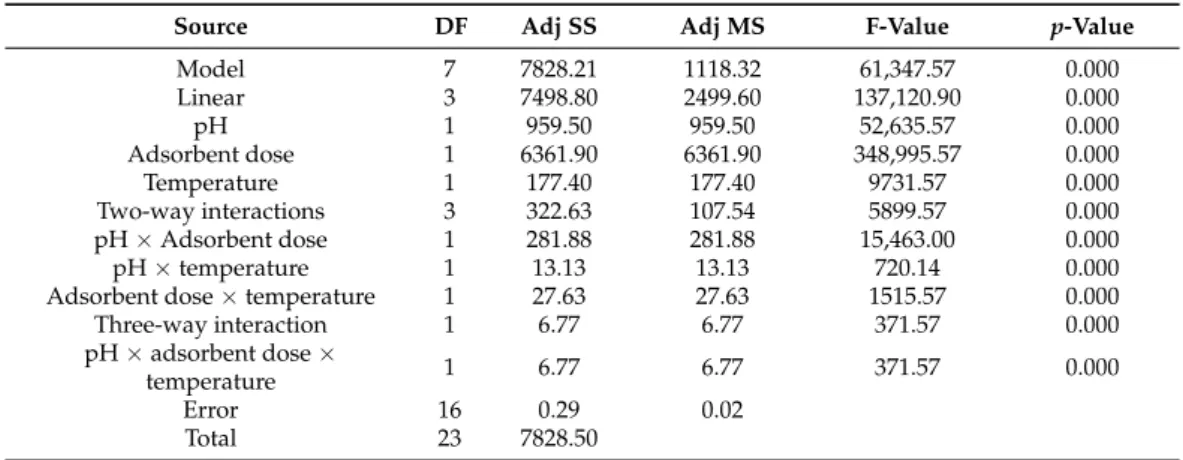
Equation (7) describes how the experimental parameters and their interactions in- fluence the response variable and thus can be used to predict responses for given levels of each parameter [60]. Positive values in the equation indicate that the PO43−removal increases when this effect increases. By contrast, negative values indicate that the removal rate decreases when this effect increases [59]. An analysis of variance was performed to investigate the significance of parameters affecting PO43−removal to ensure the accuracy of the model. Table5presents the sum of the squares used to estimate the effect of factors, the F-ratio (i.e., the ratio of individual mean square effects to the mean square error) and thep-value (i.e., the level of significance leading to the rejection of the null hypothesis).
The results showed that the main effects of each factor, their two-way interactions, and the three-way interaction were statistically significant atp< 0.05.
Table 5.Analysis of variance for PO43−removal by IL-PP.
Source DF Adj SS Adj MS F-Value p-Value
Model 7 7828.21 1118.32 61,347.57 0.000
Linear 3 7498.80 2499.60 137,120.90 0.000
pH 1 959.50 959.50 52,635.57 0.000
Adsorbent dose 1 6361.90 6361.90 348,995.57 0.000
Temperature 1 177.40 177.40 9731.57 0.000
Two-way interactions 3 322.63 107.54 5899.57 0.000
pH×Adsorbent dose 1 281.88 281.88 15,463.00 0.000
pH×temperature 1 13.13 13.13 720.14 0.000
Adsorbent dose×temperature 1 27.63 27.63 1515.57 0.000
Three-way interaction 1 6.77 6.77 371.57 0.000
pH×adsorbent dose×
temperature 1 6.77 6.77 371.57 0.000
Error 16 0.29 0.02
Total 23 7828.50
Figure7shows the main effects of each parameter on PO43− removal by IL-PP by giving the deviations between high and low levels of each parameter, which can help with identifying which parameters affect the response variable the most. A larger deviation is synonymous with a large effect [61]. The adsorbent dose appears to have the greatest effect on PO43−removal by IL-PP, which is followed by pH and then temperature, which had an almost negligible effect.
Figure8plots the interactions of the studied parameters. If the interaction lines are not parallel, this implies that the interaction has a strong effect, whereas parallel interaction lines indicate a weak effect [62]. The most important interaction for PO43−
removal by IL-PP appears to be pH*adsorbent dose, which is followed by adsorbent dose*temperature. The least important interaction was pH*temperature, which had almost parallel interaction lines.
Water2021,13, 2709 11 of 20
Water 2021, 13, x FOR PEER REVIEW 11 of 20
Figure 7 shows the main effects of each parameter on PO43− removal by IL-PP by giving the deviations between high and low levels of each parameter, which can help with identifying which parameters affect the response variable the most. A larger devia- tion is synonymous with a large effect [61]. The adsorbent dose appears to have the greatest effect on PO43− removal by IL-PP, which is followed by pH and then temperature, which had an almost negligible effect.
Figure 8 plots the interactions of the studied parameters. If the interaction lines are not parallel, this implies that the interaction has a strong effect, whereas parallel interac- tion lines indicate a weak effect [62]. The most important interaction for PO43− removal by IL-PP appears to be pH*adsorbent dose, which is followed by adsorbent dose*temperature. The least important interaction was pH*temperature, which had al- most parallel interaction lines.
Figure 7. Plots for the main effects of PO43− removal by IL-PP.
Figure 8. Plots for the interactions due to PO43− removal by IL-PP (%).
Figure 7.Plots for the main effects of PO43−removal by IL-PP.
Water 2021, 13, x FOR PEER REVIEW 11 of 20
Figure 7 shows the main effects of each parameter on PO43− removal by IL-PP by giving the deviations between high and low levels of each parameter, which can help with identifying which parameters affect the response variable the most. A larger devia- tion is synonymous with a large effect [61]. The adsorbent dose appears to have the greatest effect on PO43− removal by IL-PP, which is followed by pH and then temperature, which had an almost negligible effect.
Figure 8 plots the interactions of the studied parameters. If the interaction lines are not parallel, this implies that the interaction has a strong effect, whereas parallel interac- tion lines indicate a weak effect [62]. The most important interaction for PO43− removal by IL-PP appears to be pH*adsorbent dose, which is followed by adsorbent dose*temperature. The least important interaction was pH*temperature, which had al- most parallel interaction lines.
Figure 7. Plots for the main effects of PO43− removal by IL-PP.
Figure 8. Plots for the interactions due to PO43− removal by IL-PP (%).
Figure 8.Plots for the interactions due to PO43−removal by IL-PP (%).
A Pareto chart is helpful for observing the relative importance of the main effects of factors and their interactions. This chart can be used to evaluate the significance of effects on the basis of how much they exceed the reference line [63]. Figure9shows that all parameters and their interactions had a significant effect because their values exceeded that of the reference line (2.1, in red).
Water2021,13, 2709 12 of 20
Water 2021, 13, x FOR PEER REVIEW 12 of 20
A Pareto chart is helpful for observing the relative importance of the main effects of factors and their interactions. This chart can be used to evaluate the significance of effects on the basis of how much they exceed the reference line [63]. Figure 9 shows that all pa- rameters and their interactions had a significant effect because their values exceeded that of the reference line (2.1, in red).
Figure 9. Pareto chart for the standardized effects of PO43− removal by IL-PP.
Figure 10 shows a normal plot of the standardized effects, which was used to iden- tify the “real” effects. Each point on this plot was attributed to an effect. Points far from the reference line likely represent the greatest effect and vice versa [63]. The adsorbent dose (B) had the greatest effect since its point was farthest from the reference line (in red),which followed by pH (A) and their interaction (AB). The adsorbent dose (B) and pH (A) had positive effects because their points are on the right side of the line, whereas their interaction (AB) had a negative effect because it is on the left side [44]. The significance of the effects of the parameters and their interactions can be ordered as follows: B > A > AB >
C > BC > AC > ABC.
Figure 9.Pareto chart for the standardized effects of PO43−removal by IL-PP.
Figure10shows a normal plot of the standardized effects, which was used to identify the “real” effects. Each point on this plot was attributed to an effect. Points far from the reference line likely represent the greatest effect and vice versa [63]. The adsorbent dose (B) had the greatest effect since its point was farthest from the reference line (in red),which followed by pH (A) and their interaction (AB). The adsorbent dose (B) and pH (A) had positive effects because their points are on the right side of the line, whereas their interaction (AB) had a negative effect because it is on the left side [44]. The significance of the effects of the parameters and their interactions can be ordered as follows: B > A > AB >
C > BC > AC > ABC.
Water 2021, 13, x FOR PEER REVIEW 13 of 20
Figure 10. Normal plot for the standardized effects of PO43−removal by IL-PP.
3.3. Process Modeling 3.3.1. Kinetics
Adsorption kinetics represents the progress of the adsorption process over time.
Determining the adsorption kinetics helps with identifying the governing mass transfer mechanism and the characteristic mass transfer parameters [55]. To identify the mecha- nisms and potential rate-controlling step for PO43− adsorption by IL-PP, four kinetic models were examined: the pseudo-first-order, pseudo-second-order, Elovich equation, and intraparticle diffusion models. Equations (8)–(11) respectively present the nonlinear forms of these models:
q = q (1 − e ) (8)
q = q ²k t
1 + k q t (9)
q = 1
βln (1 + αβt) (10)
q = k₃√t + C (11)
where qe and qt are the amounts of PO4-P adsorbed at equilibrium and at time t, respec- tively. k1 (L·min−1), k2 (g·mg−1·min−1), α (mg·g−1·min−1), and k3 (mg·g−1·min−1) are constants of the pseudo-first-order, pseudo-second-order, Elovich equation, and intraparticle dif- fusion models, respectively. β (mg·g−1) is the desorption constant during any one ex- periment, and C is a constant describing the thickness of the boundary layer.
Table 6 gives the adsorption constant of each model as well as the calculated and experimental values of qe (qe,cal and qe,exp, respectively), R2, and χ2.
Figure 10.Normal plot for the standardized effects of PO43−removal by IL-PP.
Water2021,13, 2709 13 of 20
3.3. Process Modeling 3.3.1. Kinetics
Adsorption kinetics represents the progress of the adsorption process over time. De- termining the adsorption kinetics helps with identifying the governing mass transfer mechanism and the characteristic mass transfer parameters [55]. To identify the mech- anisms and potential rate-controlling step for PO43− adsorption by IL-PP, four kinetic models were examined: the pseudo-first-order, pseudo-second-order, Elovich equation, and intraparticle diffusion models. Equations (8)–(11) respectively present the nonlinear forms of these models:
qt= qe
1−e−k1t
(8) qt= qe
2k2t
1+k2qet (9)
qt= 1
βln(1+αβt) (10)
qt= k3√
t+C (11)
where qeand qtare the amounts of PO4-P adsorbed at equilibrium and at time t, respec- tively. k1(L·min−1), k2(g·mg−1·min−1),α(mg·g−1·min−1), and k3(mg·g−1·min−1) are constants of the pseudo-first-order, pseudo-second-order, Elovich equation, and intraparti- cle diffusion models, respectively.β(mg·g−1) is the desorption constant during any one experiment, and C is a constant describing the thickness of the boundary layer.
Table6gives the adsorption constant of each model as well as the calculated and experimental values of qe(qe,caland qe,exp, respectively), R2, andχ2.
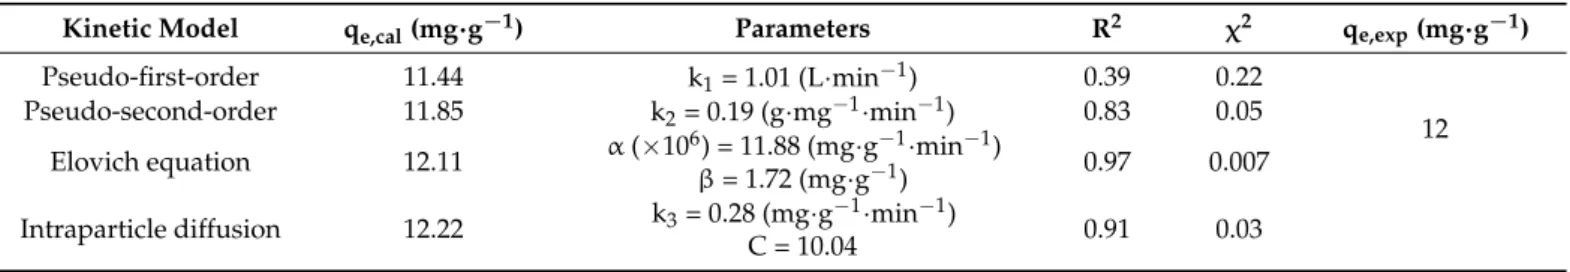
Table 6.Kinetic models and parameters of PO43−adsorption by IL-PP.
Kinetic Model qe,cal(mg·g−1) Parameters R2 χ2 qe,exp(mg·g−1)
Pseudo-first-order 11.44 k1= 1.01 (L·min−1) 0.39 0.22
Pseudo-second-order 11.85 k2= 0.19 (g·mg−1·min−1) 0.83 0.05 12 Elovich equation 12.11 α(×106) = 11.88 (mg·g−1·min−1)
β= 1.72 (mg·g−1) 0.97 0.007 Intraparticle diffusion 12.22 k3= 0.28 (mg·g−1·min−1)
C = 10.04 0.91 0.03
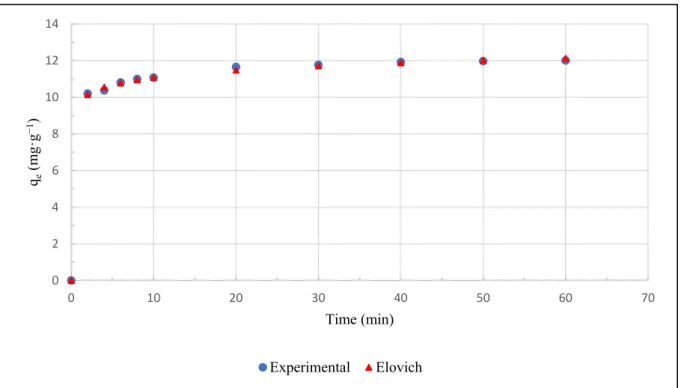
On the basis of the R2andχ2values and comparison between qe,cal and qe,exp, the PO43−adsorption by IL-PP is best described by the Elovich equation (R2= 0.97,χ2= 0.007, qe,cal= 12.11). This kinetic model assumes that the process is controlled by chemisorption and suggests that the adsorbent surface is heterogeneous [64]. The Elovich kinetic model was also postulated by a similar study investigating PO43−adsorption on iron hydroxide–
eggshell waste [65]. Figure11 illustrates the experimental kinetics and Elovich fitting model for PO43−adsorption by IL-PP.
Water2021,13, 2709 14 of 20
Water 2021, 13, x FOR PEER REVIEW 14 of 20
Table 6. Kinetic models and parameters of PO43− adsorption by IL-PP.
Kinetic Model qe,cal (mg·g−1) Parameters R2 χ2 qe,exp (mg·g−1)
Pseudo-first-order 11.44 k1 = 1.01 (L·min−1) 0.39 0.22
12 Pseudo-second-order 11.85 k2 = 0.19 (g·mg−1·min−1) 0.83 0.05
Elovich equation 12.11 α (×106) = 11.88 (mg·g−1·min−1)
β = 1.72 (mg·g−1) 0.97 0.007 Intraparticle diffusion 12.22 k3 = 0.28 (mg·g−1·min−1)
C = 10.04 0.91 0.03
On the basis of the R2 and χ2 values and comparison between qe,cal and qe,exp, the PO43− adsorption by IL-PP is best described by the Elovich equation (R2 = 0.97, χ2 = 0.007, qe,cal = 12.11). This kinetic model assumes that the process is controlled by chemisorption and suggests that the adsorbent surface is heterogeneous [64]. The Elovich kinetic model was also postulated by a similar study investigating PO43− adsorption on iron hydroxide–
eggshell waste [65]. Figure 11 illustrates the experimental kinetics and Elovich fitting model for PO43− adsorption by IL-PP.
Figure 11. Experimental kinetics and Elovich fitting model for PO43− adsorption by IL-PP.
3.3.2. Isotherm
The isotherm is a graph relating qe to Ce at a constant temperature. Determining the adsorption isotherm helps to describe the adsorbent–adsorbate interaction and thus is indispensable for optimizing the adsorption mechanism pathways, expressing the ad- sorbent surface properties and capacity, and effectively designing the adsorption system [66]. The Langmuir and Freundlich models were tested to select the isotherm model that adequately describes PO43− adsorption by IL-PP. The nonlinear forms of these models are presented in Equations (12) and (13), respectively:
q = q K C
1 + K q (12)
q = K C / (13)
0 2 4 6 8 10 12 14
0 10 20 30 40 50 60 70
qe(mg·g−1)
Time (min) Experimental Elovich
Figure 11.Experimental kinetics and Elovich fitting model for PO43−adsorption by IL-PP.
3.3.2. Isotherm
The isotherm is a graph relating qeto Ceat a constant temperature. Determining the adsorption isotherm helps to describe the adsorbent–adsorbate interaction and thus is in- dispensable for optimizing the adsorption mechanism pathways, expressing the adsorbent surface properties and capacity, and effectively designing the adsorption system [66]. The Langmuir and Freundlich models were tested to select the isotherm model that adequately describes PO43−adsorption by IL-PP. The nonlinear forms of these models are presented in Equations (12) and (13), respectively:
qe= qmaxKLCe
1+ KLqe (12)
qe = KFCe1/n (13)
where qe(mg·g−1) is the amount of PO4-P adsorbed at equilibrium and Ce(mg·L−1) is the PO4-P concentration in the liquid phase at equilibrium. KL(L·mg−1) and qmax(mg·g−1) are constants of the Langmuir isotherm and indicate the adsorption energy and adsorption density, respectively. KFand n (dimensionless) are constants of the Freundlich isotherm and indicate the total adsorption capacity and adsorption intensity, respectively. The dimensionless constant RL presents the separation factor and can be calculated using Equation (14):
RL= 1
1+ KLci (14)
where KLis the Langmuir equilibrium constant and Ciis the initial PO4-P concentration.
Similar to the kinetic model, the best fitting isotherm model was selected on the basis of the values of R2andχ2.
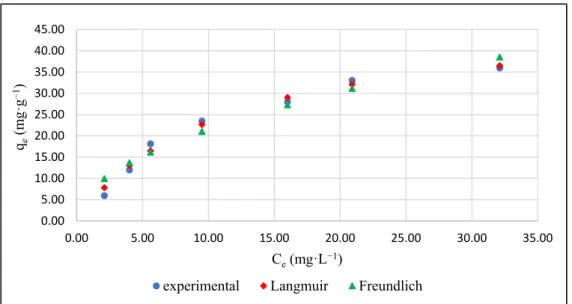
Table7indicates that the PO43−adsorption by IL-PP can be described by both the Langmuir (R2= 0.98,χ2= 0.78) and Freundlich (R2= 0.94,χ2= 2.62) isotherms, but the former fits better. The Langmuir model assumes that adsorption occurs on a homogenous surface through monolayer coverage. Conversely, the Freundlich model assumes that adsorption occurs on a heterogeneous surface through multilayer coverage and that the adsorbed amount increases with the equilibrium concentration [67].
Water2021,13, 2709 15 of 20
Table 7.Isotherm models and parameters of PO43−adsorption by IL-PP.
Isotherm Model Parameters R2 χ2
Langmuir
KL= 0.09 (L·mg−1) qmax= 49.12 (mg·g−1)
RL= 0.21
0.98 0.78
Freundlich KF= 6.88
1/n = 0.49 0.94 2.62
The suitability of both Langmuir and Freundlich models for describing PO43−ad- sorption by IL-PP suggests that active sites are homogeneously and heterogeneously distributed on the IL-PP surface, so more than one mechanism is involved in the adsorption process [68]. The Langmuir separation factor (RL = 0.21) is between 0 and 1, and the Freundlich adsorption affinity constant (n = 2.04) is between 1 and 10, which indicates favorable PO43−adsorption by IL-PP [58]. Figure12shows the experimental isotherm and fitted Langmuir and Freundlich models for PO43−adsorption by IL-PP.
Water 2021, 13, x FOR PEER REVIEW 15 of 20
where qe (mg·g−1) is the amount of PO4-P adsorbed at equilibrium and Ce (mg·L−1) is the PO4-P concentration in the liquid phase at equilibrium. KL (L·mg−1) and qmax (mg·g−1) are constants of the Langmuir isotherm and indicate the adsorption energy and adsorption density, respectively. KF and n (dimensionless) are constants of the Freundlich isotherm and indicate the total adsorption capacity and adsorption intensity, respectively. The dimensionless constant RL presents the separation factor and can be calculated using Equation (14):
R = 1
1 + K c (14)
where KL is the Langmuir equilibrium constant and Ci is the initial PO4-P concentration.
Similar to the kinetic model, the best fitting isotherm model was selected on the basis of the values of R2 and χ2.
Table 7 indicates that the PO43− adsorption by IL-PP can be described by both the Langmuir (R2 = 0.98, χ2 = 0.78) and Freundlich (R2 = 0.94, χ2 = 2.62) isotherms, but the former fits better. The Langmuir model assumes that adsorption occurs on a homoge- nous surface through monolayer coverage. Conversely, the Freundlich model assumes that adsorption occurs on a heterogeneous surface through multilayer coverage and that the adsorbed amount increases with the equilibrium concentration [67].
Table 7. Isotherm models and parameters of PO43− adsorptionby IL-PP.
Isotherm Model Parameters R2 χ2
Langmuir
KL = 0.09 (L·mg−1) qmax = 49.12 (mg·g−1)
RL = 0.21
0.98 0.78
Freundlich KF = 6.88
1/n = 0.49 0.94 2.62
The suitability of both Langmuir and Freundlich models for describing PO43− ad- sorption by IL-PP suggests that active sites are homogeneously and heterogeneously distributed on the IL-PP surface, so more than one mechanism is involved in the adsorp- tion process [68]. The Langmuir separation factor (RL = 0.21) is between 0 and 1, and the Freundlich adsorption affinity constant (n = 2.04) is between 1 and 10, which indicates favorable PO43− adsorption by IL-PP [58]. Figure 12 shows the experimental isotherm and fitted Langmuir and Freundlich models for PO43− adsorption by IL-PP.
Figure 12. Langmuir and Freundlich isotherms fitted to PO43− adsorption by IL-PP.
0.00 5.00 10.00 15.00 20.00 25.00 30.00 35.00 40.00 45.00
0.00 5.00 10.00 15.00 20.00 25.00 30.00 35.00
qe(mg·g−1)
Ce(mg·L−1)
experimental Langmuir Freundlich
Figure 12.Langmuir and Freundlich isotherms fitted to PO43−adsorption by IL-PP.
3.3.3. Thermodynamics
The thermodynamics was studied to determine whether the adsorption process is favorable, spontaneous, exothermic, or endothermic [69]. The change in the Gibbs free energy∆G was calculated using Equation (5), while∆H◦and∆S◦were calculated from the slope and intercept of the plot of ln Kdversus 1/T using Equation (6), as shown in Figure13.
Table8indicates that the value of∆G◦decreased from−19,836.35 to−22,235.05 J·mol−1 when the temperature was increased from 298 to 328 K, which indicates that PO43−
adsorption by IL-PP was spontaneous and favorable. As the temperature was increased, the process became more spontaneous [70]. The positive∆H◦value (4044.59 J·mol−1) indicates that PO43−adsorption by IL-PP is endothermic in nature [71]. The positive∆S◦ value (80.04 J·K−1·mol−1) indicates increased randomness at the solid–solution interface and ion replacement during the adsorption process [72].