Anna CZINKÓCZKY – Ákos BEDE-FAZEKAS
1 Introduction
The need to mitigate to climate change has been in focus for over a decade. The issue was addressed in various forms (ranging from static images to virtual reality 3D models equipped with powerful computer graphics) at different levels aiming to influence all sectors from children to adults, from policy makers to high level academia.
Since the climate change is so complex and fundamentally effects our environment, the issue has to be readdressed over and over at different levels and in a variety of forms to avoid boring repetitions and a novelty sensation helps to keep the awareness at a high level.
In our present paper we would like to use a less known concept of the so called Moesz-line to model the effects of climate change.
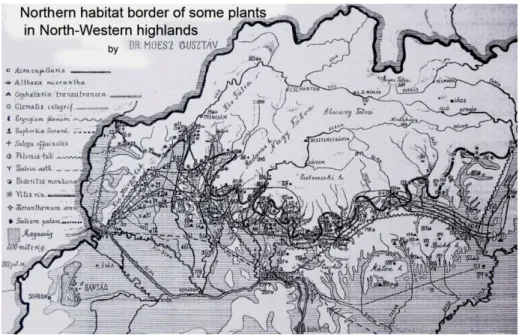
Gusztáv Moesz (1873-1946) was a botanist who was engaged in mycology, museology and obtained an international reputation in these fields. In his main paper which was published more than 100 years ago, he discovered that certain plants share a common northern habitat border and this coincides with the line of vine cultivation. The line represented in Fig. 1 – is the so called Moesz-line – that lies in the territory of Slovakia but at that time belonged to Hungary and is named after him (MOESZ 1911).
Fig. 1. The scanned original map of the 12 taxa and the vine cultivation area (MOESZ 1911, with translating and some retouching). The hard-to-perceive map has only a historical importance nowadays.
2 Materials & Methods
2.1 Background
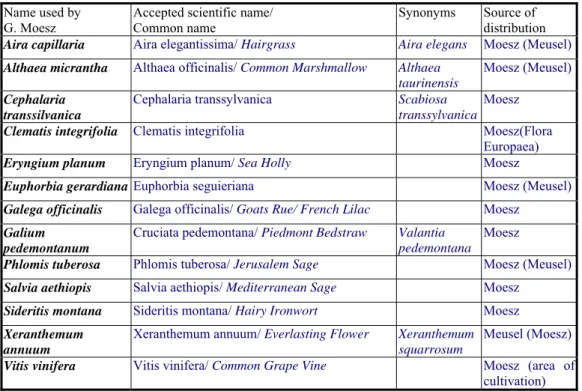
The Moesz-line is seldom used in international scientific publications due to its local importance. However, extending the northern cultivation line of grape to the East and to the West, one can obtain the extension of the Moesz-line, and it will still coincide the northern habitat border of some other species such as Grape Hyacinth (Muscari botryoides, SOMLYAY 2003). Hence, the Moesz-line modelling has an importance for the entire Central European region since it includes species outside of the Carpathian Basin. Originally Moesz included 12 plants in the habitat-observation in addition to the grape cultivation (Vitis vinifera). Table 1. shows the original names of the plants that were investigated by Moesz together with their current scientific names and the sources of the habitat maps (MOESZ 1911, MEUSEL 1965, TUTIN 1964, EUFORGEN 2009).
Table 1. The list of the 12+1 species originally used for drawing the Moesz-line with the source of the distributional map used in our research
Name used by G. Moesz
Accepted scientific name/
Common name
Synonyms Source of distribution Aira capillaria Aira elegantissima/ Hairgrass Aira elegans Moesz (Meusel) Althaea micrantha Althaea officinalis/ Common Marshmallow Althaea
taurinensis
Moesz (Meusel)
Cephalaria transsilvanica
Cephalaria transsylvanica Scabiosa transsylvanica
Moesz
Clematis integrifolia Clematis integrifolia Moesz(Flora
Europaea)
Eryngium planum Eryngium planum/ Sea Holly Moesz
Euphorbia gerardiana Euphorbia seguieriana Moesz (Meusel)
Galega officinalis Galega officinalis/ Goats Rue/ French Lilac Moesz Galium
pedemontanum
Cruciata pedemontana/ Piedmont Bedstraw Valantia pedemontana
Moesz
Phlomis tuberosa Phlomis tuberosa/ Jerusalem Sage Moesz (Meusel) Salvia aethiopis Salvia aethiopis/ Mediterranean Sage Moesz Sideritis montana Sideritis montana/ Hairy Ironwort Moesz Xeranthemum
annuum
Xeranthemum annuum/ Everlasting Flower Xeranthemum squarrosum
Meusel (Moesz)
Vitis vinifera Vitis vinifera/ Common Grape Vine Moesz (area of cultivation) For the landscape design the importance of the Moesz-line lies – not mainly in the investigation of the original 12 plants – but in the fact that Moesz-line shows the habitat area of the vine cultivation which plays a key role in agriculture. Moreover, Moesz-line also demonstrates the northern border of some other important species that have been added later to this concept. Among these are the Chestnut (Castanea sativa, BARTHA 2007),
Pubescent Oak (Quercus pubescens, CSAPODY 1932, KÁRPÁTI 1958, KÉZDY 2001, BARTHA
2002), Bladder Senna (Colutea arborescens, CSIKY 2003), Service Tree (Sorbus domestica, VÉGVÁRI 2000), and some pear species (Pyrus magyarica, Pyrus nivalis ssp. orientalis, Pyrus pannonica, Pyrus slavonica, TERPÓ 1992). The species besides the previous ones that still have a significant application in landcape design are Tatar Maple (Acer tataricum), Smoke Tree (Cotinus coggygria), Manna Ash (Fraxinus ornus), Mahalab Cherry (Prunus mahaleb) and Turkey Oak (Quercus cerris). For the landscape practitioners the following plants have less importance: Grape Hyacinth (Muscari botryoides), Monkey Orchid (Orchis simia), Vetch (Vicia sparsiflora) and Wild Grape (Vitis sylvestris). In our research the distribution of Smoke Tree, Manna Ash, Turkey Oak and Wild Grape were modeled based on the maps of Meusel, and the cultivation area of Chestnut was obtained using the EUFORGEN digital database.
According to the global climate-change models, the weather in the Carpathian basin will become warmer and drier, and the extreme precipitation is expected to occur in the hotter period of the year (BARTHOLY 2008). This will bring a very challenging situation for the landscape designers who have to face and be prepared to deal with this issue well in advance. The landscape designers can slightly change the macroclimate, they can chiefly adapt to it and modify the microclimate. So the emphasis has to be put on the proper adaptation. To implement the best adaptation policy, it is essential to know the expected climate of a future period. In case of the landscape designers, horticulturists and dendrologists in means that they have to know the expected natural vegetation and possible adaptations. For some larger plants (trees), the development and growing period is approx.
30 years, so it is high time that we addressed this issue with some easy-to-understand but effective visualization technique to help the landscape designers in optimal plant selection for expected future climate. Such visualizations are essentials for experts who can further influence the urban planners, authorities and general public (SHEPPARD 2005). In our research, we will model the shift of the Moesz-line which can be served as an alternative for geographically analogous regions (HORVÁTH 2008a).
2.2 Modelling approach
The expected shift of the so called Moesz-line can be modelled in several ways. Table 2.
contains 3 such possibilities showing advantages and disadvantages of each method.
Table 2. Methods of the Moesz-line modeling used in our research
Name Description Advantage Disadvantage
Line modeling
Modeling the shift of the Moesz- line as the northern border of a fictive distribution
relatively accurate, clear, evident
relatively slow
Distribution modeling
Modeling the shift of the distribution of plants belonging to the Moesz-line and then redrawing the future line
follows the original method of Moesz,
has a complex, detailed result
very slow, subjective
Isotherm modeling
Modeling the shift of the minimum temperature isotherm of January (winter months) correlates with the Moesz-line
fastest of the three methods, there is no need for digitalizing distributions
uses only a few climatic parameter(s) inaccurate, questionable
All 3 models are based on the REMO ENSEMBLES RT3 climate model which contains data of a 25-km horizontal grid cell distribution of Europe (170×190 pixels). The reference period is the data between 1961-1990 and the forecasted periods are – according to one of the IPCC SRES scenarios called ‘A1B’ – the years between 2011-2040 and 2041-2070. The modeling was performed by ArcGIS software.
As a preparation, the original maps of Moesz were digitized and georeferenced, using 20-25 control points (country borders and rivers). For modeling the shift of the habitat-zones, it was necessary to digitize the habitats of each plant, since only the EUFORGEN data contained spatial coordinates. We did not consider the entire habitat regions of plants, only the northern segments of the grids were taken into the account. Since only the northern habitat borders were modeled, this concision did not modify the result. For both methods it was necessary to interpolate the discrete data of the climate model and convert it into continuous functions. Three parameters of the climate model were used are monthly average temperature, monthly minimum temperature and monthly total precipitation.
All the temperature data for 12 months were used. From the precipitation data only the total rainfall in the vegetation period (from April through September) was considered because it was validated by similar models. (Due to the climate change, the precipitation zones would shift to the north with different rates than the temperatures) (BEDE-FAZEKAS 2011).
Since the northern habitat borders was modeled, the minimum temperatures were used (1×24 parameters) together with the upper and lower values of the total rainfall in the vegetation period (2×1 parameters), so altogether 26 different logical conditions had to be fulfilled for a given spatial point to satisfy the climatic conditions. It is summarized in a mathematical formula in the equation below.
(1) In the equation (1) the I(λ) takes the value of 1 if the condition for λ is true, otherwise it takes the value of 0. The symbol r means the reference period, f stands for future period, i is the running variable.
Fig. 2. An example of the distribution modeling (Sideritis montana).
From the individual areas of habitats (Line modeling) we have selected 26 extreme values that belong to all the parameters. (25 minimums, 1 maximum) and we performed the modeling for the two future periods (Fig 2.). This model displays those areas where the plant can find those climatic conditions which are necessary for its existence. Since the original areas were chosen from the real habitat zones, the northern border will give a boundary line for future natural areas of occurrence. We have not dealt with edafic and microclimatic investigations. By modeling the reference period, we wanted to display the difference between the real observations and predictions of the modeling.
In the second type of modeling (Distribution modeling) we have analyzed the possible distribution of the 18 species. The third method, the Isotherm modeling has the closest resemblance to the hardiness zones. In our research however, we have only used the average minimum temperatures of January in each year instead of the absolute minimum temperature of the winter. Most likely that for the submediterranean flora the absolute minimum temperature has a higher importance, but by no means does it describe the proper climatic requirements.
R
ESULTS AND DISCUSSIONSThe result of Line modeling is displayed on Fig. 3. The modeled Moesz-line for the reference period follows the original Moesz-curve which shows a good coherence result regarding the spatial resolution of the model. However, the predicted change of the Moesz- line for the period of 2011-2040 – surprisingly – does not show a great shift to the north.
Moreover, to the east of the line connecting the Slovakian cities of Rimavská Sobota and Tisovec, the Moesz-line is expected to shift slightly to the south in the period of 2011-2040, which is rather unexpected. From the east to Rožňava the original line cannot shift to the north.
Fig. 3. The results of the line modeling zoomed into Slovakia (explained in the text) Nevertheless, in the long run for the period of 2041-2070, the results clearly show the expected shift of the Moesz-line to the north and the line will be transformed to 2 or 3 different sections. First of all, in the Carpathian Mountains it will move to a higher regions
(Fig. 3.) and from the north to the Carpathian Mountains some parts of Poland will belong to this climate zone. As a natural inverse effect, an anti-Moesz-line will be formed that will be bounded from the south by the Carpathians. The results coincide with the modeling of geographically analogue regions (HORVÁTH 2008a).
The southern part of the new Moesz-line (2041-2070) will connect Brno (Czech Republic), Zlín, Trenčín (Slovakia), Zvolen, Lučenec, Kosice, Homenne, Soiva (Ukraine) and Bako (Romania). The northern part of the Moesz-line for the period of 2041-2070 will connect Berlin (Germany), Poznan, Warsaw, Garwolin, Włodawa, Novohrad-Volinszkij (Ukraine) és Bila Cerkva. The anti-Moesz-line will join Dresden (Germany), Gmina Bolesławiec, (Poland), Rybnik, Częstochowa, Krakow and Lviv (Ukraine).
The 2nd method (Distribution modeling) – as it was expected – has resulted in a more detailed shift of the Moesz-line in future. Some species have been separated from the others, the habitats of some species have shifted to the north of the Carpathians as „early”
as 2011-2040 (Althaea officinalis, Galega officinalis, Sideritis montana, Vitis vinifera, Fraxinus ornus, Quercus cerris). The other group of plants (Aira elegantissima , Clematis integrifolia, Cruciata pedemontana, Eryngium planum) expected to shift over the Carpathians between 2041-2070. The rest of the plants have remained only on the southern parts of the Carpathians even between 2041-2070.
Fig. 4. The modeled distribution of the species (gray: 2011-2040, black: 2041-2070), and the redrawn Moesz-lines (explained in the text)
The results are shown on Fig. 4. It can be stated that the 12+1 original plants that determined the Moesz-line have produced a more coherent shift of habitats, than those plants which were later added to the concept of Moesz-line. These habitat zones of latter species such as the Turkey oak (Quercus cerris) and the manna ash (Fraxinus ornus) is expected to shift to the north in the greatest extent, and only these two species will find pass the line of Carpathians continously. In addition to this, one can observe, that most of all the common grape vine (Vitis vinifera) and the mountain tea (Sideritis montana) will follow the northern line obtained by the first method between 2041-2070.
Comparing this to the result of the first method, it can be said that between 2011-2040 the Moesz-line is expected to pass over the Carpathians, although the observed plants will only form some isolated or disconnected habitat zones. On the other hand, the Line modeling method did not predict the future occurrence of the Moesz-line over the Carpathians. The Slovakian segments of modeled line are not displayed separately, since they produce almost identical results with the Line modeling method.
The Isotherm modeling (third method) has produced weaker results than it had been expected.The isotherm corresponding to the average minimum temperature in January (- 3,86 °C) which mostly coincides with the Moesz-line in the reference period, in some segments it has reached over the Carpathians. The position of the curve is not parallel with the mountains, moreover it is perpendicular with the Carpathians. So we can conclude that Isotherm modeling is not very useful for predicting the future shift in vegetation habitat – no matter if we use the winter minimum or a monthly minimum temperature. Due to the above mentioned problems, we do not consider the Isotherm modeling to be a feasible way to predict habitat shift in future.
C
ONCLUSIONWe have shown three different methods to predict the future shift of the Moesz-line due climate change. Table 3. combines the evaluation and comparison of the methods.
Table 3. The evaluation of the methods used in our research
Name Usefulness Gives results according to expectations Line modeling Yes No for 2011-2040; Yes for 2041-2070 Distribution modeling Yes Yes, for both periods
Isotherm modeling Questionable No. It gives a rather different result than we had expected
It can be said that the shift of the line to north is relatively small between 2011-2040, while for the period of 2041-2070 it is more significant and coincides with other studies. Hence, we think that the results could be used in landscape architecture in long term planning. We can observe the expected change of climate in the next 60 years according to the A1B climate scenario.
As an overall conclusion, we can say that the Line modeling and Distribution modeling produced very similar results for 2041-2071. However, for 2011-2040 period only Distribution modeling predicted possible habitat zones for the investigated plants to the north of the Carpathians. In spite of this, the second approach does not yield to significantly more information. Nevertheless, it is rather time consuming and troublesome to model so many different species separately. Hence, the only main reason to use Distribution modeling is the tradition and scientific respect towards Moesz’s works, there seems to be little practical reason. The isotherm modeling produced some doubtful predictions. Hence, we found the first method to be the most effective and reliable. The shortcomings of the methods is that it selects only a few parameters that describe the climate. The further improvement of the modeling could be based on more advanced Statistical Methods (logistic regression, K-means clustering), or Artificial Intelligence (decision trees, neural network algorithms).
A
CKNOWLEDGEMENTSSpecial thanks to Mária Höhn and to Levente Horváth for their assistance. The research was supported by Project TÁMOP-4.2.1/B-09/1/KMR-2010-0005. The ENSEMBLES data used in this work was funded by the EU FP6 Integrated Project ENSEMBLES (Contract number 505539) whose support is gratefully acknowledged.
R
EFERENCESBartha D. (2002): A molyhos tölgyek (Quercus pubescens agg.) botanikai jellemzése.
Erdészeti Lapok 137(1): 7-8
Bartha D. (2007): A szelídgesztenye (Castanea sativa) botanikai jellemzése. Erdészeti Lapok 142(1): 14-16
Bartholy J., Pongrácz R. (2008): Regionális éghajlatváltozás elemzése a Kárpát-medence térségére. In: Harnos Zs., Csete L. Klímaváltozás: környezet – kockázat – társadalom.
Szaktudás Kiadó Ház, Budapest, Hungary
Bede-Fazekas, Á. (2011): Impression of the global climate change on the ornamental plant usage in Hungary. Acta Univ. Sapientiae Agriculture and Environment 3(1):211-220 Csapody V. (1932): Mediterrán elemek a magyar flórában. Dissertation. Szegedi
Tudományegyetem, Szeged, Hungary
Csiky J. (2003): A Nógrád-Gömöri bazaltvidék flórája és vegetációja. Tilia 11(1): 167-301 Euforgen (2009): Distribution map of Chestnut (Castanea sativa). www.euforgen.org Horváth L. (2008a): A földrajzi analógia alkalmazása klímaszcenáriók vizsgálatában. In:
Harnos Zs., Csete L. Klímaváltozás: környezet – kockázat – társadalom. Szaktudás Kiadó Ház, Budapest, Hungary
Horváth L. (2008b): Földrajzi analógia alkalmazása klímaszcenáriók elemzésében és értékelésében. Dissertation. Corvinus University of Budapest, Budapest, Hungary Kárpáti Z. (1958): A természetes növénytakaró és a kertészeti termesztés közti összefüggés
Sopron környékén. Soproni Szemle 12(3): 30-54
Kézdy P. (2001): Taxonómiai vizsgálatok a hazai molyhos tölgy alakkörön (Quercus pubescens s. l.). Dissertation. Nyugat-Magyarországi Egyetem, Sopron, Hungary
Meusel, H., E. J. Jäger, E. Weinert (1965): Vergleichende Chorologie der zentraleuropäischen Flora. Band I. (Text und Karten). Jena: Fischer-Verlag
Moesz G. (1911): Adatok Bars vármegye flórájához. Bot. Közlem. 10(5-6):171-185
Sheppard, S. R. J. (2005): Landscape visualisation and climate change: the potential for influencing perceptions and behaviour. Environmental Science & Policy 8(6):637-654 Somlyay L. (2003): A Muscari botryoides (L.) Mill. hazai alakkörének rendszertani-
chorológiai vizsgálata. Dissertation. Debreceni Egyetem, Debrecen, Hungary
Terpó A. (1992): Pyrus taxa in Hungary, and their practical importance. Thaiszia 2(1):41- 57
Tutin, T. G., N. A. Burges, A. O. Chater, J. R. Edmondson, V. H. Heywood, D. M. Moore, D. H. Valentine, S. M. Walters, D. A. Webb, J. R. Akeroyd, M. E. Newton, R. R. Mill (1964): Flora Europaea. Cambridge University Press, Cambridge, UK
Végvári, Gy. (2000): Sorb apple (Sorbus domestica L.) selection in Hungary. Acta Horticulturae 2000(538):155-158