DOI: 10.1556/606.2018.13.1.7 Vol. 13, No. 1, pp. 77–84 (2018) www.akademiai.com
DETERMINING PCU VALUES IN SIGNALIZED CIRCULAR INTERSECTIONS FOR CERTAIN
VEHICLE TYPES
1 Szabolcs BARNA, 2 Attila KOLLÁR, 3 Gábor SCHUCHMANN
Department of Highway and Railway Engineering, Faculty of Civil Engineering Budapest University of Technology and Economics, MĦegyetem rkp. 3, H-1111 Budapest
Hungary, e-mail: 1barna.szabolcs@epito.bme.hu, 2kollar.attila@epito.bme.hu
3schuchmann.gabor@epito.bme.hu
Received 1 January 2017; accepted 30 October 2017
Abstract: Passenger car unit is an important comparison factor that helps the traffic engineer to describe the impact of heterogeneous traffic flows on the traffic performance of the infrastructure elements, compared to homogenous passenger car flows. The purpose of this study is to determine the passenger car unit value of certain vehicle types (e.g. buses, trucks) in signalized circular intersections. The values defined by the Hungarian standards are based on the weight and type of the vehicles, so it is important to know how these parameters of the vehicles influence the traffic conditions at this unique type of road junction, to be able to conduct a correct capacity calculation. PTV Vissim microscopic simulation program was used to model different traffic volumes and compositions getting by the recommended passenger car unit values for the application, and a proposal for further studies in subject.
Keywords: Passenger car unit, Signalized circular intersection, Microscopic simulation, PTV Vissim
1. Introduction
1.1. Passenger car unit
Traffic performance parameters (e.g. speed, density, delay, headway) are affected by vehicle composition differently. The Passenger Car Unit (PCU) is an important comparison factor that helps the traffic engineer to describe the impact of heterogeneous traffic flows on the traffic of the infrastructure elements, compared to (hypothetical) homogenous passenger car flows. There are many methods for determining values for
intersections (the difference between the junction types lays in the weight values).
For roundabouts:
• Light commercial vehicles (weight up to 3.5 t) - 1.0 PCU;
• Heavy (duty) vehicles (weight over 3.5 t) - 2.0 PCU;
• Articulated (heavy) vehicles - 3.0 PCU.
For signal controlled intersections:
• Light commercial vehicles (weight up to 2.5 t) - 1.0 PCU;
• Heavy (duty) vehicles (weight over 2.5 t) - 2.0 PCU;
• Articulated (heavy) vehicles - 3.0 PCU.
1.3. Signalized circular intersections
Previous studies showed that applying traffic lights in circular intersections (e.g.
roundabouts, traffic circles) has a lot of benefits e.g. increase in safety and capacity, decrease in delays and queue lengths [11]-[13]. This type of road junction provides the highest reachable capacity among the at-grade intersections [14]. The PCU values are based on the weight, size, performance of the vehicles, so it is important to know how different types of the vehicles influence the traffic conditions at this unique type of road junction to be able to conduct a correct capacity calculation for further application.
2. Methodology
The method is based on a previous study [6] that uses VISSIM microscopic simulation program to compare the number of vehicles of different types passing through in the same junction-model. The aim was to find the maximum number of passing vehicles in one hour (peak hour). For that the average delay and the number of passing vehicles in one hour were measured in every simulation run.
2.1. Examined signalized circular intersection model
This study is based on the examination of one four-arm circular intersection (see Fig. 1), modeling different traffic volumes and compositions with different random seed numbers resulting in the recommended peak hour values. The model was made in a PTV VISSIM environment [15].
The modeled junction used three lanes both on approaches and on circulatory sections. Width of the lanes was 3.75 m on approaches and 5 m on the circulatory section. The outer radius of the geometry was 38.5 m.
Fig. 1. Vissim model of the examined circular intersection
The traffic volumes per simulation run were the same on all approaches and values only were changed between two runs. The ratio of the flows of the left, straight and right movements were 1:3:2 in every run, resulting balanced lane use. The desired speed was 50 km/h on all approaches and reduced speed values were applied for the turn movements within the circulatory section.
2.2. Examined vehicle types
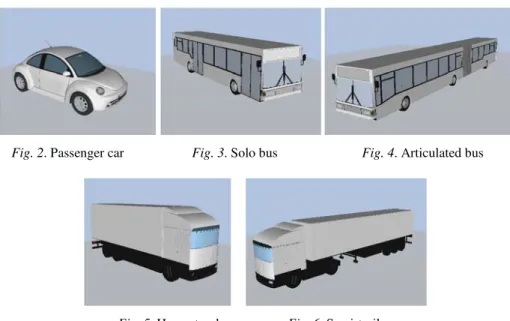
Five different vehicles were used for the simulations, a 4 m long passenger car (see Fig. 2) for the homogenous traffic, a 11.5 m long solo bus (see Fig. 3) and a 18.5 m long articulated bus (see Fig. 4) for the category of buses, a 10.2 m long heavy truck (see Fig. 5) using weight distribution between 12 t and 26 t and power distribution between 150 kW and 300 kW [6] and a 16.0 m long semi-trailer (see Fig. 6) using weight distribution between 20 t and 40 t and power distribution between 300 kW and 600 kW [6] for the category of heavy goods vehicles. Studies on homogenous vehicle type distributions can serve as a basis for simulations with real life values to represent the traffic in case of everyday design problems.
Fig. 2. Passenger car Fig. 3. Solo bus Fig. 4. Articulated bus
meaning the maximum number of vehicles can pass trough the junction is reached, and it will be just a matter of time that the queue length will exceed a critical value (congestion).
Fig. 7. Traffic volume [veh/h] in function of average delay [s]
3. Results
The method used to define the values of PCU is based on the fact that more passenger cars can pass through a certain intersection during a given time interval than heavy vehicles [6]. So, to get a value higher than one, the numbers of different types of vehicles instead of the average times spent in the intersection must be used in equation (1) below
i i
PCU traffic volumeof vechicle type car passenger of
volume traffic
= . (1)
The hundreds of simulation run for the different vehicle types result only between 30 and 50 useable traffic volume data. To increase the accuracy of the result every possible combination was made generating hundreds of PCU values.
3.1. The determined PCU values
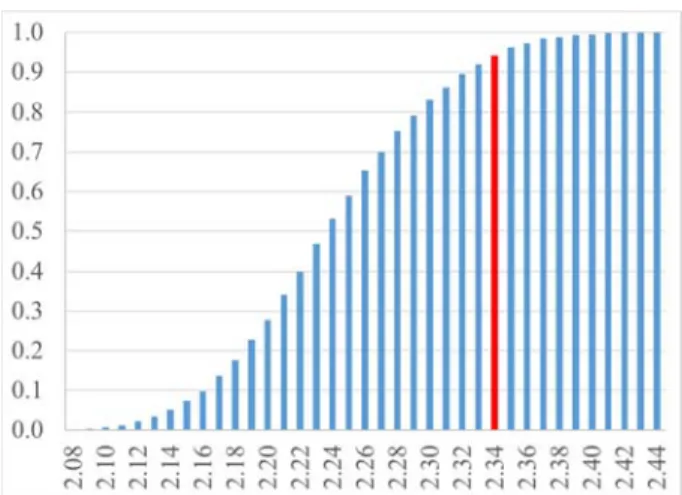
The following charts (see Fig. 8 to Fig. 11) show the cumulative distribution functions of discrete probability distributions of the PCU values. The determined values belong to the 95% confidence level.
Fig. 8. Discrete probability distributions of the PCU value of solo bus
Fig. 9. Discrete probability distributions of the PCU value of articulated bus
The PCU value of solo bus is 2.0 from the Hungarian standards. The value from the simulation is 2.34 (see Fig. 8). It is 17% higher than the recommended value.
The PCU value of articulated bus is 3.0 from the Hungarian standards. The value from the simulation is 3.34 (see Fig. 9). It is 11% higher than the recommended value.
The PCU value of heavy truck is 2.0 from the Hungarian standards. The value from the simulation is 1.83 (see Fig. 10). It is 9% smaller than the recommended value.
Fig. 10. Discrete probability distributions of the PCU value of heavy truck
Fig. 11. Discrete probability distributions of the PCU value of semi-trailer
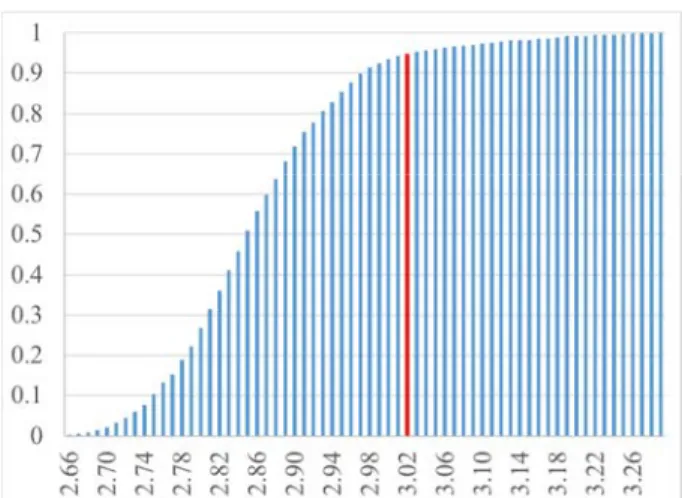
3.2. Impact of the extended turn lanes
The next chart (see Fig. 12) represents the impact of the longer turn lanes. The articulated bus was the longest examined vehicle type (18.5 m) so it was interesting to see what happens when extended right turn lanes are applied. The original 100 m long right turn lanes was extended by 50 m (see Fig. 13) resulted a 3.02 value for the PCU of articulated bus (see Fig. 12). 50% increase in the length of turn lanes made a 10%
decrease in PCU value.
Fig. 12. Discrete probability distributions of the PCU value of articulated bus (extended turn lanes)
Fig. 13. Extended turn lanes geometry
4. Conclusion
In conclusion it is important to mention PCU values of both types of buses from the simulation are higher than standard values but PCU values of both types of heavy goods vehicles from the simulation are lower than standard values. The length of the extra or longer turn lane is a really important factor but there can be another parameters e.g.
speed, acceleration that are recommended for further research, examining their impact on PCU values. These indicate, it is necessary to supervise the present standard PCU values.
Acknowledgements
Authors would like to thank to PTV Group for the research license of VISSIM microsimulation software.
traffic conditions, World Journal of Engineering and Technology, Vol. 4, No. 2, 2016, pp. 153−159.
[3] Tiwari G., Fazio J., Pavitravas S. Passenger car units for heterogeneous traffic using a modified density method, in 4th International Symposium on Highway Capacity, Maui, Hawaii, 27 June - 1 July 2000, pp. 246−257.
[4] Adams C. A., Zambang M. A. M., Opoku-Boahen R. Passenger car unit values for urban mixed traffic flow at signalized intersections on two lane dual carriageways in the Tamale Metropolis, Ghana, International Refereed Journal of Engineering and Science, Vol. 3, No. 4, 2014, pp. 41−49.
[5] Giuffrè O., Grana A., Marino S., Galatioto F. Passenger car equivalent for heavy vehicles crossing turbo-roundabouts, Transportation Research Procedia, Vol. 14, 2016, pp. 4190–4199.
[6] Kollár A. The supervision of passenger car unit values in different types of urban junctions with VISSIM program, Pollack Periodica, Vol. 9, No. 1, 2014, pp. 49−60.
[7] Kollár A. Analyses of vehicle delays at urban and rural road sections, Pollack Periodica, Vol. 9, No. 3, 2014, pp. 15−22.
[8] Praveen P. S., Arasan V. T. Influence of traffic mix on pcu value of vehicles under heterogeneous traffic conditions, International Journal for Traffic and Transport Engineering, Vol. 3, No. 3, 2013, pp. 302–330.
[9] Hungarian Road Society, ÚT 2-1.219:2009, Planning, placing and operating of traffic signal control, Technical Specification, (in Hungarian) 2009.
[10] Hungarian Road Society, ÚT 2-1.206:2010, Design of roundabouts, Technical Specification, (in Hungarian) 2010.
[11] Hallworth M. S. Signaling roundabouts, Traffic Engineering & Control, Vol. 33, No. 6, 1992, pp. 354−363.
[12] Stevens C. R. Signals and meters at roundabouts, in Mid-Continent Transportation Research Symposium, Ames, Iowa, 18-19 August 2005, pp. 1−13, http://www.ctre.
iastate.edu/pubs/midcon2005/StevensRoundabouts.pdf, (last visited 30 December 2016).
[13] Azhar A., Svante B. Signal control of roundabouts, Procedia - Social and Behavioral Sciences, Vol. 16, 2011, pp. 729−738.
[14] Brilon W. Roundabouts: a state of art in Germany, in 4th International Roundabout Conference, TRB 2014, Seattle, USA, 16-18 April 2014, pp. 1−15, http://
teachamerica.com/RAB14/RAB14papers/RAB14ppr045_Brilon.pdf (last visited 30 December 2016).
[15] PTV Group, PTV VISSIM 7 User Manual, Karlsruhe, Germany, 2014.
[16] Maklári J. Adaptive traffic controlled roundabouts, in European Transport Conference, Cambridge, United Kingdom, 9 September 2002, pp. 1−33, http://abstracts.aetransport.org/
paper/index/id/1396/confid/8, (last visited 30 December 2016).
[17] Maklári J. Traffic light controlled roundabouts: traffic performance and parameters of the signal plan (in Hungarian), Innovation and Sustainable Surface Transport, Budapest, Hungary, 4-6 September 2007, http://kitt.uni-obuda.hu/mmaws/2007/download/MJ_
jelzolampas_szabalyozasu_korforgalmak.pdf, (last visited 30 December 2016).
![Fig. 7. Traffic volume [veh/h] in function of average delay [s]](https://thumb-eu.123doks.com/thumbv2/9dokorg/1386271.114750/4.892.221.735.357.649/fig-traffic-volume-veh-h-function-average-delay.webp)