Imaging of the Coronary Arteries and Aortic Root with
Computed Tomography Angiography
Doctoral Thesis Csilla Celeng Semmelweis University Doctoral School of Basic Medicine
Supervisor: Pál Maurovich-Horvat, MD, Ph.D.
Official reviewers: Albert Varga, MD, D.Sc.
Lívia Jánoskúti, MD, Ph.D.
Head of the Final Examination Committee:
Viktor Bérczi, MD, D.Sc.
Members of the Final Examination Committee:
Attila Doros, MD, Ph.D.
László Sallai, MD, Ph.D.
1. INTRODUCTION
In the past years computed tomography angiography (CTA) has become a widely adopted non-invasive imaging technique for the direct visualization of coronary artery disease (CAD). High spatial resolution of current CT scanners allows for detailed anatomical and morphological evaluation of atherosclerotic plaques, while high temporal resolution enables to acquire the fast-moving coronary arteries. In addition the 3-dimensional (3D) nature of CTA provides precise visualization of complex cardiac structures thus aiding in the planning of structural heart interventions such as transcatheter aortic valve implantation (TAVI) as one of the most successful examples.
Cardiac CTA however is a technically demanding procedure and motion artifacts caused by the constant movement of the heart present the chief challenge. Therefore optimized timing of the acquisition window with the least motion is utmost importance to achieve diagnostic image quality.
One option to assess motion-free images is the synchronization of the acquisition window to the phase of the cardiac cycle with minimal coronary arterial motion. Current guidelines report the use of prospectively ECG-triggered image acquisition preferably in the most tranquil period of the cardiac cycle, which at low and stable heart rates (HR) is during mid-diastole (during diastasis) and in patients with high HR is during end-systole.
Another method to achieve favorable image quality is the reduction of HR. In patients undergoing coronary CTA HR should be <65 beats per minute (bpm) and optimally <60 bpm to achieve excellent image quality and low effective radiation dose. Metoprolol is the first-line β-blocker for HR lowering. However, potential contraindications and side-effects (e.g. reactive airway disease, bradycardia, hypotension) might hamper its use in a subset of patients. During coronary CTA, short and effective HR control is desirable; short-lasting intravenous (IV) esmolol therefore might be a good alternative for metoprolol. Currently, esmolol is routinely administered in the intensive care unit for the treatment of acute supraventricular arrhythmias; however, administration before coronary CTA for HR reduction is an “off-label” indication.
Motion-free images are the pre-requisite to assess accurate and reproducible measurements of anatomically complex structures.
Manual adjustments might be time-consuming, with the potential for increased inter-reader and intra-reader variability. Commercially available semi- and fully-automated software algorithms aim to standardize image analysis thus providing reliable measurements, which are critical for clinical and research applications. Computer aided analysis might provide more reproducible measurements, thus reduce the frequency of reader disagreements.
1.1 CTA for the assessment of the coronary arteries
CTA image acquisitions are typically performed during mid-diastole.
However, in patients with higher HR the length of diastole significantly shortens and eventually disappears. Alternatively, the end-systolic phase is the second relatively quiet phase where data acquisition is suitable. The most frequently used approach is the relative delay method, in which the reconstruction starts after a certain delay from the prior wave which is ascribed as a certain percentage of the R-R interval. Another method is the absolute delay method in which reconstruction starts at a fixed time delay before or after the R wave and is ascribed as a specific time delay in milliseconds. Of note, comparisons of the two image reconstruction techniques have been infrequently investigated.
1.2 CTA for the assessment of the aortic root
The aortic root is a complex anatomical structure therefore its 3D imaging is of paramount importance. CTA provides isotropic data, which can be reconstructed in any 3D imaging plane. The annulus is the tightest part of the aortic root and is defined as a virtual ring formed by the 3 lowest points (i.e. hinge points) of the aortic leaflets as they connect to the wall of the LVOT. CTA allows for precise measurement of annulus diameters by manipulating other planes to create a double-oblique plane, which contains the 3 insertions points.
Besides the annulus, diameter of LVOT, sinus of Valsalva, sinotubular junction and ascending aorta can be precisely extracted
2. OBJECTIVES
2.1 Defining the optimal systolic phase targets by using absolute delay
Coronary artery motion and deformation during cardiac cycle lead to significant motion artifacts when velocity of the coronaries exceeds the temporal resolution of the CT scanner. Furthermore, diastolic image acquisition might not be sufficient in patients with higher and/or variable HR. Therefore we aimed to determine the optimal systolic phase targets based on the velocity of the coronary arteries in patients at various HRs by using an absolute reconstruction delay time within the R-R interval.2.2 Defining the efficacy and safety of esmolol vs. metoprolol
Artifact-free images are of importance for the diagnostic assessment of coronary arteries. Therefore adequate premedication of patients with higher HR prior to coronary CTA is recommended. The most common approach is the administration of IV metoprolol, however potential side-effects might hamper its application. Our aim was to investigate whether ultrashort half-life esmolol is at least as efficacious as the standard of care IV metoprolol for HR reduction during coronary CTA. We also sought to estimate the incidence of bradycardia (defined as HR <50 bpm) or hypotension (defined as systolic blood pressure (BP) <100 mm Hg) as an effect of β-blockers in the esmolol and metoprolol groups.
2.3 Defining the heritability of the aortic root by CTA and TTE
2D and 3D imaging of the aortic root often show measurement discrepancies. Therefore, heritability estimates of aortic root dimensions can also vary upon the imaging method. We sought to assess the extent of heritability of the aortic root dimensions with the use of CTA in monozygotic (MZ) and dizygotic (DZ) twins.Furthermore, we aimed to derive transthoracic echocardiography (TTE)-based heritability estimates and compare these with the CTA based results.
3. METHODS
3.1 Study design and study population for optimal systolic phase
This retrospective study consisted of 21 patients (14 men, 7 women;mean age 53.6 years ± 13.1) who were referred for clinically indicated coronary CTA between November 2012 and May 2013 at the Department of Radiology, Massachusetts General Hospital.
Patient selection was based on a clinical decision to target a systolic image reconstruction time interval (from at least 200-420 ms).
Patients were divided into three groups based on mean HR (<65; 65- 80; or >80 bpm).
3.1.1 Coronary artery velocity mapping
Based on coronary segmentation guidelines, six coronary artery landmarks, including the right coronary artery (RCA), first acute marginal branch (AM1), posterior descending artery (PDA), left main coronary artery (LM), first obtuse marginal branch (OM1), and second diagonal branch (D2) were identified. The x, y and z- coordinates of the selected coronary landmark were recorded and were used for the calculation of the 3D route of coronary artery motion by using a previously established method. The velocity of the given landmark was defined as the quotient of the route and the length of the time interval, which was 20 ms. To determine the optimal velocities in each coronary artery segment, the mean values of the minimum velocities were calculated separately for each HR group. The ideal reconstruction times in each HR group were defined as the R-R interval with the lowest minimum mean velocity in a given segment.
A preliminary analysis of 10 patients revealed that the mean lowest coronary artery velocities in each segment occurred in the mid period (280-340 ms) of the selected time interval. Therefore we divided this interval into three sections from: 200-260 ms (early), 280-340 ms (mid) and 360-420 ms (late), to observe if any significant difference existed between the three sections.
3.2 Study design and population for esmolol vs. metoprolol
This study was a randomized single-center non-inferiority phase III clinical trial that compared two IV β-adrenergic receptor blockers to reduce HR in patients who underwent coronary CTA because of suspected CAD between April 2013 and September 2013 at Heart and Vascular Center, Semmelweis University. Subjects who had HR>65 bpm despite oral metoprolol pretreatment were enrolled in the study. Individuals with a HR other than sinus rhythm, any contraindication against β-blocker (asthma bronchiale, chronic obstructive pulmonary disease, any type of documented atrioventricular block, severe aortic valve stenosis, severe left ventricular dysfunction characterized by ejection fraction below 30%), or a systolic BP <100 mm Hg before the coronary CTA scan were excluded from the study. In total, 650 consecutive patients referred to coronary CTA were screened, and of these, 574 patients were eligible to participate in the study. In 162 patients no IV drug was administered because the HR before scan was ≤65 bpm. In total, 412 patients (with HR >65 bpm before the scan) were enrolled and randomized into either esmolol or metoprolol group; 204 patients received IV esmolol and 208 patients received IV metoprolol.
3.2.1 Drug administration protocol and heart rate monitoring
Patients received 50-mg oral metoprolol at arrival if the HR was >65 bpm. If the HR was ≥80 bpm, 100-mg oral metoprolol was administered. The HR was re-evaluated 60 minutes after the oral β- blockade, immediately before the coronary CTA examination.Patients presenting with HR >65 bpm on the CT table were randomized to IV esmolol or IV metoprolol administration. To achieve randomization, we administered esmolol on even weeks and metoprolol on odd weeks in an alternating fashion. The IV metoprolol was titrated in 5-mg doses in every 3 minutes until the target HR (≤65 bpm) or the maximum dose of metoprolol (20 mg) was achieved. The esmolol was diluted to 500 mg/10 mL and titrated in ascending 100-, 200-, 200-mg doses in every 3 minutes until the target HR (≤65 bpm) or the maximum dose of esmolol (500 mg) was achieved. BP was monitored before every administered drug bolus. If hypotension (defined as systolic BP <100 mm Hg) or bradycardia
(defined as HR <50 bpm) was measured, the administration of the β- blocker agent was suspended. The HR was recorded at arrival (T1), immediately before coronary CTA (T2), during breath-hold, contrast injection, and scan (TS), immediately after scan (T3), and 30 minutes after coronary CTA scan (T4). BP was measured at T1, T2, T3, and T4 time points. An adverse event was defined as a change in health condition resulting from the administration of β-blockers, which is not resolving with observation and requires medical intervention.
3.3 Study design and population for heritability of the aortic root
Our study population consisted of 202 twins (61 MZ and 40 DZ same-sex pairs), who were enrolled in the BUDAPEST-GLOBAL (Burden of atherosclerotic plaques study in twins - Genetic Loci and the Burden of Atherosclerotic Lesions) clinical study between April 2013 and July 2014, at Heart and Vascular Center, Semmelweis University. The BUDAPEST-GLOBAL study is a prospective, single-center, classical twin study that sought to evaluate the influence of genetic and environmental factors on the burden of CAD. Participants with self-reported Caucasian ethnic background were enrolled from the Hungarian Twin Registry on a voluntary basis. Two twin pairs were excluded from the CTA analysis due to insufficient image quality (one pair) and withdrawal of study consent (the other pair), while eight twin pairs were excluded from TTE analysis due to the poor quality of the acquired images. In total, 198 twin subjects were analysed by CTA and 186 by TTE. Complete physical examination and anthropometric measurements were performed in all participants, which included the recording of waist circumference, height and weight as well as the calculation of the BMI. Brachial blood pressure values were recorded prior to CTA.Traditional cardiovascular risk factors such as hypertension, diabetes mellitus, dyslipidaemia and smoking habits were collected from patients’ medical history. All participants provided informed consent.
3.3.1 CTA analysis of the aortic root
The following diameters were measured by a single reader: left ventricular outflow tract (LVOT), annulus, sinus of Valsalva, sinotubular junction and ascending aorta. By using a semi-automated software tool modified orientation views similar to those used for TAVI procedures were acquired for the initial evaluation of the aortic root. The axial plane was automatically aligned with the lowest insertion points of the 3 coronary cusps. In case of misalignment manual correction of the insertion points was performed. Based on the annulus-plane diameters of the LVOT, annulus, sinus of Valsalva, sinotubular junction and ascending aorta were obtained by the software. The diameter of a given structure was defined as the mean of the short and long axis. To assess intra-reader reproducibility the same reader performed the previously described measurements in 20 twin pairs. For inter-reader reproducibility, another experienced reader also measured the diameters of the aortic root. All measurements were performed blinded to the zygosity of twins.
3.3.2 TTE imaging of the aortic root
Aortic root measurements were also obtained by two-dimensional TTE by one experienced operator who was blinded to the zygosity of the twins and the CTA exams. Standard two-dimensional protocol was used according to current guidelines. Parasternal long-axis views were acquired to measure the LVOT and aortic root at the level of the annulus, sinus of Valsalva, sinotubular junction and ascending aorta using the inner edge to inner edge method. The LVOT and the annulus were measured in zoom mode. Diameters of the LVOT and annulus were assessed on a mid-systolic frame, all other parameters on end-diastolic frame. To assess intra-reader reproducibility the same reader performed the previously described measurements in 20 twin pairs. For inter-reader reproducibility, another experienced reader also measured the diameters of the aortic root. Inter-modality agreement between CTA and TTE was also calculated.
3.4 Statistical analyses
3.4.1 Sample size calculation for the esmolol vs. metoprolol study
The sample size calculation to determine the efficacy and safety of esmolol was based on prior research, which showed that 83% of patients who received metoprolol premedication achieved a HR of≤65 bpm. The non-inferiority margin was set to 10% because we have assumed that this is a clinically acceptable maximum difference between the responder proportions of the two treatment groups.
Thus, our primary aim to achieve at least 73% responder proportion seemed to be realistic. A total of 595 patients, 297/298 patients on each treatment arm, were needed to find a difference between proportions of responders in metoprolol group vs. esmolol group.
3.4.2 Assessment of heritability estimates
The variation between twins is considered to be a product of additive genetic (A), common environmental (C), dominant genetic (D) and unique environmental (E) factors. Additive genetic effects (A) are perfectly (1.0) correlated across MZ twins and 0.5 correlated across DZ twins. Common environmental effects (C) are perfectly correlated within twin pairs. Unique environmental effects (E) are uncorrelated within co-twins (Figure 1). A univariate genetic structural equation model was fitted to the data, where the variance between twins was decomposed into A, C, D, E latent variables.
These models are commonly referred to as ACE and ADE models.
Figure 1. ACE model P1#
A# C#
E#
P2#
A# C#
E#
SI MI AL RI TY) MZ= 1.0, DZ= 0.5
MZ= DZ=1.0
P(Phenotype#
4. RESULTS
4.1 Optimal systolic phase targets by using absolute delay
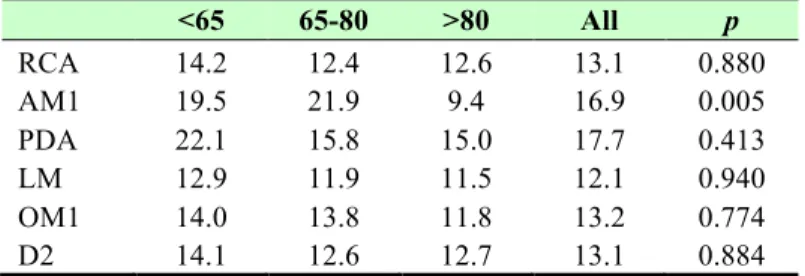
To define the optimal systolic phase targets at patients with various HR, we analyzed a total of 1488 coronary artery landmarks (24 of the various landmark data points were deemed non-evaluable or missing), in 21 patients at 6 locations throughout the coronary artery tree, at 12 time-points throughout the systolic phase reconstructions.Overall, no correlation was found between coronary artery velocities and HR (RCA: r=-0.08, p=0.75; AM1: r=-0.48, p=0.03; PDA: r=- 0.31, p=0.17; LM: r=-0.14; p=0.54; OM1: r=-0.17, p=0.45; D2: r=- 0.16, p=0.48). Table 1 lists the minimal velocities in millimeter/second (mm/s) in each segment for each HR group. No differences were found in the minimal coronary artery velocities between the three HR groups, with the exception of the AM1 branch (p=0.005) between <65 vs. >80 bpm (p=0.03), and at HRs of 65-80 vs. >80 bpm (p=0.006).
Table 1. Minimal velocities across the coronary arteries in mm/s in each HR group
RCA: right coronary artery; AM1: first acute marginal branch; PDA:
posterior descending artery; LM: left main coronary artery; OM1:
first obtuse marginal branch; D2: second diagonal branch
<65 65-80 >80 All p
RCA 14.2 12.4 12.6 13.1 0.880
AM1 19.5 21.9 9.4 16.9 0.005
PDA 22.1 15.8 15.0 17.7 0.413
LM 12.9 11.9 11.5 12.1 0.940
OM1 14.0 13.8 11.8 13.2 0.774
D2 14.1 12.6 12.7 13.1 0.884
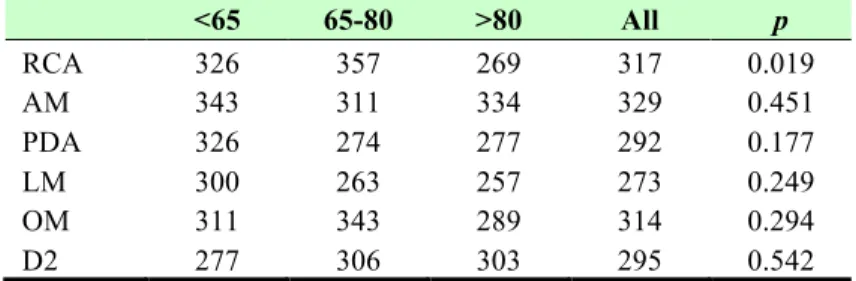
Table 2 shows the optimal systolic phase reconstruction times of the evaluated coronary artery segments in milliseconds (ms). Significant differences in optimal reconstruction time points were detected only in the RCA (p=0.019) between HR of 65-80 bpm vs. >80 bpm.
Table 2. Optimal systolic phase reconstruction time in ms in each HR group
RCA: right coronary artery; AM1: first acute marginal branch; PDA:
posterior descending artery; LM: left main coronary artery; OM1:
first obtuse marginal branch; D2: second diagonal branch
<65 65-80 >80 All p
RCA 326 357 269 317 0.019
AM 343 311 334 329 0.451
PDA 326 274 277 292 0.177
LM 300 263 257 273 0.249
OM 311 343 289 314 0.294
D2 277 306 303 295 0.542
The analysis of all 21 patients’ mean velocities between 200-420 ms revealed that in the mid period, (280-340 ms) in each coronary segment, the mean velocity values were significantly lower (all p<0.005) versus the early and/or late phases of the selected time interval (Figure 2).
4.2 Efficacy and safety of esmolol vs. metoprolol
Patient enrollment was terminated as early as the interim analysis indicated that IV esmolol is clearly non-inferior to IV metoprolol, and in fact, esmolol showed superior characteristics compared to IV metoprolol in reducing HR during coronary CTA. There was no difference between the esmolol and metoprolol group regarding the clinical characteristics of patients (mean age for esmolol group 56.9±10.8 and for metoprolol group 57.6±12.2; 104 and 97 female).
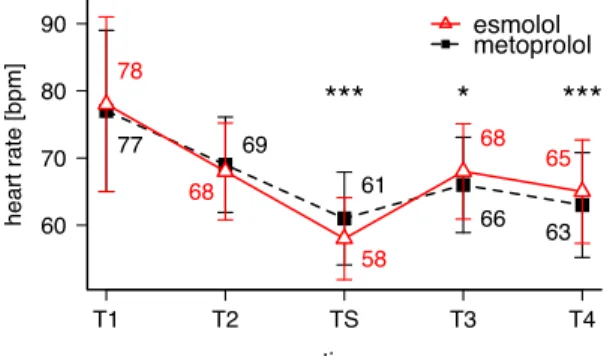
On average, 325.6 ± 158.4 mg IV esmolol and 10.7 ± 6.3 mg IV metoprolol were administered. The mean HR of the esmolol and metoprolol groups was similar at the time of arrival (T1: 78 ± 13 vs.
77 ± 12 bpm; p=0.65) and immediately before the coronary CTA examination (T2: 68 ± 7 vs. 69 ± 7 bpm; p=0.60). However, HR during the scan was significantly lower among the patients who received IV esmolol vs. patients who received IV metoprolol (TS: 58
± 6 vs. 61 ± 7 bpm; p<0.0001). On the other hand, HR immediately after the coronary CTA and 30 minutes after the coronary CTA was higher in the esmolol group than in the metoprolol group (T3: 68 ± 7 vs. 66 ± 7 bpm; p<0.01; and T4: 65 ± 8 vs. 63 ± 8 bpm; p<0.0001, respectively; Figure 3).
Figure 3. Mean HR in the esmolol and metoprolol group
The red triangles represent the mean HR in the esmolol group, whereas the black squares indicate the mean HR in the metoprolol group. T1: time of arrival; T2: time point before the CTA scan; TS:
during the coronary CTA scan; T3: time point immediately after the coronary CTA; T4: 30 minutes after the coronary CTA. *p<0.01;
***p<0.0001.
60 70 80 90
time
heart rate [bpm]
T1 T2 TS T3 T4
78
68
58
68 65
77 69
61
66 63
*** * ***
esmolol metoprolol
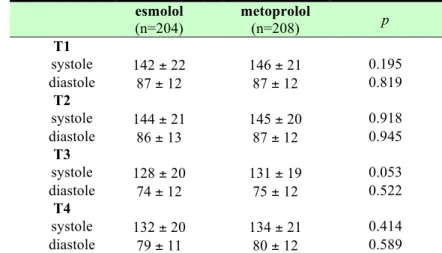
Systolic and diastolic BP showed no difference between the 2 groups measured at any time point (Table 3).
Table 3. Blood pressure in mm Hg in the esmolol and metoprolol group
T1: arrival; T2: before scan; T3: after scan; T4: emission; mean values ± SD
esmolol (n=204)
metoprolol
(n=208) p
T1
systole 142 ± 22 146 ± 21 0.195
diastole 87 ± 12 87 ± 12 0.819
T2
systole 144 ± 21 145 ± 20 0.918
diastole 86 ± 13 87 ± 12 0.945
T3
systole 128 ± 20 131 ± 19 0.053
diastole 74 ± 12 75 ± 12 0.522
T4
systole 132 ± 20 134 ± 21 0.414
diastole 79 ± 11 80 ± 12 0.589
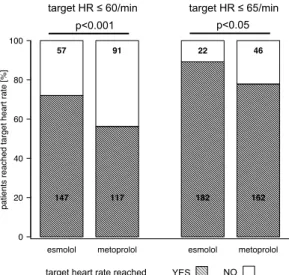
HR of ≤65 bpm was reached in 182 of 204 (89%) patients in the esmolol group vs. in 162 of 208 (78%) patients in the metoprolol group (p<0.05), whereas HR ≤60 bpm was reached in 147 of 204 (72%) patients who received esmolol vs. in 117 of 208 (56%) patients who received metoprolol (p<0.001; Figure 4).
Figure 4. Proportions of patients who achieved the target HR
The bar charts illustrate the proportion of patients who reached a HR
≤60 bpm and the proportion of patients who reached a HR ≤65 bpm in the esmolol and metoprolol groups.
None of the patients developed bradycardia (defined as HR <50 bpm) after β-blocker administration (minimum HR in the esmolol group was 53 bpm; minimum HR in the metoprolol group was 52 bpm). However, hypotension (defined as systolic BP <100 mm Hg) was observed in 19 patients (9.3%) in the esmolol group and in 8 patients (3.8%) in the metoprolol group right after the scan (T3;
p <0.05). Importantly, only 5 patients (2.5%) had a systolic BP <100 mm Hg 30 minutes after the scan (T4) in the esmolol group, whereas the number of patients with hypotension remained 8 (3.8%) in the metoprolol group (p=0.418). None of the patients required hospitalization or medical intervention due to hypotension and the systolic BP normalized after a short (maximum 2 hours) observation in every case. Of note, the absolute time spent in the CT unit (T2-T3) did not differ between the esmolol and metoprolol group (21.1 ± 7.5 vs. 21.8 ± 7.9 minutes; p=0.428).
esmolol metoprolol esmolol metoprolol
patients reached target heart rate [%]
0 20 40 60 80 100
147 57
117 91
182 22
162 46
p<0.001 p<0.05
target HR ≤ 60/min target HR ≤ 65/min
YES NO
target heart rate reached
4.3 Heritability estimates of aortic root dimensions by CTA and TTE
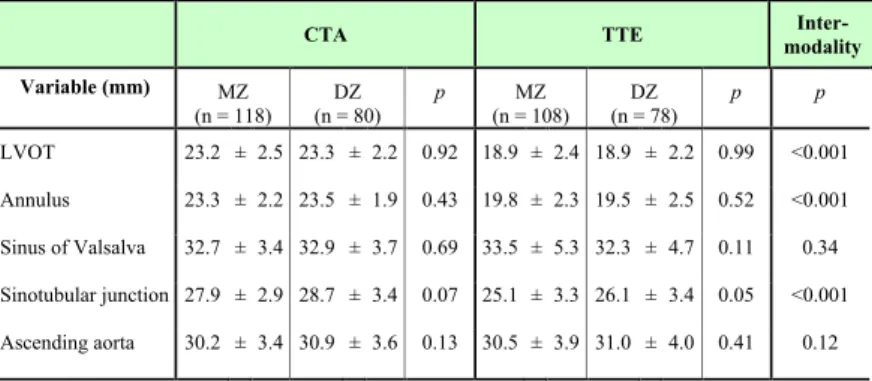
This study consisted of 198 twins (118 MZ, 80 DZ; mean age for MZ 54.5±9.7 and DZ 58.3±8.4 years; 126 female) who prospectively underwent both CTA and TTE. No significant differences were found between MZ and DZ twins except for age (p=0.004). CTA and TTE-derived diameters as well as inter-modality differences are shown in Table 4.Table 4. Aortic root diameter measurements in millimetres (mm) as assessed by CTA and TTE
CTA: computed tomography angiography; TTE: transthoracic echocardiography; LVOT: left ventricular outflow tract
Both CTA- and TTE-measured diameters were similar between MZ and DZ twins. In terms of inter-modality, CTA and TTE-derived parameters were significantly different regarding LVOT, annulus, and sinotubular junction (all p<0.001), however, the diameter of the sinus of Valsalva and ascending aorta were similar (p=0.34; p=0.12, respectively).
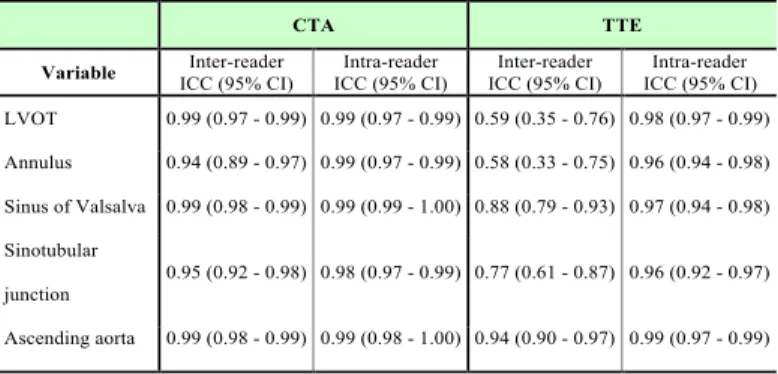
The intra-reader reproducibility of both CTA (range: 0.98-0.99) and TTE (range: 0.96-0.99) was excellent. The inter-reader reproducibility was lower for all aortic measurements using TTE
CTA TTE Inter-
modality Variable (mm) MZ
(n = 118) DZ (n = 80)
p MZ
(n = 108) DZ (n = 78)
p p
LVOT 23.2 ± 2.5 23.3 ± 2.2 0.92 18.9 ± 2.4 18.9 ± 2.2 0.99 <0.001 Annulus 23.3 ± 2.2 23.5 ± 1.9 0.43 19.8 ± 2.3 19.5 ± 2.5 0.52 <0.001 Sinus of Valsalva 32.7 ± 3.4 32.9 ± 3.7 0.69 33.5 ± 5.3 32.3 ± 4.7 0.11 0.34 Sinotubular junction 27.9 ± 2.9 28.7 ± 3.4 0.07 25.1 ± 3.3 26.1 ± 3.4 0.05 <0.001 Ascending aorta 30.2 ± 3.4 30.9 ± 3.6 0.13 30.5 ± 3.9 31.0 ± 4.0 0.41 0.12
Table 5. Inter-reader and intra-reader intraclass correlation coefficient results by imaging modality.
ICC: Intraclass correlation coefficients; CI: confidence interval;
CTA: computed tomography angiography; TTE: transthoracic echocardiography; LVOT: left ventricular outflow tract
Regarding the heritability estimates in case of CTA-based measurements, AE models were most parsimonious, which suggests a strong genetic determination of the aortic metrics. TTE-derived measurements showed AE models for ascending aorta and LVOT and CE models for sinotubular junction, sinus of Valsalva and annulus, which suggests moderate to no genetic influence on the aortic root (Figure 5).
Figure 5. Heritability estimates of aortic root parameters using CTA and TTE CTA: computed tomography angiography TTE:
Transthoracic echocardiography A: Additive genetic factors C:
Common environmental factors E: Unique environmental factors;
LVOT: left ventricular outflow tract
CTA TTE
Variable Inter-reader ICC (95% CI)
Intra-reader ICC (95% CI)
Inter-reader ICC (95% CI)
Intra-reader ICC (95% CI) LVOT 0.99 (0.97 - 0.99) 0.99 (0.97 - 0.99) 0.59 (0.35 - 0.76) 0.98 (0.97 - 0.99) Annulus 0.94 (0.89 - 0.97) 0.99 (0.97 - 0.99) 0.58 (0.33 - 0.75) 0.96 (0.94 - 0.98) Sinus of Valsalva 0.99 (0.98 - 0.99) 0.99 (0.99 - 1.00) 0.88 (0.79 - 0.93) 0.97 (0.94 - 0.98) Sinotubular
junction
0.95 (0.92 - 0.98) 0.98 (0.97 - 0.99) 0.77 (0.61 - 0.87) 0.96 (0.92 - 0.97)
Ascending aorta 0.99 (0.98 - 0.99) 0.99 (0.98 - 1.00) 0.94 (0.90 - 0.97) 0.99 (0.97 - 0.99)
0.0 0.5 1.0
LVOT Annulus Sinus of Valsalva Sinutubular junction
Ascending aorta A
E
Proportion of heritability CTA-based heritability estimates
0.0 0.5 1.0
LVOT Annulus Sinus of Valsalva Sinutubular junction
Ascending aorta A
C E
Proportion of heritability TTE-based heritability estimates
5. CONCLUSIONS
CTA is a technically demanding procedure, and motion artifacts present the chief challenge unique to ECG-gated coronary CTA.
Diagnostic image quality can be achieved by synchronizing the acquisition window to the phase of the cardiac cycle with minimal coronary arterial motion. Coronary CTA image acquisitions are typically performed in the most quiescent period of the cardiac cycle, which at low and stable HR is during mid-diastole. However, in patients with higher HR, the end-systolic and early-diastolic reconstructions are more favorable. In our study we found that during an absolute delay of 200-420 ms after the R-wave, the ideal reconstruction interval varies significantly among coronary artery segments. Decreased coronary artery velocities occur between 280 to 340 ms of the cardiac cycle. Therefore a narrow range of systolic intervals, rather than a single phase should be acquired.
Coronary CTA is an established tool to rule out CAD. Diagnostic accuracy of coronary CTA is highly dependent on patients' HR.
Despite widespread use of β-blockers before coronary CTA, only few studies have compared various agents used to achieve adequate HR control. In our study we sought to assess whether the ultrashort- acting β-blocker IV esmolol is at least as efficacious as the standard of care IV metoprolol for HR control during coronary CTA. Our results suggest that IV esmolol with a stepwise bolus administration protocol is at least as efficacious as the standard of care IV metoprolol for HR control in patients who undergo coronary CTA.
Heritability plays an important role in the configuration of the aortic root. Previous heritability studies of the aortic root used TTE for the assessment of aortic root dimensions and showed weak to moderate heritability. CTA might enable more accurate measurements and better estimation of heritability. In our study we showed that CTA- derived metrics resulted in stronger heritability of the aortic root, as compared to TTE-derived measurements. These results suggest that
6. BIBLIOGRAPHY OF THE CANDIDATE'S PUBLICATIONS 6.1 Publications closely related to the present thesis
1. Celeng C, Vadvala H, Puchner S, Pursnani A, Sharma U, Kovacs A, Maurovich-Horvat P, Hoffmann U, Ghoshhajra B.
(2016) Defining the optimal systolic phase targets using absolute delay time for reconstructions in dual-source coronary CT angiography. Int J Cardiovasc Imaging, 32: 91-100.
IF: 1.880 2. Celeng C, Kolossvary M, Kovacs A, Molnar AA, Szilveszter B, Horvath T, Karolyi M, Jermendy AL, Tarnoki AD, Tarnoki DL, Karady J, Voros S, Jermendy G, Merkely B, Maurovich-Horvat P. (2016) Aortic root dimensions are predominantly determined by genetic factors: a classical twin study. Eur Radiol. In press
IF: 3.640 3. Maurovich-Horvat P, Karolyi M, Horvath T, Szilveszter B, Bartykowszki A, Jermendy AL, Panajotu A, Celeng C, Suhai FI, Major GP, Csobay-Novak C, Huttl K, Merkely B. (2015) Esmolol is noninferior to metoprolol in achieving a target heart rate of 65 beats/min in patients referred to coronary CT angiography: a randomized controlled clinical trial. J Cardiovasc Comput Tomogr, 9: 139-145. IF: 2.472
6.2 Publications not related to the present thesis
1. Celeng C, Takx RA, Ferencik M, Maurovich-Horvat P. (2016) Non-invasive and invasive imaging of vulnerable coronary plaque. Trends Cardiovasc Med, 26: 538-547. IF: 3.075 2. Celeng C, Maurovich-Horvat P, Ghoshhajra BB, Merkely B,
Leiner T, Takx RA. (2016) Prognostic Value of Coronary Computed Tomography Angiography in Patients With Diabetes:
A Meta-analysis. Diabetes Care, 39: 1274-1280. IF: 8.934
3. Kovacs A, Molnar AA, Celeng C, Toth A, Vago H, Apor A, Tarnoki AD, Tarnoki DL, Kosa J, Lakatos P, Voros S, Jermendy G, Merkely B, Maurovich-Horvat P. (2016) Hypertrophic Cardiomyopathy in a Monozygotic Twin Pair:
Similarly Different. Circ Cardiovasc Imaging, 9: 1-7. IF: 5.771 4. Pursnani A, Celeng C, Schlett CL, Mayrhofer T, Zakroysky P, Lee H, Ferencik M, Fleg JL, Bamberg F, Wiviott SD, Truong QA, Udelson JE, Nagurney JT, Hoffmann U. (2016) Use of Coronary Computed Tomographic Angiography Findings to Modify Statin and Aspirin Prescription in Patients With Acute Chest Pain. Am J Cardiol, 117: 319-324. IF: 3.154 5. Szilveszter B, Celeng C, Maurovich-Horvat P. (2016) Plaque
assessment by coronary CT. Int J Cardiovasc Imaging, 32: 161-
172. IF: 1.880
6. Szilveszter B, Elzomor H, Karolyi M, Kolossvary M, Raaijmakers R, Benke K, Celeng C, Bartykowszki A, Bagyura Z, Lux A, Merkely B, Maurovich-Horvat P. (2016) The effect of iterative model reconstruction on coronary artery calcium quantification. Int J Cardiovasc Imaging, 32: 153-160. IF: 1.880 7. Celeng C, Szekely L, Toth A, Denes M, Csobay-Novak C, Bartykowszki A, Karolyi M, Vago H, Szoke S, Coelho Filho OR, Andreka P, Merkely B, Maurovich-Horvat P. (2015) Multimodality Imaging of Giant Right Coronary Aneurysm and Postsurgical Coronary Artery Inflammation. Circulation, 132:
e1-5. IF: 17.202
8. Pursnani A, Schlett CL, Mayrhofer T, Celeng C, Zakroysky P, Bamberg F, Nagurney JT, Truong QA, Hoffmann U. (2015) Potential for coronary CT angiography to tailor medical therapy beyond preventive guideline-based recommendations: insights from the ROMICAT I trial. J Cardiovasc Comput Tomogr, 9:
193-201. IF: 2.472
9. Bartykowszki A, Celeng C, Karolyi M, Maurovich-Horvat P.
(2014) High Risk Features on Coronary CT Angiography. Curr Cardiovasc Imaging Rep, 7: 9279. IF: N/A 10. Ghoshhajra BB, Lee AM, Engel LC, Celeng C, Kalra MK,
Brady TJ, Hoffmann U, Westra SJ, Abbara S. (2014) Radiation dose reduction in pediatric cardiac computed tomography:
experience from a tertiary medical center. Pediatr Cardiol, 35:
171-179. IF: 1.310
11. Kovacs A, Tapolyai M, Celeng C, Gara E, Faludi M, Berta K, Apor A, Nagy A, Tisler A, Merkely B. (2014) Impact of hemodialysis, left ventricular mass and FGF-23 on myocardial mechanics in end-stage renal disease: a three-dimensional speckle tracking study. Int J Cardiovasc Imaging, 30: 1331-
1337. IF: 1.810
12. Schlett CL, Ferencik M, Celeng C, Maurovich-Horvat P, Scheffel H, Stolzmann P, Do S, Kauczor HU, Alkadhi H, Bamberg F, Hoffmann U. (2013) How to assess non-calcified plaque in CT angiography: delineation methods affect diagnostic accuracy of low-attenuation plaque by CT for lipid- core plaque in histology. Eur Heart J Cardiovasc Imaging, 14:
1099-1105. IF: 3.669
Articles in Hungarian
1. Celeng C, Maurovich-Horvat P, Merkely B. (2015) Akut koronária szindróma prevenciója és kezelése. Metabolizmus, 13:
49-52. IF: N/A