N E U R O P H Y S I O L O G Y
Dissociation of broadband high-frequency activity and neuronal firing in the neocortex
Marcin Leszczyński1,2*, Annamaria Barczak2, Yoshinao Kajikawa2, Istvan Ulbert3, Arnaud Y. Falchier2,4, Idan Tal1,2, Saskia Haegens1,5, Lucia Melloni6,
Robert T. Knight7, Charles E. Schroeder1,2*
Broadband high-frequency activity (BHA; 70 to 150 Hz), also known as “high gamma,” a key analytic signal in human intracranial (electrocorticographic) recordings, is often assumed to reflect local neural firing [multiunit activity (MUA)]. As the precise physiological substrates of BHA are unknown, this assumption remains controversial. Our analysis of laminar multielectrode data from V1 and A1 in monkeys outlines two components of stimulus-evoked BHA distributed across the cortical layers: an “early-deep” and “late-superficial” response. Early-deep BHA has a clear spatial and temporal overlap with MUA. Late-superficial BHA was more prominent and accounted for more of the BHA signal measured near the cortical pial surface. However, its association with local MUA is weak and often undetectable, consistent with the view that it reflects dendritic processes separable from local neuronal firing.
INTRODUCTION
Broadband high-frequency activity (BHA; 70 to 150 Hz), also known as “high gamma,” a key analytic signal in human intracranial record- ings, is often assumed to reflect local neural firing [multiunit activity (MUA)]. Accordingly, BHA has been used to study neuronal popula- tion responses reflecting auditory (1, 2), visual (3–5), language (6), mnemonic (7–10), and cognitive control (11, 12). BHA is arguably the electrophysiological measure best correlated with the blood oxy- genation level–dependent (BOLD) signal in functional magnetic resonance imaging (fMRI) (13, 14). However, beyond the fact that BHA correlates with neuronal spiking (13, 15–17), its precise phys- iology remains unknown; specifically, the neuronal populations and physiological processes generating BHA have not been identified.
Here, we show that BHA can be dissociated from MUA in the pri- mary visual and auditory cortex. Analyzing laminar multielectrode data recorded in monkeys, we found a bimodal distribution of stimulus- evoked BHA across the layers of cortex: an “early-deep” and
“late-superficial” response. The early-deep BHA had a clear spatial (laminar) and temporal association with local MUA; however, the spatiotemporal overlap of MUA with the late-superficial BHA signal was much less clear. In many cases, particularly in V1 (70%), supra- granular sites showed a strong BHA in lieu of any detectable increase in MUA. Because of volume conduction, BHAs from both the early- deep and the late-superficial generators contribute to the field poten- tial (FP) at the pial surface, but the contribution is weighted toward the superficial BHA. Although both BHA components volume con- duct to the pial surface, the strongest generators of BHA are in the
superficial cortical layers. The origins of BHA include a mixture of the neuronal action potential firing and dendritic processes separable from firing. It is likely that, as typically recorded, BHA signals empha- size the latter processes to a greater extent than previously recognized.
RESULTS
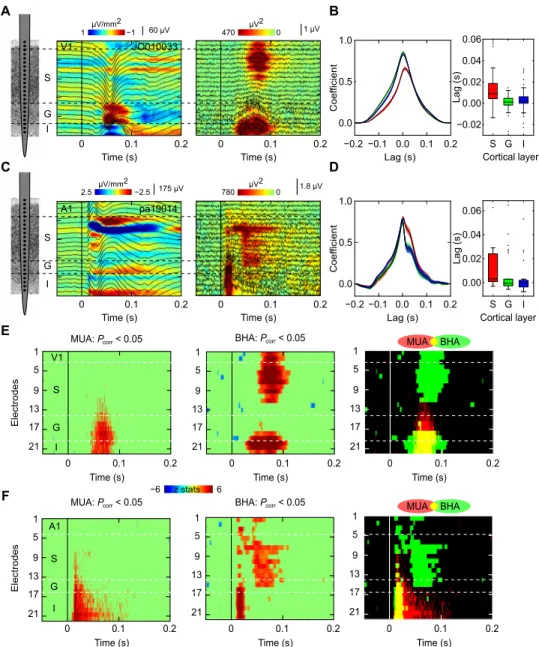
Two BHA components: Early deep and late superficial We investigated the neural mechanisms generating BHA signal and their relationship to MUA in the neocortex by analyzing FP and concomitant MUA signals recorded with laminar multielectrodes in macaque primary visual (V1: two animals, 104 experimental ses- sions with whole-screen flashes, 49 sessions with free viewing) and auditory (A1: two animals, 26 experimental sessions with broadband noise, 26 sessions with best frequency tone) cortices. We used first and second derivative (current source density or “CSD”) analyses of the laminar FP profiles, along with a concomitant MUA to localize the neuronal generators of BHA and to determine their spatiotemporal relationship to neuronal firing. Figure 1 displays representative laminar activity profiles recorded from primary visual (Fig. 1, A, B, and E) and auditory (Fig. 1, C, D, and F) cortices. The notion that BHA di- rectly reflects neuronal firing raises the obvious prediction that BHA and MUA should have the same spatial and temporal distributions across cortical layers. Contrary to this prediction, however, the spa- tiotemporal profiles of BHA and MUA were reliably different. We observed two temporally and spatially distinct BHA components, in- cluding the early-deep BHA localized to the granular and infragranular layers and the late-superficial BHA observed in the supragranular layers (Fig. 1, E and F). Early-deep BHA had clear spatiotemporal overlap with granular and infragranular MUA. However, the spatio- temporal association between late-superficial BHA and MUA was much less clear. Late-superficial BHA often had little or no MUA concomitant, particularly in V1.
Consistent with earlier work (13, 15–17), we found that MUA and BHA were correlated at all cortical depths in both V1 and A1 (all Spearman’s rho, >0.76; all P < 0.01). We used cross-correlation between BHA and MUA at supragranular, granular, and infragranular layers to test whether the relation between these two signals changes across cortical depth. The cross-correlation coefficient profiles were
1Cognitive Science and Neuromodulation Program, Departments of Psychiatry, Neurology and Neurosurgery, Columbia University College of Physicians and Surgeons, New York, NY, USA. 2Translational Neuroscience Division of the Center for Biomedical Imaging and Neuromodulation, Nathan Kline Institute, Orangeburg, NY, USA. 3Insti- tute for Cognitive Neuroscience and Psychology, Research Centre for Natural Sciences, Hungarian Academy of Sciences, Budapest, Hungary. 4Department of Psychiatry, NYU Grossman School of Medicine, New York, NY, USA. 5Donders Institute for Brain, Cognition and Behaviour, Radboud University Nijmegen, Nijmegen, Netherlands.
6Department of Neurology, New York University Langone Health, New York, NY, USA.
7Department of Psychology and Helen Wills Neuroscience Institute, University of California at Berkeley, Berkeley, CA, USA.
*Corresponding author. Email: leszczynski.marcin@gmail.com (M.L.); cs2388@
columbia.edu (C.E.S.)
Copyright © 2020 The Authors, some rights reserved;
exclusive licensee American Association for the Advancement of Science. No claim to original U.S. Government Works. Distributed under a Creative Commons Attribution NonCommercial License 4.0 (CC BY-NC).
on January 3, 2021http://advances.sciencemag.org/Downloaded from
nonuniform across layers (Fig. 1, B and D). Specifically, the coeffi- cients in the supragranular layers peaked later, relative to those in deeper layers [median lags in V1 supragranular, granular, and in- fragranular layers were 9, 1, and 2.5 ms; while median lags in A1 supragranular, granular, and infragranular layers were 3.25, −0.5, and −0.25 ms; both Kruskal-Wallis (KW) tests, P < 0.01; Fig. 1, B and D].
This suggests that the relationship between BHA and MUA might vary rather than being constant across cortical depth. To understand this divergence, we quantified the laminar/temporal distributions of
both signals, which confirmed the above impressions about the chang- ing association between BHA and MUA across cortical depth.
Distinct laminar and temporal distributions of early-deep and late-superficial BHA
We tested laminar distributions of BHA and MUA across four dif- ferent experiments in two cortical areas, V1 and A1. First, we used diffused light flash stimulation (V1-DF), which weakly activates the supragranular layers of V1 relative to patterned stimulation (18);
Time (s) Time (s) Time (s)
Time (s)
0 0.1 0.2
JO010033
G S
I
60 µV 1 µV/mm2 −1
Time (s)
0 0.1 0.2
1 µV
0 0.1 0.2
Time (s) pa19014 2.5 µV/mm2 −2.5 175 µV
G S
I
Time (s)
0 0.1 0.2
1.8 µV 0 µV2
8
7 0
A
C
E
F
0.06 0.04 0.02 0.00
Lag (s)
Cortical layerS G I 1.0
Lag (s) 0.5
0.0
−0.2 −0.1 0.0 0.1 0.2
Coefficient
D
0.06 0.04 0.02
Lag (s)0.00
−0.02 0.5
0.0
Coefficient
1.0
Lag (s)
−0.2 −0.1 0.0 0.1 0.2
Cortical layerS G I
B
V1
A1
MUA: Pcorr < 0.05
0 0.1 0.2
Time (s)
0 0.1 0.2
Time (s) 1
5 9 13 17 21
BHA: Pcorr < 0.05
0 0.1 0.2
Time (s) 1
5 9 13 17 21
Electrodes
1 5 9 13 17 21
0 0.1 0.2 0 0.1 0.2
1 5 9 13 17 21
0 0.1 0.2
1 5 9 13 17 21 BHA: Pcorr < 0.05
MUA: Pcorr < 0.05 MUA BHA
BHA MUA
−6 z stats 6
Electrodes
1 5 9 13 17 21
V1
A1 G S
I
G S
I
0 µV2 7
4 0
Fig. 1. Laminar activity profiles from individual penetrations in V1 and A1. Color maps show a CSD superimposed with FPs (left) and a BHA (color map) superimposed with MUA (line plots) profiles (right) in V1 (A) and A1 (C) from a representative session. (A) presents data from V1 recordings during diffuse flash stimulation. (C) shows data from A1 recordings during presentation of broadband noise (100-ms duration). x axes indicate time relative to stimulus onset. y axes represent cortical depth with increasing numbers from superficial to deep layers. Vertical lines indicate sensory events. (B and D) Line plots show the distribution of MUA-BHA cross-correlation coeffi- cients calculated across trials for each penetration of V1 (B) and A1 (D). Box plot presents distribution of the lags obtained from the cross-correlations. Positive values in- dicate that MUA leads BHA. Shading in the line plot reflects SEM. Central mark and edges in box plots show median and 25th and 75th percentiles. (E and F) show maps of z statistics calculated across trials (n = 137 and 84) for individual V1 (E) and A1 (F) penetration. The statistics values are obtained from a nonparametric pairwise test on MUA (left) and BHA (middle) relative to the prestimulus baseline. Nonsignificant time points are masked (P < 0.05; controlled for multiple comparisons across channels and time with the Benjamini and Yekutieli procedure). Right panels show an overlap (yellow) between the BHA (green) and MUA (red) statistic masks.
on January 3, 2021http://advances.sciencemag.org/Downloaded from
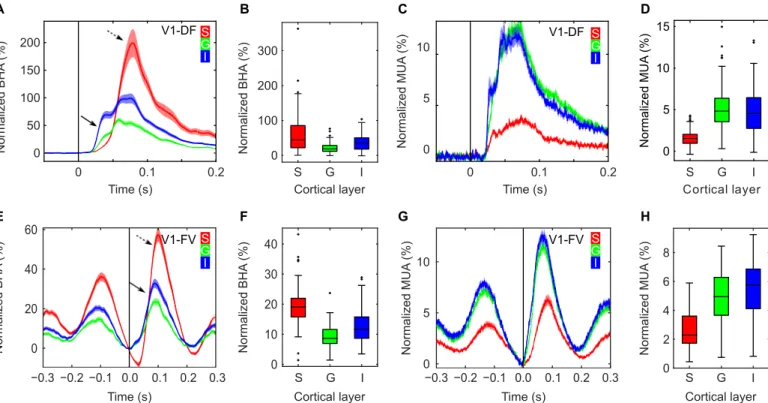
this contrast has been known for decades [see, e.g., (19)]. We selected these nonoptimal stimuli because we expected the dissociation to be strongest under these conditions, where activation of the superficial layers is relatively weak. We observed that BHA and MUA distribu- tions were both nonuniform across V1 cortical depth (both KW tests, P < 0.001, n = 104), yet they differed markedly (Fig. 2, A to D).
BHA was strongest in layers where neural firing was sparse to unde- tected. It was more pronounced in the supragranular than both granular and infragranular layers (all Wilcoxon tests; P < 0.001). MUA dis- played the opposite pattern: It was decreased in the supragranular compared to both granular and infragranular layers (both Wilcoxon tests; P < 0.001). BHA magnitude (P = 0.03) unlike MUA (P = 0.14) did differ across the granular and infragranular layers. Seventy percent of all V1 penetrations with diffused light flash stimulation showed a strong supragranular BHA in lieu of any detectable MUA increase.
The fact that the BHA and MUA have a differing laminar/temporal distributions accords with the view that these signals reflect different aspects of neural activity.
To test whether the observed dissociation generalizes across types of visual stimuli and task, we examined BHA-MUA dissocia- tion in experimental data collected during free viewing of natural scenes in the same V1 penetrations (V1-FV; see Materials and
Methods). It is noteworthy that natural scene viewing produces a much more effective activation of the superficial layers of the primary visual cortex (20). There are multiple differences in BHA and MUA morphology elicited by “active” (i.e., fixation locked) as compared to “passive” (stimulus locked) visual input. For example, both BHA and MUA decrease during saccade and rebound after saccade termi- nation (Fig. 2, E to H). Despite these differences in both BHA and MUA morphology, we continue to observe the laminar dissociation between BHA and MUA. Both BHA and MUA show nonuniform distributions across layers (both KW tests, P < 0.001, n = 49), with superficial layers showing strongest BHA (all Wilcoxon tests, z > 5.7, P < 0.001) and weakest MUA (all Wilcoxon test, z > 6.0, P < 0.001).
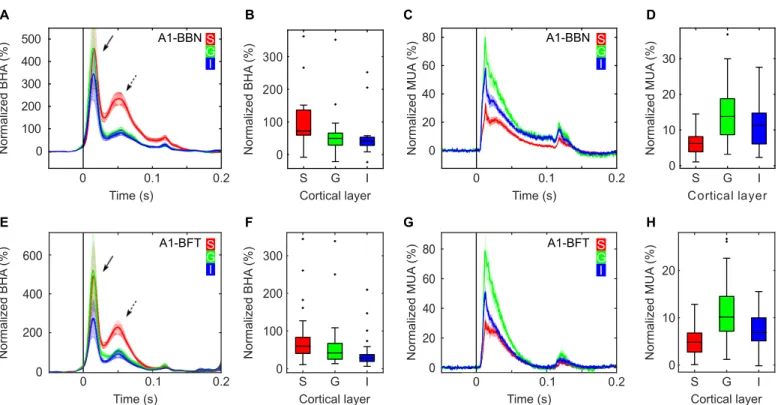
Next, we sampled from A1 during presentation of broadband noise (A1-BBN; see Materials and Methods) to test whether these effects generalize to other areas of the sensory cortex. Despite differ- ing temporal patterns of BHA signals in V1 and A1, key aspects of laminar dissociation between BHA and MUA generalize to A1. As in V1, event-related BHA and MUA were both observed across all three laminar compartments (Fig. 3, A to D), and both had a non- uniform laminar distribution (both KW tests, P < 0.001, n = 26).
Critically, BHA was stronger in the supragranular layers compared to granular and infragranular layers (both Wilcoxon tests, P < 0.001).
S G I
Cortical layer 0
100 200 300
Normalized BHA (%)
B A
0 0.1 0.2
0 50 100 150 )%( AHB dezilamroN 200
SG I V1-DF
Time (s)
0 5 10
Normalized MUA (%)
C
GS I
0 0.1 0.2
Time (s)
S G I
Cortical layer
Normalized MUA (%)
D
10 5 0 V1-DF 15
H
E F G
0 40
20
)%( AHB dezilamroN
60
0 .
0 0.1 0.2 0.3
−0.3 −0.2 −0.1
Time (s) Cortical layer
S G I
Normalized BHA (%)
0 10 20 30 40
10
5
Normalized MUA (%) 0
0
Normalized MUA (%)
2 4 6 8
Cortical layer
S G I
GS I GS
I
V1-FV V1-FV
0 .
0 0.1 0.2 0.3
−0.3 −0.2 −0.1 Time (s)
Fig. 2. Differential laminar distribution of BHA and MUA across experiments in V1. (A to D) present V1 data from recordings during diffuse flash stimulation (V1-DF;
n = 104 experiments in two animals). (E to H) Data from V1 recordings during free-viewing exploration of visual images [V1-FV; n = 49, same two animals as in (A to D)].
Line plots show the time course of BHA (A and E) and MUA (C and G) response across supragranular, granular, and infragranular (red, green, and blue lines) layers. x axes indicate time relative to stimulus (A, C) or fixation onset (E, G). y axes represent signal change from baseline (i.e., normalized BHA/MUA). Box plots present BHA (B and F) and MUA (D and H) distributions averaged across time after stimulus onset (B and D) and across the entire pre- and postfixation epoch (F and H). Supragranular, granular, and infragranular (S, G, and I) layers are plotted as separate box plots. Box plots indicate 25th percentile, median, and 75th percentile; whiskers extend to extreme values not considered outliers, while outliers are marked with crosses. Shading in line plots reflects SEM. Note the consistently different laminar distributions of BHA and MUA in both experiments. Despite different stimuli, levels of firing, and BHA magnitude across experiments, BHA in the supragranular layers is enhanced relative to that in the granular and infragranular layers, while MUA in supragranular is sparse compared to granular and infragranular. Note also that in the free viewing (E to H), there is sub- stantial saccadic modulations of MUA and BHA across all layers, with a clear pattern of MUA suppression around the time of the saccade (perisaccadic suppression) and MUA increase at the end of the saccade (onset of fixation). Arrows in (A and E) indicate early (solid line) and late (dashed line) BHA components.
on January 3, 2021http://advances.sciencemag.org/Downloaded from
In contrast, supragranular MUA was weaker than granular and infragranular layers MUA (both Wilcoxon tests, P < 0.001). The post- stimulus time interval during which BHA was increased from base- line was more sustained in the supragranular than in the granular and infragranular layers (73.5-, 18.7-, and 20.0-ms median supra- granular, granular, infragranular, respectively; both Wilcoxon tests, P < 0.001). In contrast, the poststimulus time interval during which MUA was increased from baseline was shorter in the superficial, as compared to deeper layers (15.5-, 42.5-, and 45.5-ms median supra- granular, granular, and infragranular, respectively; both Wilcoxon tests, P < 0.001). Neither BHA nor MUA durations differed between granular and infragranular layers (both Wilcoxon tests, P > 0.84).
While the spatiotemporal pattern of BHA and MUA differences in A1 largely parallels with that observed in V1, there are noteworthy A1-V1 differences. BHA in V1 during both passive (stimulus locked) and active (i.e., fixation locked) visual input had two elements (early and late) with confined laminar spread; the early component was limited to deep layers, while the late component was limited to su- pragranular layers. In A1, we observed larger temporal separation between early and late BHA components (median of 33 ms). As in V1, the late BHA component in A1 is largely limited to the superficial layers. However, unlike the early-deep component in V1, the early BHA component in A1 extends up into the supragranular layers.
We quantified this by directly comparing the BHA magnitude in A1 across layers in early (0- to 30-ms poststimulus) and late (31 to 100 ms)
time window. Differential laminar distribution was noted for the magnitude of the late (KW test, P < 0.001) but not the early BHA (KW test, P = 0.76). In contrast, MUA was decreased in the supra- granular layers compared to granular and infragranular layers during both time windows (all Wilcoxon tests, P < 0.001).
To test whether these results further generalize to other auditory stimuli, we analyzed data from the local best frequency tone response for each site within the same penetrations in A1 (A1-BFT; n = 26 sessions, two animals). For each individual penetration, we compared MUA responses across a set of 14 pure tones from 354 to 32 kHz (see Materials and Methods). We defined the best frequency tone as the one that elicited the largest magnitude MUA response in the layer L4 [e.g., (21, 22)]. Subsequently, we aggregated laminar BHA and MUA responses elicited by these best tone frequencies. This analysis reproduced our initial finding of nonuniform laminar distri- bution of BHA and MUA (KW test, both BHA and MUA, P < 0.01), with BHA being, again, strongest in the superficial layers (all Wilcoxon test, z > 3.3, P < 0.01) and MUA being weakest in the superficial layers (all Wilcoxon test, z > 2.9, P < 0.001; Fig. 3, E to H).
Supragranular layers are the major source of BHA at the pial surface
Next, we evaluated the extent to which these two BHA components (deep versus superficial) contribute to the BHA recorded on the pial surface [i.e., electrocorticographic (ECoG)–like signal; Fig. 4, A to D].
B
A C D
H A1-BFT
0 0.1 0.2
Time (s)
GS I
0 200
)%( AHB dezilamroN
400
600 S
GI
Normalized MUA (%)
0 20 40 60 80
0
Time (s)
0.1 0.2
Normalized BHA (%)
Cortical layer
S G I
300
200
100
0
Cortical layer
S G I
Normalized MUA (%)
0 10 20 A1-BFT
E F G
Cortical layer
S G I
0 0 100 200 300 400 )%( AHB dezilamroN 500
Cortical layer
S G I
0 100 200 300
Normalized BHA (%)
A1-BBNS GI
0 10 20 30
Normalized MUA (%)
Time (s)
0.1 0.2
0 20 40 60 80
Normalized MUA (%)
GS I
0 0.1 0.2
Time (s) A1-BBN
Fig. 3. Differential laminar distribution of BHA and MUA across experiments in A1. (A to D) presents data from A1 recordings during presentation of broadband noise (A1-BBN; duration, 100 ms; n = 26, two animals). (E to H) shows data from A1 recordings during presentation of best frequency tones [A1-BFT; 100-ms duration;
n = 26, same two animals as in (A to D)]. Line plots show the time course of BHA (A and E) and MUA (C and G) response across supragranular, granular, and infragranular (red, green, and blue lines) layers. x axes indicate time relative to stimulus (A, C, E, G). y axes represent signal change from baseline (i.e., normalized BHA/MUA). Box plots present BHA (B and F) and MUA (D and H) distributions averaged across time after stimulus onset. Supragranular, granular, and infragranular (S, G, and I) layers are plotted as separate box plots. Box plots indicate 25th percentile, median, and 75th percentile; whiskers extend to extreme values not considered outliers, while outliers are marked with crosses. Shading in line plots reflects SEM. Note the consistently different laminar distributions of BHA and MUA in both experiments. Despite different stimuli (i.e., broadband noise and best frequency tones), BHA in the supragranular layers is enhanced relative to that in the granular and infragranular layers, while MUA in supragranular is sparse compared to granular and infragranular. Arrows in (A and E) indicate early (solid line) and late (dashed line) BHA components.
on January 3, 2021http://advances.sciencemag.org/Downloaded from
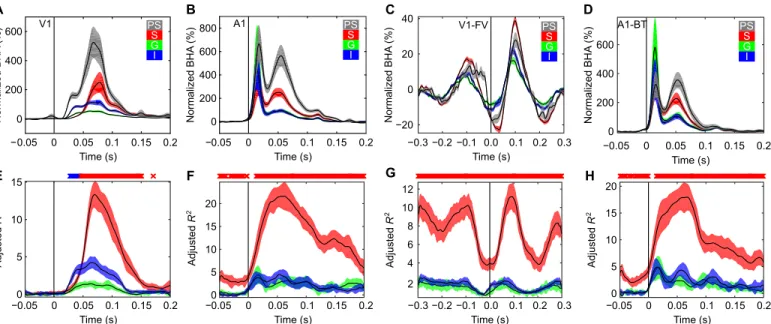
We reasoned that a signal from the cortical depth that explains most of the variance in the pial surface BHA would indicate a major laminar generator of surface BHA. To quantify the contribution of generators from different depths to the pial surface BHA, we used a standard method of tracing continuous FP from a neural source (generator) to the cortical surface [(22, 23); see Materials and Methods]. On the basis of both the magnitude of supragranular BHA and the proximity of supragranular current generators to the pial surface of cortex, we predicted that the supragranular layers should provide the largest contribution to BHA signal at the cortical surface. To quantify this, we estimated the percentage of variance explained (adjusted R2) by four linear regression models, including the data from either indi- vidual layers (Fig. 4) or all layers together (fig. S8). We used a linear regression model because it has been shown that volume conduc- tion itself is linear at a macroscopic scale (23–25). For both V1 and A1 experiments, most of the variance was explained by supragran- ular BHA (see Fig. 4, E to H; KW test, P < 0.05). We also observed that BHA from deep layers could explain some significant portion of variance, particularly in V1 passive viewing. The amount of vari- ance explained by supragranular layers reached 15, 25, 12, and 20%
(for V1-DF, V1-FV, A1-BBN, and A1-BFT, respectively), while it peaked at about 5% for granular and infragranular layers in all four experiments. Thus, while the BHA from all laminar compartments contributes to the pial surface BHA, the supragranular layers appear to be the major source.
Do these findings in macaques relate to BHA signals measured in humans?
To test whether the spatial dissociation between BHA and MUA noted in monkeys could be observed in humans, we used a small dataset from similar laminar probes implanted in a to-be-resected tissue of the prefrontal cortex (PFC) of two patients with pharmacoresistant
epilepsy during rest (Fig. 5). In short, spatial distributions of BHA and MUA were notably similar to those observed in monkeys with strongest BHA in the superficial electrodes and MUA in the deeper electrodes. As in our monkey data, we found nonuniform distribu- tions across cortical depth for both BHA and MUA (both KW tests, P < 0.001). There was also a differential distribution of BHA and MUA across cortical depth that was similar to that observed in monkeys:
BHA (Fig. 5, A and B) was strongest in the superficial channels as com- pared to middle and deep channels (both Wilcoxon tests, P < 0.001), whereas MUA (Fig. 5, C and D) was strongest in the middle channels as compared to superficial and deep (both Wilcoxon tests, P < 0.001).
This is consistent with our results from nonhuman primates, show- ing that the main generators of BHA are localized in supragranular layers, whereas the strongest local population neuronal firing is ob- served in deeper layers. These data were recorded from only two patients during rest (n = 960 and 2532 segments for a duration of 1 s, resulting in a total of 16 and 42.20 min of data) and should be interpreted with caution. However, the data do suggest that BHA and MUA might dissociate in the human neocortex in a manner similar to that we observed in the nonhuman primate neocortex.
BHA depends on intact NMDA transmission
Laminar activity profile recordings in rodents suggest that the most prominent current sink in the supragranular layers, which corre- sponds to the location generating the late-superficial BHA in our study, reflects the Ca2+-dependent spiking in the apical dendrites of pyramidal neurons (26). The synaptically evoked Ca2+ signal is largely mediated by the N-methyl-d-aspartate (NMDA) receptors (27), which regulate several processes, including neural plasticity (28) and dynamic shifts in neural excitability (29). The effect of NMDA-mediated en- hancement of excitability is strongest in the supragranular layers (29), consistent with the preferential expression of NMDA receptors there A
Time (s) 1 .
0 0.15 0.2 0 0.05
5 0 . 0
−
GS I PS
Normalized BHA (%)
400 600
200 0
V1 B
Time (s) 1 .
0 0.15 0.2 0 0.05
5 0 . 0
−
SG I PS 600
400 200
Normalized BHA (%)8000 A1
Time (s)0.1 0.15 0.2 0 0.05
5 0 . 0
− 15
10
5
0
AdjustedR2
E
AdjustedR2 20
15 10 5 0
Time (s)0.1 0.15 0.2 0 0.05
5 0 . 0
−
F Time (s)
1 .
0 0.15 0.2 0 0.05
5 0 . 0
− 600 400 200
Normalized BHA (%) 0 S
GI A1-BT PS
D
AdjustedR2
20 15 10 5 0
Time (s)0.1 0.15 0.2 0 0.05
5 0 . 0
−
H C
Normalized BHA (%)
Time (s)0.1 0.2 0.3 2
. 0
− −0.1 0.0
−0.3 0 20 40
GS I V1-FV PS
−20
Time (s)0.1 0.2 0.3 2
. 0
− −0.1 0.0
−0.3 2 4 6 8 10 12
AdjustedR2
G
Fig. 4. Laminar contributions to the pial surface BHA signal. (A to D) BHA recorded from pial surface, supragranular, granular, and infragranular layers (gray, red, green, and blue, respectively) of (A) V1 during whole-screen flash stimulation (n = 31 experiments). (B) Presentation of broadband noise during A1 recordings (n = 24), (C) free viewing of visual images during V1 recordings (n = 18), and (D) presentation of best frequency pure tones during A1 recordings (n = 24). y axes represent signal change from baseline (i.e., normalized BHA). (E to H) Portions of the amount of variance (adjusted R2) in the pial surface BHA signal explained by each of three different models, containing laminar BHA from either supragranular (red), granular (green), or infragranular (blue) layers as predictors. Colored markers over panels represent cortical depth, which explains most of the variance (KW test across distributions of adjusted R2 values).
on January 3, 2021http://advances.sciencemag.org/Downloaded from
(30). The laminar distribution of NMDA receptors and the time course of the NMDA-mediated depolarization (slower and primarily supragranular) suggest that the later superficial BHA signal may have a strong NMDA dependence, further dissociating BHA from neuronal firing. To address this possibility, we examined the effects of systemic administration of the noncompetitive NMDA antagonist phency- clidine (PCP) on auditory responses in A1 (n = 8 experiments, one animal). During control recordings (i.e., before PCP), stimulation elicited a sharp and transient increase in both BHA and MUA (Fig. 6).
To test the overall effect of PCP on BHA and MUA, we averaged each signal across time within a 150-ms poststimulus window and compared the magnitude of these averaged responses before and after PCP administration (see Fig. 6). After PCP administration, BHA was significantly attenuated across all layers (all Wilcoxon tests, P < 0.01), while MUA showed no detectable difference between con- trol and PCP (all Wilcoxon tests, P > 0.26) at any cortical depth.
While there is no significant impact on the MUA, both early and late BHA components are attenuated by the PCP. It is also noteworthy that the early BHA component is attenuated, while the late compo- nent is abolished. Albeit based on data from only one subject, the effects of NMDA blockade are robust and provide a pharmacological dissociation between BHA and MUA. Previous studies found enhanced [e.g., (31)] and suppressed (32) BHA after NMDA-antagonist admin- istration. These differential effects might be attributed to the complex influence that NMDA-antagonists have on the stimulus-elicited re- sponse (32). Lazarewicz et al. (32) found that an NMDA-antagonist
(ketamine) simultaneously enhanced prestimulus and poststimulus gamma activity, while the relative response to stimulus was decreased.
The current findings point to a pharmacological dissociation with low doses of an NMDA-antagonist affecting BHA relative response to stimulus while keeping MUA intact.
DISCUSSION
BHA is a critical mesoscopic signal commonly used to bridge the gap between human electrophysiology and single-unit studies in animals.
Moreover, BHA is the closest neural correlate to the BOLD fMRI signal, linking neuroimaging and neurophysiology. On the basis of influential earlier studies, a prevalent view on human electrophysiology is that BHA is a simple reflection of MUA. Across experiments in V1 and A1, we identified spatial, temporal, and pharmacological dis- sociations between BHA and MUA. Our results suggest that BHA and MUA index different aspects of the neural activity with divergent features across layers of the neocortex. BHA had two spatially and temporally distinct components, i.e., early deep and late superficial, observed in granular-infragranular and supragranular layers, re- spectively. There is a substantial spatial and temporal correspondence between MUA and the early-deep BHA component. In contrast, the MUA correlate of late-superficial BHA is much weaker and often undetectable. BHA appears to be NMDA mediated, with low doses of noncompetitive NMDA antagonist (PCP) decreasing BHA while leaving MUA intact. Our regression analyses show that, although
Sub1: BHA n = 2532
Normalized signal (z score)
1.5 1.0 0.5 0.0
−0.5
−1.0
−1.5
Cortical depth1 2 3
A Sub1: Single BHA trace example
Cortical depth
Time (s)
0.0 0.25 0.5 0.75
1µV2
Cortical depth
0.0 0.25 0.5 0.75
Sub1: Single MUA trace example 0.2 µV
Time (s)
Sub1: MUA 1.5
1.0 0.5 0.0
−0.5
−1.0
−1.5
Cortical depth1 2 3 n = 2532
Normalized signal (z score)
C
Normalized signal (z score)
1.5 1.0 0.5 0.0
−0.5
−1.0
−1.5
n = 960
Cortical depth1 2 3 Sub2: BHA
Time (s)
Cortical depth
0.0 0.25 0.5 0.75
Sub2: Single BHA trace example 25 µV2
B
Cortical depth
Sub2: Single MUA trace example
Time (s)
0.0 0.25 0.5 0.75
1 µV
D
n = 960 Sub2: MUA
Normalized signal (z score)
1.5 1.0 0.5 0.0
−0.5
−1.0
−1.5
Cortical depth1 2 3 Fig. 5. Laminar distribution of BHA and MUA in the human prefrontal cortex. Line plots show example traces from simultaneous BHA (A and B) and MUA (C and D) recordings during rest in two patients with epilepsy implanted with linear probes in a to-be-resected tissue. Signals were assigned into three a priori depths (1, 150 to 900 m; 2, 1050 to 1800 m; and 3, 1950 to 2850 m) based on known thickness of the cortex (see Materials and Methods). The whole resting data were segmented into 1-s-long intervals (100-ms-long intervals at side of epoch were removed after filtering to avoid contamination of edge effects). The laminar distribution of BHA and MUA was quantified by testing for nonuniformity of BHA and MUA across depths (see Materials and Methods). Box plots present results aggregated across all BHA (A and B) and MUA (C and D) epochs in each patient separately. Box plots indicate 25th percentile, median, and 75th percentile; whiskers extend to extreme values not considered outliers. Outliers are shown as “+” signs.
on January 3, 2021http://advances.sciencemag.org/Downloaded from
the BHA from all laminar compartments volume conducts to the pial surface, the main generators of BHA are localized in the supragranular layers where, as shown by numerous prior studies, firing is sparse [(22, 33, 34); for review, see (35)]. This is important because it sug- gests that the BHA recorded at the pial surface (e.g., with an ECoG electrode) likely overrepresents signals generated in supragranular layers, while the more robust event-related spiking activity is ob- served in the granular and infragranular layers and often precedes activation, as indexed by BHA. The results of laminar recording exper- iments in rodents (26) indicate that the large, late-superficial compo- nent may be generated by Ca2+ influx during apical dendritic spiking of pyramidal cells. The vulnerability of the largest (late superficial) component of BHA signal to NMDA receptor blockade in our exper- iments suggests that this component may index the same process.
Several critical implications of our findings for the interpretation of the BHA signal merit further emphasis. First, BHA as recorded from the pial surface of the cortex reflects relatively modest contri-
butions from neuronal firing. Our pharmacological findings (Fig. 6) link to those of Suzuki and Larkum (26) in pointing to an underlying NMDA-mediated process generating BHA. One possibility is that BHA originates from calcium-dependent spikes that are long-lasting (10 to 100 ms) nonsynaptic events triggered by NMDA receptor–
mediated excitatory postsynaptic potentials (36) that have been sug- gested to be a mechanism for associating information carried by feedforward and feedback pathways (37).
The current finding that the supragranular BHA is the largest contributor to the pial surface signal suggests that the BHA as typi- cally measured in ECoG may contain a substantial representation of input from cortical feedback pathways. The median of 33-ms (inter- quartile range of 3 ms) onset-to-onset difference between early and late supragranular BHA signals in A1 is much longer than expected for a conduction delay within a direct monosynaptic connection be- tween granular and supragranular layers (35). One possible expla- nation is that the early BHA reflects feedforward signal propagating to L4 and then to extragranular layers, whereas the late-superficial BHA reflects feedback from higher auditory areas to A1, which pro- vides a strong input to the supragranular layers. In feedback pathways, predictions and contextual information originating in extragranular layers of higher-order areas are projected to and modulate lower cor- tical areas. Because feedforward and feedback pathways encode differ- ent information (33), bias toward feedback circuits in ECoG-derived BHA might favor predictive and contextual information.
The idea that BHA reflects an integrative process separable from the typical action potential may help to interpret several currently unexplained observations. Niessing et al. (14) used recordings from V1 of anesthetized cats to show that BHA is a better correlate of BOLD fMRI than MUA. Both BOLD and BHA encode stimulus in- tensity at a finer rate than MUA. This is puzzling under the assump- tion of BHA being a direct consequence of spiking neurons. The current results help to understand this discrepancy by suggesting that BHA (and consequently BOLD fMRI) might reflect dendritic processes subthreshold to neural firing. This interpretation would predict that the correlation between the magnitude of BHA and fir- ing, rather than being constant, depends on the effectiveness of a stimulus in driving the cortex. For stimuli that are more effective in eliciting action potentials, correspondence between BHA and MUA will be stronger than for stimuli that are less effective. In support of this, Nir et al. (15) showed that coupling between firing rates of indi- vidual neurons and BHA varies across time rather than being stable.
Furthermore, they also showed that the level of spike-BHA coupling depends on the degree of firing rate correlations between neighboring neurons. Similarly, Smith et al. (38) observed changing correlation between BHA and MUA during epileptic seizure. In support of the subthreshold view, Rich and Wallis (17) found that the BHA in the orbitofrontal cortex, although correlated with firing, diverged from MUA on several dimensions, carried more information, and was more sensitive to spatiotemporal changes than neural firing. The current findings suggest that BHA primarily reflects a dendritic process that is separable from neural firing. Our findings also suggest that using BHA as a proxy for neural firing overestimates the onset latency and duration of firing. This outcome introduces important caveats into the interpretation of the BHA signal, but it remains clear that the signal, particularly in the deeper layers, still has a strong relation- ship to neuronal firing. Improved understanding of the additional neuronal contributions to BHA makes it a richer, more useful index of brain activation. While it is unlikely, it is also possible that BHA A
Normalized MUA (%)
0 50 100 150 200 )%( AHB dezilamroN 250
0 0.1
Time (s) 100
Normalized MUA (%)
0 0.1
0 50
100
0 0.1
Time (s) 0
50
)%( AHB dezilamroN
Time (s) Control
0 0.1
0 50 100 150 200
250 PCP
Time (s)
Control
PCP
B
C
E
D
F
5 1 . 0 5
0 . 0
− 0.05
5 0 .
0 0.15
−0.05
0.15
0.15 5
0 . 0
− 0.05
−0.05 0.05
Cortical depth
Normalized BHA (%)
I G
S S
0 20 40
60 Control
PCP
Cortical depthG I Control 40 PCP
30 20 10 Normalized MUA(%) 0
Fig. 6. The effect of PCP on BHA and MUA in the primary auditory cortex.
(A and B) Box plots present BHA (A) and MUA (B) averaged within the 150-ms-long poststimulus time window before (control) and after systemic administration of PCP (n = 8). Box plots indicate 25th percentile, median, and 75th percentile;
whiskers extend to extreme values not considered outliers. (C to F) Line plots show the time course of BHA (C and E) recorded from supragranular, granular, and in- fragranular (red, green, and blue lines) layers of A1 before (C) and after (E) systemic administration of PCP. (D and F) Concomitant MUA recordings from the same supragranular, granular, and infragranular (red, green, and blue lines) layers before (D) and after (F) systemic administration of PCP. x axis indicates time relative to stimulus onset. y axis represents signal change from baseline, averaged over the 50-ms interval before the stimulus (normalized BHA/MUA). Shading reflects SEM.
on January 3, 2021http://advances.sciencemag.org/Downloaded from
and MUA might be generated by two distinct mechanisms operat- ing at the same time at the same cortical depths.
The current findings provide an additional step toward the un- derstanding that in supragranular layers, neural codes could entail dense subthreshold synaptic inputs accompanied by sparse firing (35).
It has been clear for some time that the firing in superficial layers is sparse compared to those in the deeper layers. For example, Sakata and Harris (34) studied the population activity in the rat auditory cortex during spontaneous and sensory-evoked stimulation. Both con- ditions exhibited a sparse, spatially localized activity in the layer 2/3 pyramidal cells, with a densely distributed activity in the larger layer 5 pyramidal cells and putative interneurons. Recordings from pyramidal neurons in primary somatosensory barrel cortex, both under anes- thesia and in awake animals, also revealed low spontaneous and evoked firing in layer 2/3 compared to much higher firing rates in layer 5 pyramidal neurons (39, 40). Another study that looked at the barrel cortex in awake head-restrained mice during object localization found superficial layers (layer 2/3) firing was about 20 times weaker than firing rates in deeper layers (41). Similarly, in A1 of nonhuman pri- mates, neuronal firing is typically reduced in the superficial, relative to the middle and deep layers during both spontaneous and stimulus- evoked recordings [e.g., (21, 42)]. A relative paucity of firing in super- ficial layers is observed in primary somatosensory cortex during stimulation (43) and in resting spontaneous activity (44). Similarly, Bastos et al. (45) observed a weaker superficial firing, as compared to layer 4 in macaque prefrontal cortex (PFC) (see the Supplementary Materials). Self et al. (46) also show weaker supragranular MUA in response to full-screen, high-contrast checkerboard stimulation and during spontaneous recordings in V1. A detailed review of possible mechanisms leading to sparser firing in the superficial layers rela- tive to deeper layers is beyond the scope of our manuscript. However, the fact that layer 2/3 pyramidal neurons appear to require substan- tially more excitatory synaptic input to drive them to action potential threshold compared to L5 pyramids (35) points to one mechanistic explanation for this common observation.
MATERIALS AND METHODS Experimental design
Nonhuman primates data acquisition
Data from four nonhuman primates (Macaca mulatta, 5.0 to 7.0 kg) were included in the current study: two female (n = 104 penetrations into V1 during whole-screen flashes; n = 49 penetrations into V1 during free viewing of colored images) and two male monkeys (n = 26 penetrations into A1 during broadband noise presentation and best tone response). We also used data recorded from A1 in one addi- tional male monkey (n = 8 penetrations) before and after systemic administration of PCP. Animals sat in a primate chair in electrically shielded and sound-attenuated chambers, with their head fixed in position. Laminar profiles of FPs and concomitant MUA were ob- tained using linear array multicontact electrodes, with 23 sites equally spaced at 100 or 200 m. The electrode was inserted through the dura into the brain and positioned to span all layers of the cortex (Fig. 1). The impedance ranged from 0.3 to 0.5 megohms. We used a standard measure to estimate the magnitude of the spiking activity in the local neuron population surrounding each electrode contact, MUA (47, 48). Signals were impedance matched with a preamplifier (10× gain, bandpass DC of 10 kHz) situated on the electrode, and after further amplification (500×), the signal was split into FP (0.1 to
500 Hz) and MUA (300 to 5000 Hz) range by analog filtering. FPs were sampled at 2-kHz/16-bit precision, and MUA was sampled at 20-kHz/
12-bit precision. Additional zero phase shift digital filtering (300 to 5000 Hz) and rectification were applied to the MUA data, and, last, it was integrated down to 1 kHz (sampled at 2 kHz) to extract the con- tinuous estimate of cell firing (21, 22, 47). The BHA was calculated by filtering FPs within a range of 70 to 150 Hz (see below for more details).
Surgery
The surgical procedures for nonhuman primates followed those previ- ously described (22, 33). Briefly, preparation for awake intracranial recordings was performed using aseptic techniques under general anesthesia. The tissue overlying the calvarium was resected, and ap- propriate portions of the cranium were removed while overlying dura and neocortex were left intact. Custom recording chambers (Crist Instrument Co. Inc.) with electrode guide grids were positioned so that the electrode track was perpendicular to the surface of V1 or to the lower bank of the lateral sulcus for A1 penetrations; for the de- tails of the insertion of laminar multielectrode array, see the Supple- mentary Materials.
Visual stimuli
Visual stimuli, consisting of both whole-screen and diffused light flashes, were used to elicit visual-evoked response profiles for the positioning of laminar electrodes to straddle the layers of V1 (49).
Stimuli (n = 100 to 300 per penetration) were presented at a distance of 86 cm in front of the monkeys. Stimuli were delivered either every 642 ms as a whole-screen luminance flux on a video monitor (17-ms duration each) or were generated by a Grass PS33 Plus photic stimulator (Grass-Telefactor Inc., West Warwick, RI) and projected onto a diffuser at a 2-Hz rate with a 10-ms duration. To test whether BHA-MUA dissociation generalizes to other conditions and stimuli sets, we examined the experimental data collected during the free viewing of colorful images in the same V1 penetrations [see (20) for more details on recordings]. It is noteworthy that natural scene view- ing produces a much more effective activation of the superficial layers of the primary visual cortex (20).
Auditory stimuli
Auditory stimuli consisted of broadband noise delivered at 60-dB sound pressure level (SPL) through two free field speakers directed toward the ears (Tucker-Davis Technologies). Noise stimuli (n = 100 per penetration) were presented for the duration of 100 ms each and were interleaved with pure tones of different frequencies ranging from 354 Hz to 32 kHz presented at 625-ms stimulus onset asynchrony.
The auditory stimuli used in the pharmacology experiment consisted of 100 clicks presented at 65-dB SPL with the interstimulus interval of 450 ms. All protocols were approved by the Institutional Animal Care and Use Committee of the Nathan Kline Institute. We selected these nonoptimal stimuli (diffused flash light for V1 and broadband noise for A1) because we expected the dissociation to be strongest under these conditions, where activation of the superficial layers is relatively weak. Analysis of responses to stimuli that are not experi- mentally optimized for the neurons under study is not an unreason- able approach since, in the vast majority of human ECoG studies, stimuli cannot be optimized for all recording sites. The broadband noise stimulus was overall very effective in activating A1 across all layers. To further test whether the dissociation between BHA and MUA generalizes to the optimal auditory stimuli, for each penetra- tion, we establish the best frequency of the recording site using a
“suprathreshold” method [e.g., (21)]. Briefly, we examined a set of pure tones (354 Hz to 32 kHz in half-octave steps), each lasting for 100 ms.
on January 3, 2021http://advances.sciencemag.org/Downloaded from
For each penetration, we identified the tone that elicited the largest MUA in the granular layer. These best frequency tones were then used in further analyses of the BHA and MUA laminar distribution.
Monkey laminar assignment
We assigned channels to layers using standard criteria described pre- viously in V1 and A1 (22, 33, 49). Briefly, V1 during visual stimulation exhibits a “feedforward” laminar profile, with activation beginning in layer 4 and followed by that in the extragranular layers. Therefore, the granular layer was assigned to channels showing the earliest cur- rent sink coupled with a concomitant increase in MUA (22, 33, 49).
On the basis of the laminar current sink and source patterns and known anatomy (50), the positions of the supragranular and infra- granular layers were identified relative to the position of granular layer. In the primary auditory cortex, the polarity of P30 in FPs inverts to negative in supragranular layers and that inversion coincides with supragranular sink in the CSD profile. Before P30, there is an early negative peak, which inverts to positive at a depth corresponding to a granular current sink that is often paired with a deeper source. The sink/source configuration in the granular layer coupled with rapid increase in MUA reflects the initial thalamocortical activation of A1 (51).
For a similar approach, see (21–23, 31, 33, 49, 51–54). Temporal response profiles in V1 and A1 are different. In particular, the initial input to A1 is very rapid below 10-ms poststimulus onset (21, 51), while input to V1 is much slower on the order of ~30 to 50 ms in the very fastest cases reported (49, 55) and, similarly, the delay between stimulus-evoked neural firing of ~30 ms. The temporal lag in re- sponse onsets between the granular and supragranular layers is signif- icant in V1 [e.g., (49, 55)], while that in A1 is substantially smaller [e.g., (51)]. The subtle differences between stimulus-evoked MUA onset latency in layer 4 versus layers 2/3 of A1 are obscured by the bandpass filtering used to extract the BHA signal. This is also the main reason why we do not compare onsets between BHA and MUA in the current manuscript.
Human data acquisition
We also used data from two human patients with epilepsy implanted with intracranial electrodes for diagnostic purposes; the laminar probes were placed into cortical areas that were planned for later surgical excision. One subject had a laminar probe at the border between Brodmann areas 6, 8, and 9, whereas the second subject was implanted in left frontal Brodmann area 46. Both subjects 1 and 2 were males recorded during rest for the duration of 43 and 16 min, respectively. Laminar profiles of FPs and concomitant MUA were obtained using linear array multicontact electrodes, with 23 sites equally spaced at 150 m. All protocols were approved by the local Institutional Review Board at the Hungarian Academy of Sciences.
Human depth assignment and analysis of the human data Unlike in V1 and A1, the laminar physiology of cortical areas that were implanted in human subjects (i.e., frontal cortex) remains poorly understood. We therefore assigned signals to cortical depths on the basis of the known cortical thickness of the frontal cortex, rather than anatomical and physiological markers, as described above. The thickness of the human prefrontal cortex is, on average, below 2800 m (56). Because the intercontact spacing of the laminar probes was 150 m and the silicon pad at the top of the probe rested on the cortical surface, we a priori assigned channels into three equally spaced depth bins: superficial (150 to 900 m), middle (1050 to 1800 m), and deep (1950 to 2850 m). We therefore refer to the cortical depths rather than cortical layers in our data from human partici- pants (Fig. 5).
The BHA and concomitant MUA in human subjects were both calculated in the same way as for the nonhuman subjects (see above), with the same filtering and artifact removal procedures. Pre- processed data were segmented into 1-s time intervals, resulting in 2532 and 960 epochs for subjects 1 and 2, respectively. These were then z-scored across channels and averaged within each depth bin.
We used the same statistics approach to quantify the laminar dis- tribution of the BHA and MUA as in the analysis of nonhuman primate (described above). Briefly, we first calculated KW separate- ly for BHA and MUA to test for any difference in the laminar distri- butions across layers. Subsequently, we used the Wilcoxon signed-rank test to calculate pairwise comparisons between different depth bins separately for the BHA and MUA.
Pharmacology study
To test the role of Ca2+ in BHA, we studied the activity recorded in A1 (n = 8 penetrations, one monkey). The animal was presented with trains of clicks (interstimulus interval of 450 ms) before and after systemic administration of PCP (0.5 and 1 mg/kg, n = 5 and 3, respectively), a noncompetitive NMDA antagonist whose effect is to block Ca2+ channels. We reasoned that if BHA depends on Ca2+
dynamics, then PCP would primarily influence BHA rather than MUA. All analyses were performed, as described above.
Statistical analysis Data preprocessing
The FPs and MUA were first segmented relative to the stimulus (non- human primate data with presentation of diffused light flashes, broadband noise, and best tone response). Subsequently, BHA was calculated from FPs by filtering and Hilbert-transforming segment- ed data. Complex-valued time series was rectified and squared to ex- tract power. To avoid contamination from edge effects of filtering, we discarded data from the first and last 150-ms window, resulting in 450 ms epochs (-150 ms to 300 ms relative to stimulus onset).
To analyze free-viewing data, we used a different approach. During presentation of 40 colored images, we identified onsets of fixations and saccades [1000 Hz; EyeLink 1000; SR Research Ltd., Mississauga, Canada; five-point calibration; for more details, see (20)] using SR Research software. Subsequently, BHA was calculated on continuous data. Next, using eye-movement events (fixation and saccade onsets), we segmented the data relative to eye event onset with 350 ms before and after the onset. Note that because fixation- and saccade-locked analyses revealed similar effects, we focused on fixation-locked analyses in the main manuscript. Human data were segmented into 1-s-long consecutive epochs (100 ms from each side was removed to avoid edge effects of filtering).
All the above analyses used the same segmentation for the FPs and MUA signals. For laminar segmentation, we calculated one-di- mensional CSD profile from FPs using the second spatial derivative.
All the analyses in the main manuscript used BHA calculated on the basis of bipolar derivative (but see fig. S1). Segmented FPs were next notch filtered to remove line noise at 60 Hz and harmonics at 120 and 180 Hz. Trials with excessive signal deflection in either FP or MUA exceeding ±5 SD of the mean were considered as artifacts and removed from further analyses. The same criterion was used for all the experiments presented in the manuscript.
Broadband high-frequency activity
FPs based on the first and second spatial derivative (i.e., the bipolar and CSD, respectively) have comparable spatial specificity; how- ever, the former maximizes signal-to-noise ratio. This is because the
on January 3, 2021http://advances.sciencemag.org/Downloaded from