Krisztina Hegedüs
1– Viktória Endrődi-Kovács
2Energy poverty in Hungary
There is no unified global or European definition for the term energy poverty. It has different meanings depending on place and context of using it. However, the EU Member States have the obligation to assess the number of households in energy poverty due to the Regulation on the governance of the energy union and climate action. Defining energy poverty in Hungary has to be made carefully, as it gets a political aspect through the regulated prices. The aim of this paper is to overview the possible definitions of the term energy poverty and give an esti- mated extent of the Hungarian population that could be counted as energy poor.
Az energiaszegénység fogalmára jelenleg nincsen egységes definíció sem világszinten, sem eu- rópai uniós szinten, a jelentése a használat helyétől és környezetétől függ. Azonban az Európai Unió tagállamainak az Energiaunió irányításáról szóló rendelet alapján fel kell mérniük az energiaszegénységben elő háztartások számát. A hazai definíció kialakításakor tekintettel kell lenni a politikai tényezőkre is, amelyek a szabályozott árak miatt kerülnek előtérbe. A tanul- mány célja, hogy áttekintést adjon az energiaszegénység lehetséges definícióiról, valamint ezek alapján becslést adjon a különböző definíciók alapján az energiaszegény lakosság arányáról.
1. Introduction
Energy poverty has no global definition, as there is no single interpretation of the term. The phrase energy poverty is a multidimensional concept and it has different meanings depending on the physical space we are in. In the developing world, it is more about the lack of access to energy. In the European Union, where accessing energy sources is not an everyday problem, energy poverty is more about the affordability of energy. Thomson-Snell (2016) argue in their paper that there are two phrases: energy poverty and fuel poverty. Originally energy poverty meant the lack of access of energy sources and fuel poverty referred to the affordability of energy in modern economies. However, nowadays the two phrases is more like synonyms, and one can argue that fuel poverty is an Anglo-Saxon phrase, while energy poverty is a broader concept that includes fuel poverty. The European legislations use the term energy poverty, therefore in our paper we use it as well. In this paper we are focusing on the European aspects and indicators of energy poverty as our main topic is energy poverty in Hungary.
There are already some European countries that have a definition for energy poverty, most of the Member States have to form their definition. The Regulation on the Governance of the energy union and climate action (European Parliament and Council; 2018) specifies that every Member States has to establish an Integrated National Energy and Climate Plan (NECP). The measurement of the energy poor households is the part of the NECP. Each Member States has to assess the number of the energy poor households and has to have an indicative objective to redu-
1 assistant lecturer, Institute of World Economy, Corvinus University of Budapest
2 assistant professor, Institute of World Economy, Corvinus University of Budapest DOI: 10.14267/RETP2019.03.13
ce this number. The actual number of energy poor households have a political aspect as well. One of the main objectives of the European legislations, such as the Electricity Directive (European Parliament and Council; 2019a) and Electricity Regulation (European Parliament and Council;
2019b) is to create the conditions to have competitive electricity markets in Europe. That would mean phasing out the regulated prices from the market. The legislations allow regulated prices (after a transition period) only for energy poor households or vulnerable customers, but the competence to define energy poverty remains in the Member States. Therefore, while policy ma- kers have to define energy poverty, they also have to consider how widely Hungary should keep the possibility of the regulated prices for household customers in energy markets.
In the next chapters we analyse which aspects and indicators could be taken into account for a definition, and which definition would mean to Hungary, what percent of the population could be defined as energy poor.
2. Definitions for energy poverty in Europe
Thomson-Snell (2016) in their study „Definitions and indicators of energy poverty across the EU”
have collected which European country has already had a definition for energy poverty. According to the study 5 EU Member States have some definition. England, Ireland and Northern Ireland have a similar definition that Broadman (1991) formulated. According to this, energy poor is a household that spends more than 10% of its income on energy (Herrero-Ürge-Vorsatz; 2014 p.3). Since 2013 the UK definition has changed and the 10% has been deleted from it, and has 2 conditions: “A household is considered to be fuel poor where: they have required fuel costs that are above average (the national median level), and were they to spend that amount, they would be left with a residual income below the official poverty line” (60% median income) (Thomson-Snell; 2016 p.108). Besides the Anglo-Sa- xon states, France and Slovakia have definitions for energy poverty. In France from 2009 a person is considered fuel poor “if he/she encounters particular difficulties in his/her accommodation in terms of energy supply related to the satisfaction of elementary needs, this being due to the inadequacy of financial resources or housing conditions” (Thomson et al.; 2016 p.6). While Slovakia has the followi- ng definition from 2015. “Energy poverty under the law No.250/2012 Coll. Of Laws is a status when average monthly expenditures of household on consumption of electricity, gas, heating and hot water production represent a substantial share of average monthly income of the household.” (Thomson- Snell; 2016 p.109). The French and the Slovak definition could be interpreted, while the UK and Anglo-Saxon definitions have concrete numbers and they could be quantified.
Herrero-Ürge-Vorsatz (2014) in their respected study draw attention to the fact that the term energy poverty should not be mixed up with poverty, because they differ in many ways. The prob- lem could be highlighted with an example; that from a certain point the supply of energy is not a question of choice. A household can regulate (if it is possible) the temperature of the rooms, but there is a level, at which we cannot go lower, because we would freeze. Beside the low-income rate is not a requirement for energy poverty. Therefore, the definitions which based purely on income could not be good. Studies in Hungary (e.g.: Herrero-Ürge-Vorsatz; 2014, Fellegi-Fülöp; 2012) about energy poverty highlights 3 indicators, that have to be considered for the term energy po- verty. These indicators are income, energy prices and energy efficiency of the households.
The Insight_E Observatory, which is a think tank in energy for the European Commission, published a report in 2015 about “Energy poverty and vulnerable consumers in the energy sector
across the EU: analysis of policies and measures”. The report also takes the 3 factors and aggre- gate the various indicators in the intersection of the 3 factors.
According to the Insight_E Observatory (2015 p.10) the drivers and the indicators of energy poverty are the following:
• Low income – high energy bills: energy affordability o income
o energy prices
o energy consumption (level)
• Low income – poor energy efficiency: housing patterns o tenure system
o housing characteristics
• High energy bills – poor energy efficiency: energy use patterns o energy consumption type
o type of heating system and share of central heating
The European Commission has an initiative to help Member States defining and battle aga- inst energy poverty, in the form of EU Energy Poverty Observatory (EPOV). Through EPOV platforms Member States can share good practices, and EPOV collects data and indicators for energy poverty. On the website (www.energypoverty.eu) 4 primary indicators have been publis- hed for energy poverty, which are the followings:
• Arrears on utility bills
The indicator is based on the question "In the last twelve months, has the household been in arrears, i.e. has been unable to pay on time due to financial difficulties for utility bills (heating, electricity, gas, water, etc.) for the main dwelling?" (EPOV; 2019a).
• Low absolute energy expenditure
The indicator presents “the share of households whose absolute energy expenditure is below half the national median, or in other words abnormally low.” (EPOV; 2019b). There is a warning coming with this indicator, as this indicator could be high not only if the energy efficiency is really high, but also if households are dangerously under consuming energy. However, as we can see in one case it is desirable to have a high number for this indicator, while in the other case it is not.
• High share of energy expenditure in income
The indicator presents “the proportion of households whose share of energy expenditure in income is more than twice the national median share.” (EPOV; 2019c).
• Inability to keep home adequately warm
The indicator is the share of the population that could not keep their home adequately warm, based on the question "Can your household afford to keep its home adequately warm?" (EPOV; 2019d). What the term means “adequately warm” is different worldwide.
EPOV has a questionnaire, therefore in here it is based on relative feel of the respondents.
The World Health Organization’s standard is 21°C for the living room, and 18°C for other rooms are satisfactory (Fellegi-Fülöp; 2012).
There are several secondary indicators have been published on the website of EPOV. Secondary in- dicators are relevant for the topic energy poverty, but not direct indicators. The secondary indicators are:
fuel oil prices, coal prices, biomass prices, district heating prices, household electricity prices, household gas prices, dwelling comfortably cool/warm during summer/winter time, dwellings in densely populated area, number of rooms per person owned/rented/total, poverty risk, energy expenses per quantile, equip- ped with air conditioning, equipped with heating, excess winter mortality, presence of leak/damp/rot.
For defining energy poverty (or to be more precise to fuel poverty) in Hungary Energiaklub (2012) had a proposal. According to their finding 3 criteria should be fulfilled for consider a household energy poor, which are the following (Fellegi-Fülöp; 2012 p.2):
• the annual income of the household is below 60% of the median Hungarian household income,
• the ratio of the theoretical annual energy cost of heating the house to 20 °C and providing hot water and the household’s total income is more than double the median rate based on the total number of households' actual, declared data, namely 34%.
• the building has an energy performance certificate rating below F.
Although the European legislation gives the Member States some space to have their own de- finition for energy poverty there are several restrictions and recommendation in the Clean Energy for all European legislation package for energy poverty. In the preambulum of the Electricity Di- rective it is stated that “low income, high expenditure on energy, and poor energy efficiency of homes are relevant factors in establishing criteria for the measurement of energy poverty” (Eu- ropean Parliament and Council; 2019a p.9). According to the Electricity Directive article 28 “each Member State shall define the concept of vulnerable customer, which may refer to energy poverty”
(European Parliament and Council; 2019a p.34). Article 29 on energy poverty states that “Member States shall establish and publish a set of criteria, which may include low income, high expenditure of disposable income on energy and poor energy efficiency” (European Parliament and Council;
2019a p.34). The European Commission will provide guidance for the Member States.
Hungary has no definition yet for energy poverty. However, there are some concepts that are related to energy poverty. First there is the Fundamental Law of Hungary, which states in article XXII. (1) that Hungary shall strive to provide to every person decent housing and access to public services. (Funda- mental Law of Hungary; 2011). Moreover, Hungary has a term for vulnerable customers. The Hungarian Authority for Consumer Protection defines it as a residential customer, who can take part of the service with special conditions. In the Electricity Act it is stated, that “Vulnerable customers are afforded protec- tion under specific other legislation if, by definition, they are defined as indigent persons or people with disabilities, in the form of allowances by electricity traders and authorized distribution network operators to the extent specified in detail in other legislation.” (Electricity Act; 2007 article 64). The vulnerable cus- tomer status is not automatic, the customer has to apply for the status. “Customers with disabilities are of- fered certain privileges in connection with metering, reading and billing procedures, and payment terms, as consistent with their respective needs” (Electricity Act; 2007 article 64). So, the Hungarian legislation recognises that there are households, which are not always able to meet their payment obligations.
3. Energy poverty in Hungary
In the previous chapter we could see that there are several indicators for energy poverty. However, quantifying is not always possible, either there are no reliable data, or simply the indicator is not a number.
In this chapter we use the available data for Hungary, although in some cases there are no current data, but it could show a picture nonetheless. In our study we primarily use data from the Hungarian Central Statis-
tical Office and Eurostat, but also Energy Poverty Observatory has surveys, therefore we use the data from EPOV as well. Most of the cases we use data from 2010 and 2016. The reason for this that we have data for these two years particularly and these shows a trend of change from 2010 to 2016 as in Hungary regulated prices for energy sources were introduced in 2013. Additionally, we can see how energy poverty indicators have changed by the energy price reduction. If we have the data for 2017 and 2018, it is indicated.
The 3 main factors for energy poverty are income, energy prices and energy efficiency of households.
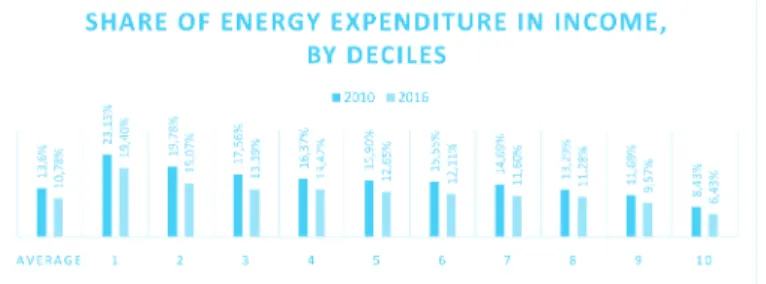
One of the first European definitions for energy poverty was Broadman’s (1991), which states that if a household spends 10% of its income on energy that it could be considered energy poor (Herrero-Ürge- Vorsatz; 2014). The 1. Figure shows that in Hungary even the average share of energy expenditure is above 10% in 2016, therefore we needed some distinction and the Hungarian Central Statistical Office has data for the various income groups (the households are divided to 10 income groups equally, so each decile represents 1/10 of the domestic households). The share is counted as the energy expenditure of household per capita in that deciles divided by the per capita income in the deciles. We can see that the energy expenditures even in the 8th income deciles are higher than 10%, but it is also true that the higher the income the less percent the household spent on energy. In 2016 the European Commission had a report on energy prices and costs and in 2014 Hungary has had the 2nd highest share on energy expenditures compared to income in the EU behind Slovakia (European Commission; 2016). This position has improved by today. However, we could not replicate the Commission’s calculation methodology, according to the Hungarian Energy and Public Utility Regulatory Authority (HEA) Hungary is close to the European average by 2019 and the Hungarian residential gas and electricity prices are one of the lowest in Europe (HEA; 2019). We have the statistics from 2010 and compared to 2016 the share of the households energy expenditure has decreased in every decile. The decreasing share in the national average is mainly due to the increasing income per capita; the average energy expenditure remained at the same level as it was in 2010. It could be a surprising data since it was a utility cost reduction in 2013 in Hungary. Therefore it could have been assumed that a cost reduction in energy would reduce the household’s expenditure, since the energy consumption of households has not increased (Eurostat; 2019a). The data of the energy expenditures and energy prices of the Hungarian Central Statistical Office (2019a,c) shows that the utility cost reduction affected electricity and natural gas prices, these have decreased, but the cost of solid fuel has increased. Therefore the households spending’s in electricity and natural gas have reduced, but solid fuel expenditures have increased. The two impacts neutralized the average energy expenditures. However, the average share of the energy expenditures in income has decreased, the national average is higher than 10%. This makes Broadman’s (1991) definition unusable in Hungary.
1. Figure: The share of energy expenditure in income by deciles in 2010 and 2016
Source: (Hungarian Central Statistical Office; 2019a,c)
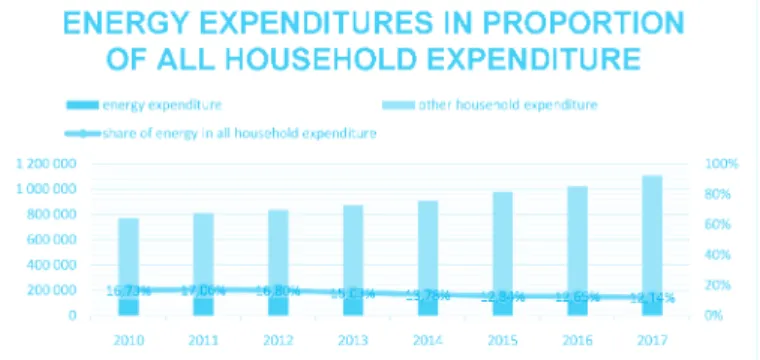
The share of energy expenditures is even higher if we compare energy expenditures to all household expenditure instead of income per capita (Figure 2.). Although it has a decreasing trend from 2010, the data (Hungarian Central Statistical Office; 2019b) clarifies that Hungarian households do not spend less on energy, but the expenditure level is higher, so households spend more on other products.
According to the Insight_E indicator list, low income and high energy share raise affordability issues. The indicators are income, energy prices and energy consumption level. As it was previously mentioned the income level has increased in Hungary (Hungarian Central Statistical Office; 2019a).
The energy prices (natural gas, electricity and district heating) have been regulated since 2013. It means for household customers that the utility fees have been capped, so the price for energy sources per unit could not increase. Even though nowadays Hungary has almost the cheapest energy sources for households (HEA; 2019), the energy expenditure proportion of either income or all household expenditure are still high. However, it is true that the Hungarian primary energy consumption level has increased, but the household consumption is about the same level as it was in 2010 or even slightly decreased (Eurostat; 2019a). Therefore, everything is given for energy affordability to rise in Hungary.
2. Figure: Energy expenditure in proportion of all household expenditure 2010-2017
Source: (Hungarian Central Statistical Office; 2019c)
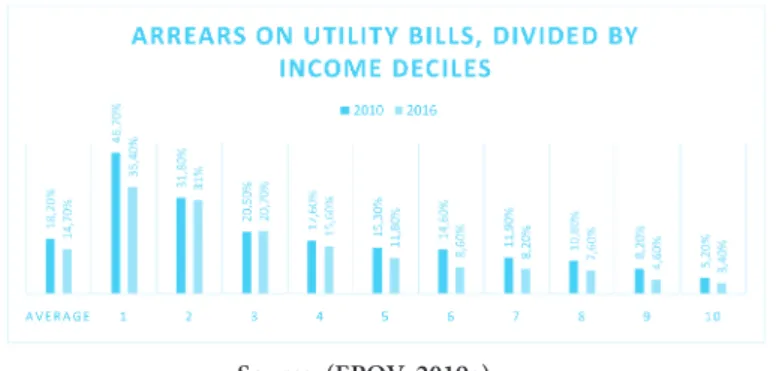
To go into details in energy affordability aspect of energy poverty, EU Energy Poverty Obser- vatory has a primary indicator list with some available data on Hungary. The arrears on utility bills have been assessed by the EPOV in 2016 latest. Even in 2016 an average 14.7% of the Hun- garian households were late or unable to pay their utility bills. It also shows a significant impro- vement from 2010 to 2016. (EPOV; 2019a). Also it is not a surprising finding that the lower the income deciles a household in, the higher the arrears rate. The EU average was 10.5%, Greece has the highest arrears share within the EU with 36.2%. Hungary is the 5th in this rating. (EPOV;
2019a). The indicator is rather high in the first 4 deciles (Figure 3) and shows that Hungary needs to focus on these customers and the vulnerable customer status is a necessity, as these households could not afford the energy they consume and should not be exposed to a volatile market pricing mechanism. Although they also need to raise their awareness in their energy consumption.
3. Figure: Arrears on utility bills, divided by income deciles in 2010 and 2016.
Source: (EPOV; 2019a)
Another affordability indicator for energy poverty from EPOV, is the inability to keep the home adequa- tely warm. The data divided by income deciles is available until 2016. The research was made by questi- onnaire and they asked the following: “Can your household afford to keep its home adequately warm?”
(EPOV; 2019d). The meaning of adequately warm were to decide by the households as it was up to the personal feeling of the respondent. The data shows, that in Hungary in 2016 more than 10% of the hous- eholds felt that their home was not adequately warm, which indicator also decreased from 2010. In the first 3 deciles, the data are rather high and measures should be taken to reduce the number of households where the resident are cold. However, by 2016 Hungary was under the EU average value (11.2%) (EPOV; 2019d).
It should be noted that the EU Energy Poverty Observatory data are not consistent with the data from Eurostat (2019b). Eurostat collects the same data, with the same definition, but has different value. According to the Eurostat data in 2010 10.7% of the Hungarian population felt that they cannot afford to keep their home adequately warm. The value went up to 15% in 2012 and decreased to 9.2% in 2016 until 6.1% in 2018. Eurostat (2019b) has no data for deciles. In comparison, according to Eurostat (2019b) Hungary was under the EU average (7.5%) in 2018.
4. Figure: Inability to keep home adequately warm by income decile in 2010 and 2016.
Source: (EPOV; 2019d)
The EU Energy Poverty Observatory has a primary indicator for energy poverty which is a reverse affordability. Unfortunately, EPOV only has this statistics for 2010. The indicator shows the percentage of households, which has low energy expenditures compared to the rest of households. The official de- finition: „whose absolute energy expenditure is below half the national median” (EPOV; 2019b). There are two types of households that can spend relatively low on energy: Either the household energy
efficiency level is really high, or as the EPOV website defines: “it may also be indicative of households dangerously under-consuming energy” (EPOV; 2019b). Looking closer the actual numbers in Figure 4, it seems that the Hungarian 5% is due to the latter, as the poorest 1 million (the first deciles) has the highest share, therefore we believe that it is safe to assume that these households are under consuming energy. The indicator is really low in the higher deciles, where energy efficiency could have explained the numbers. The EU average was almost 15% in 2010 and Sweden had the highest value with 31%.
5. Figure: Low absolute energy expenditure in income deciles 2010
Source: (EPOV; 2019b)
Going beyond the affordability dimension of energy poverty the Insight_E indicator list has two other dimensions: housing patterns and energy use patterns.
In the cross section of low income and poor energy efficiency there is the housing patterns dimension. The indicators are the tenure system and housing characteristics. According to a deep survey about the housing system (called: “Where we live?”) made by the Hungarian Central Statistical Office (2016) in Hungary 89% of the dwellings are occupied by the owner or empty (the data shows that a bit more than 12% of the dwellings was uninhabited). Only 11% of the dwellings could be rented in 2015. Although the data are from 2015, and since than we can assu- me some increasing trend in the rentable apartments, we can state that most of the households own their apartments. The Insight_E study assumes that the higher the tenure rates the less likely the population invest in measures such as energy efficiency. Compared to Europe, Hungary is in the lower half with this indicator, the EU average is almost 30% of rented dwellings.
For housing characteristics, the best data are from 2013. However, knowing that the housing pat- tern is not a rapidly changing indicator, the data are still relevant. The Ministry for National Deve- lopment has commissioned an outlook over the Hungarian building stock, as part of the National Building Energy Performance Strategy (NBPES; 2015). The Strategy used 4 criteria for classifying the domestic building stock and identified 15 types. The criteria were: the size of the building (number of apartments); the year of construction; technology; floor area of the building. The building’s energy efficiency classification was not part of the project. However, there is an approximate primary energy consumption calculated for each of the 15 building types. The domestic building stock can by classi- fied as the following if we remove the year of construction from the characterisation (NBEPS; 2015):
• Family/detached houses: 56.3%
• Multi-apartment buildings of less than 10 apartments: 12.6%
• Residential buildings constructed of prefabricated panels: 11.9%
• Residential buildings of more than 10 apartments other than buildings constructed of prefabricated panels: 19.2%
According to the Insight_E study (2015), one of the factors that determines the household’s energy demand is housing. The study indicates that detached houses have a greater energy demand than apart- ments. Detached houses are the majority of the buildings in Hungary with more than 56%. Further analysing the data in Hungary Insight_E study finding (2015) seems to be true. The National Building Energy Performance Strategy has a summary table about the building performances, and only the fa- mily/detached houses that have been built after 1991 are more energy efficient than other types of buildings. Naturally the most efficient (with the least amount of energy consumption) building type is the non-panel multi-apartment building with 10 or more apartments, which was built after 2001. The share of this type (type 15) was 5% in 2013. However, the share of the detached house built before 1991 was over 51% (type 1-5). Therefore, it is safe to assume, that if Hungary includes the building’s energy performance to the energy poverty definition, then it could widen the circle of energy poor households.
The third dimension of the Insight_E (2015) energy poverty indicators was the energy use pattern, as it was in the cross section of high energy bills and poor energy efficiency. The indicators were the energy consumption and the type of heating system. The energy consumption of households is fluctuating from 1990 until 2017. It reached its maximum with 292 PJ in 2005 and the minimum was 230 PJ in 2014. The latest data is from 2017, when the household’s energy consumption was 264PJ (Eurostat; 2019a). There is no trend, the energy consumption depends on energy prices, income levels as well as on the weather and many other factors. In 2017 47% of the consumed energy was natural gas, 26% was biomass (mostly wood), 16% electricity, 8% heat (district heating) and 2% solid fuel (lignite), 1% other (Eurostat; 2019a).
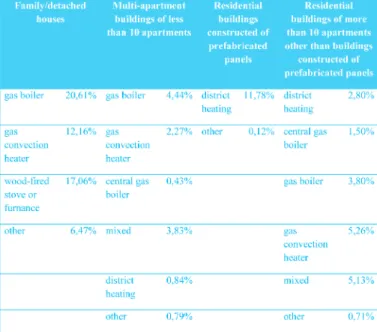
The type of the heating system shares is approximately mirroring the consumption pattern.
As Table 1 shows most of the households uses natural gas-based heating system. The second most common heating system is wood-based (mixed are the co-firing furnace, which in Hunga- ry is also wood or other combustible material).
1. Table: Heating systems used in residential buildings if the domestic building stock is considered 100%
Source: based on (NBEPS; 2015 p.30)
The Insight_E study (2015) has found a connection between the central/collective heating system and the energy poverty rate of the Member States. The study showed that Member States with the lowest estimated energy poverty rate have a high share of central/collective heating system (Insight_E; 2015 p. 15). In the case of Hungary, the share of the central heating system is relatively low, as most of the households are detached houses with individual heating systems.
Moreover, individual boilers or convection are common in multi-apartment building as well (NBEPS; 2015). Therefore, in Hungary district heating systems is relevant for this indicator. Alt- hough Insight_E study (2015) also mentions that central heating systems do not mean more energy efficiency automatically, as district heating system could be outdated especially in Eastern Europe, where in some cases the households could not even adjust the heat level.
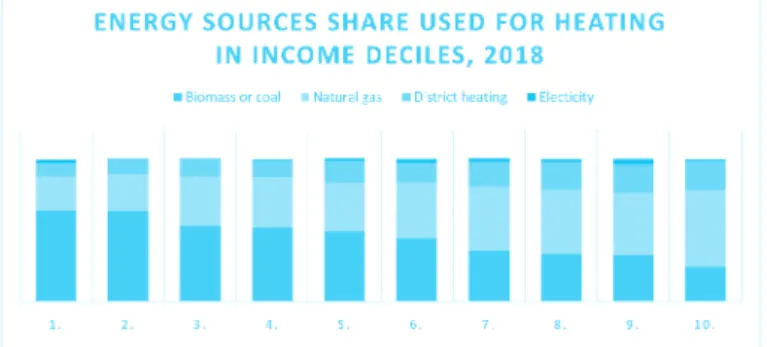
Further analysing the dimension of energy use patterns, it is interesting to take a look at the energy sources used by income deciles in Hungary. Figure 6 shows that the less income a hous- ehold has, the more likely that they use biomass (wood or other combustible material) for heating.
6. Figure: Energy sources share used for heating in income deciles, 2018 (100%)
Source: (Hungarian Central Statistical Office; 2019b)
4. Conclusion
In the absence of a unified European energy poverty definition we assessed the literature about the energy poverty concerning the EU Member States to measure the possible energy poor households in Hun- gary. According to the Insight_E study (2015) the estimated Hungarian energy poverty rate is about 17-18%.
There is a consensus in the current European literature that energy poverty has 3 main fac- tors: income, energy prices and energy efficiency of households. Most of the literature uses these 3 factors and gives indicators for the energy poverty definition.
The most extensive definition would be based on the energy expenses per income level. In the case of Hungary, a benchmark should be based on the national median, as a simple energy expense per income level share would be too general.
The Hungarian Central Statistical Office has had an estimation in 2014. They find that if the energy poverty line is twice the median of energy expenses per income rate, then the Hungarian energy po- verty line would be 30% (as the median is 15%) of energy expenses per income, which would mean that about 380 thousand households are energy poor. It is approximately 10% of all households in Hungary.
However, adding the general poverty line to the definition, the energy poverty rate rise up to 21% of the households, including approximately 800 thousand households (Fülöp – Lehoczki-Krsjak; 2014).
Adding the energy efficiency dimension to the definition would be preferential, but from the heating system alone we could only have simplified conclusions, as detached houses that built before 1991 are the less energy efficient. According to the Hungarian Central Statistical Office study, 75-80% of energy poor lives in detached house (Fülöp – Lehoczki-Krsjak; 2014). Though there is more to that dimension, given that every sold house has to have an energy certificate, these data have to be collected, but it is not publicly available.
From our findings it is safe to say that if a household consumes solid energy sources for heating (such as wood or coal) than it is more likely to be energy poor. However, energy poverty definition should not include it as an indicator, as it is not true for all household with a solid energy source based heating system.
The nationwide energy consumption data shows no tendencies. However, energy traders have data about the various profile of the consumption categories (based on the annual consumption rate) that could give a more sophisticated approach for establishing a definition for energy poverty.
Therefore, when defining energy poverty in Hungary the Government has a relative wide range of possibilities depending on how extensive definition is the best for Hungarian customers.
References
Electricity Act (2007): 2007. évi LXXXVI. törvény a villamos energiáról https://net.jogtar.hu/
jogszabaly?docid=A0700086.TV (retrieved: 12th of June 2019)
European Commission (2016):: Report from the Commission to the European Parliament, The Council, The European Economic and Social Committee and the Committee of the Regions Energy prices and costs in Europe Brussels, 30.11.2016, COM (2016) 769 final http://ec.europa.eu/transparency/regdoc/rep/1/2016/EN/COM-2016-769-F1-EN-MAIN.
PDF (retrieved: 10th of June 2019)
EU Energy Poverty Observatory (2019) webpage: www.energypoverty.eu (retrieved: 14th of June 2019) EU Energy Poverty Observatory (2019a): Arrears on utility bills https://www.energypoverty.eu/
indicator?primaryId=1462 (retrieved: 14th of June 2019)
EU Energy Poverty Observatory; (2019b): Low absolute energy expenditure https://www.energy- poverty.eu/indicator?primaryId=1463 (retrieved: 14th of June 2019)
EU Energy Poverty Observatory; (2019c): High share of energy expenditure in income (2M) https://www.energypoverty.eu/indicator?primaryId=1460 (retrieved: 14th of June 2019) EU Energy Poverty Observatory; (2019d): Inability to keep home adequately warm https://www.
energypoverty.eu/indicator?primaryId=1461 (retrieved: 14th of June 2019)
European Parliament and Council (2018): Regulation 2018/1999 of 11 December 2018 on the Governance of the Energy Union and Climate Action
European Parliament and Council (2019a): Directive 2019/944 of 5June 2019 on common rules for the internal market for electricity and amending Directive 2012/27/EU
European Parliament and Council (2019b): Regulation 2019/943 of 5 June 2019 on the internal market for electricity
Eurostat; (2019a): Complete energy balances http://appsso.eurostat.ec.europa.eu/nui/show.
do?dataset=nrg_bal_c&lang=en (retrieved: 12th of June 2019)
Eurostat; (2019b) Population unable to keep home adequately warm by poverty status https://
ec.europa.eu/eurostat/tgm/table.do?tab=table&init=1&language=en&pcode=sdg_07_60
&plugin=1 (retrieved: 12th of June 2019)
Fellegi Dénes - Fülöp Orsolya (2012): Szegénység vagy energiaszegénység: Az energiaszegénység defi- niálása Európában és Magyarországon. Energiaklub 2012. január. Elérhető: https://energiaklub.
hu/tanulmany/szegenyseg-vagy-energiaszegenyseg-3224. (retrieved: 12th of June 2019) Fülöp Orsolya – Lehoczki-Krsjak Adrienn (2014): Energiaszegénység Magyarországon. Statisz-
tikai Szemle, 92. évf., 8–9. szám, pp. 820–831.
Herrero, S. T. - Ürge-Vorsatz, D. (2014): Energiaszegénység Magyarországon, első értékelés. Éghaj- latváltozási és Fenntartható Energiapolitikai Központ (3CSEP), Közép-európai Egyetem (CEU), Budapest.
Herrero, Sergio Tirado - Ürge-Vorsatz, Diana (2012): Trapped in the heat: A post communist type of fuel poverty. Energy Policy, 49 (2012) pp. 60–68. https://doi.org/10.1016/j.enpol.2011.08.067 Hungarian Energy and Public Utility Regulatory Authority (HEA), (2019) Household Energy
Price Index for Europe 29th of May 2019 http://mekh.hu/download/6/09/a0000/HEPI_
Press_Release_May_2019.pdf (retrieved: 14th of June 2019)
Hungarian Statistical Office (2019a): 2.2.1.1. Az összes háztartás adatai jövedelmi tizedek (deci- lisek), régiók és a települések típusa szerint (2010–) [forint] http://www.ksh.hu/docs/hun/
xstadat/xstadat_eves/i_zhc014a.html (retrieved: 12th of June 2019)
Hungarian Statistical Office (2019b): 2.2.3.2. Lakással kapcsolatos adatok jövedelmi tizedek (de- cilisek), régiók és a települések típusa szerint (2011). http://www.ksh.hu/docs/hun/xstadat/
xstadat_eves/i_zhc019a.html (retrieved: 12th of June 2019)
Hungarian Statistical Office (2019c): 2.2.3.4. Az egy főre jutó éves kiadások részletezése COICOP- csoportosítás, jövedelmi tizedek (decilisek), régiók és a települések típusa szerint (2010–) [fo- rint]. http://www.ksh.hu/docs/hun/xstadat/xstadat_eves/i_zhc021a.html (retrieved: 12th of June 2019)
Hungarian Statistical Office (2019d): 3.6.4. Fogyasztóiár-indexek az egyéni fogyasztás rendelte- tés szerinti osztályozása (COICOP) alapján http://www.ksh.hu/docs/hun/xstadat/xstadat_
eves/i_qsf004b.html (retrieved: 12th of June 2019)
Insight_E (2015): Energy poverty and vulnerable consumers in the energy sector across the EU:
analysis of policies and measures. Elérhető: https://ec.europa.eu/energy/sites/ener/files/
documents/INSIGHT_E_Energy%20Poverty%20-%20Main%20Report_FINAL.pdf. (ret- rieved: 14th of June 2019)
National Building Energy Performance Strategy (NBEPS) 2015, adopted by Government Dec- ree No 1073/2015 of 25 February 2015. https://ec.europa.eu/energy/sites/ener/files/docu- ments/2014_article4_hungary_en%20translation.pdf (retrieved: 12th of June 2019) The Fundamental law of Hungary (2011): Magyarország Alaptörvénye (2011. április 25.) https://net.jogtar.hu/jogszabaly?docid=A1100425.ATV (retrieved: 12th of June 2019)
Thomson, Harriet –Snell, Carolyn (2016): Az energiaszegénység definíciói és indikátorai az Európai Unióban in.: Csiba Katalin szerk.: Kézikönyv az energiaszegénységről. DOI:
10.2861/207858
Thomson, Harriet –Snell, Carolyn–Liddell, Christine (2016): Fuel poverty in the European Union: A concept in need of definition? People Place and Policy Online, 10(1), pp.5-24.
DOI:10.3351/ppp.0010.0001.0002