High-Resolution Adhesion Kinetics of EGCG-Exposed Tumor Cells on Biomimetic Interfaces: Comparative Monitoring of Cell Viability Using Label-Free Biosensor and Classic End-Point Assays
Beatrix Peter,
†,‡Rita Ungai-Salanki,
‡,§,∥Ba ́lint Szabó,
‡,§,∥Agoston G. Nagy,
‡Inna Szekacs,
‡Szilvia Bősze,
⊥and Robert Horvath*
,‡†Doctoral School of Molecular and Nanotechnologies, Faculty of Information Technology, University of Pannonia, Egyetem utca 10, H-8200 Veszprem, Hungarý
‡Nanobiosensorics Group, Hungarian Academy of Sciences, Research Centre for Natural Sciences, Institute for Technical Physics and Materials Science, Konkoly-Thege M. ut 29-33, H-1120 Budapest, Hungarý
§Department of Biological Physics, Eötvös Lorand University, Pá zmá ny P. sé ́tany 1/A, H-1117 Budapest, Hungarý
∥CellSorter Company for Innovations, Erdőalja út 174, H-1037 Budapest, Hungary
⊥MTA-ELTE Research Group of Peptide Chemistry, Hungarian Academy of Sciences, Eötvös Lorand University, 112, P.O. Box 32,́ H-1518 Budapest, Hungary
ABSTRACT: A high-throughput label-free resonant waveguide grating biosensor, the Epic BenchTop, was utilized to in situ monitor the adhesion process of cancer cells on Arg-Gly-Asp tripeptide displaying biomimetic polymer surfaces. Using highly adherent human cervical adenocarcinoma (HeLa) cells as a model system, cell adhesion kinetic data with outstanding temporal resolution were obtained. We found that pre-exposing the cells to various concentrations of the main extract of green tea, the (−)-epigallocatechin gallate (EGCG), largely affected the temporal evolution of the adhesion process. For unexposed and low dosed cells, sigmoid shaped spreading kinetics was recorded. Higher dose of EGCG resulted in a complete absence of the sigmoidal character, and displayed adsorption-like kinetics. By using the first derivatives of the kinetic curves, a
simple model was developed to quantify the sigmoidal character and the transition from sigmoidal to adsorption-like kinetics.
The calculations showed that the transition happened at EGCG concentration of around 60 μg/mL. Using the 3-(4,5- dimethylthiazol-2-yl)-2,5-diphenyltetrazolium bromide end-point assay, we concluded that EGCG is cytostatic but not cytotoxic.
The effect of EGCG was also characterized byflow cytometry. We concluded that, using the introduced label-free methodology, the shape of the cell adhesion kinetic curves can be used to quantify in vitro cell viability in a fast, cost-effective, and highly sensitive manner.
■
INTRODUCTIONNatural compounds are becoming more and more popular in biomedicine, especially in cancer treatment and to develop novel antimicrobial agents.1−4 Tea catechins, especially (−)-epigallocatechin gallate (EGCG), have been shown to have various health benefits, for example, anti-metastasis, anticancer, anti-inflammatory, and antioxidant properties, and can prevent cardiovascular disease as well.5−8EGCG is one of the most studied active substances, and many studies observed its effects on several cancer and normal cell types, and in animal models.4 This compound has significant impact on cell adhesion and movement, apoptosis, and proliferation, generally by altering gene expression.4,5,9−11 Tea polyphenols are well known for their antioxidant activities, too.5,12 Among them, EGCG is the most effective compound interacting with reactive oxygen species.13EGCG and other catechins are unstable at
high temperature and under alkaline and neutral conditions;
EGCG oxidizes and dimerizes easily5,12,14at pH above 7.5,12,14 In an aqueous solution, it changes from noncolored at around natural pH to yellow at higher pH; the absorption in the UV range becomes more pronounced.4,5,15
Determination of cell viability is a critical step in screening the efficacy of compounds, when evaluating the response to cytotoxic moiety. Flow cytometry is a sensitive and mainstream method to determine compound-induced cytotoxic effects and cell death. The main advantage of the method allows the analysis on a per-cell basis usingfluorescent dyes to enter viable or dead cells. Propidium-iodide (PI) is a polar, fluorescent
Received: December 1, 2017 Accepted: March 5, 2018 Published: April 5, 2018
Article Cite This:ACS Omega2018, 3, 3882−3891
License, which permits unrestricted use, distribution and reproduction in any medium, provided the author and source are cited.
compound and can only enter cells that lack membrane integrity. After PI staining, nonviable cells show a bright red fluorescence, whereas viable cells remain nonfluorescent.16 Using the plate-based 3-(4,5-dimethylthiazol-2-yl)-2,5-diphe- nyltetrazolium bromide (MTT) method, the membrane permeability and mitochondrial activity of the cells were determined in metabolically active cells.17
However, most of the label-based assays have serious disadvantages, for example, labeling techniques usefluorescent
markers that may affect normal cell behavior and the imaging time is often limited by the low signal and the bleaching of the marker.5
Detection of cellular adhesion is of significant diagnostic and basic research utility. Changes in cell adhesion can be a sign for various illnesses; for example, the variety of integrins, a major group of cell adhesion receptors that bind to the extracellular matrix, changes during tumor transformation.5Measurement of the effect of bioactive substances on the adhesion of tumor cells Figure 1.Schematic illustration of the working principle of the Epic BT biosensor. An optical biosensor found in each well is illuminated by a broadband light source. The biosensor contains a grating coupled planar optical waveguide and its surface can be coated with a protein or polymer of interest. Light coupled into the waveguide creates a resonant mode and a corresponding evanescentfield penetrating to a depth of 150 nm above the sensor surface. Any refractive index change inside the evanescentfield shifts the resonant wavelength of light reflected back from the biosensor. The biosensor signal is the wavelength shift of the reflected light. (A) If there is no change in the evanescentfield, there is no signal. (B) The cell attaches but does not adhere onto the biosensor surface. This phenomenon represents an adsorption kinetic curve, which indicates a nonliving,“dead”
process. Note, it also occurs when proteins adsorb onto the surface. (C) The cells adhere onto the biosensor surface. This phenomenon represents a sigmoidal kinetic curve, which indicates a“living”process. (D) Schematic graph of the difference (Δλ) between the resonant peak wavelengths of the reflected lights. The equipment plots theΔλdata in time during the experiment (see C and B).
can be an effective tool in the design of antineoplastic pharmaceuticals.5 A wide range of previously existing and well-documented, conventional label-based experimental meth- ods are available to assess cellular processes such as in vitro cell viability and adhesion.5,18−25
Label-free biosensors, not requiring the usage of dyes, have the ability to become a routine tool for measuring cell adhesion, spreading, proliferation, signalization, and cytotoxicity as well.5 These techniques are especially promising when the real-time kinetics of interactions have to be investigated.
In the measurements of label-free techniques, biomimetic surfaces are usually applied as coatings to create circumstances that resemble the real biological conditions. The biomimetic
surfaces mimic the materials that occur in vivo, but these artificial substrates are simpler to hand, they need less preparations, and the created coatings are more reproducible.
Poly(L-lysine)-graf t-poly(ethylene glycol) (PLL-g-PEG) is a biomimetic polycationic copolymer with poly(ethylene glycol) (PEG) chains covalently grafted onto a positively charged PLL backbone. It spontaneously adsorbs from the aqueous solution via electrostatic interactions onto negatively charged surfaces such as tissue culture polystyrene, TiO2,Nb2O5, and SiO2.5,26,27 However, several studies have shown that it can also adsorb onto nonpolar, hydrophobic poly(dimethylsiloxane) (PDMS) surfaces from the aqueous solutions. The PEG side chains stretch into the bulk aqueous solution to generate a brushlike Figure 2. Summarized schematic illustration of the label-free method employing the Epic BT biosensor. Cells were pre-exposed to various concentrations of EGCG and then transferred to the biosensor wells to record their adhesion and spreading on the RGD displaying polymer surfaces. As the most striking observation, cell spreading with low concentration of EGCG or without EGCG shows sigmoidal-like kinetic curves (active, living process), whereas treatments with high concentration of EGCG result in adsorption-like kinetic curves (dead process).
ACS Omega
waveguide gratings arranged in a 96- or 384-well array format.
In each well, the resonant wavelength of the waveguide is monitored, which is sensitive to refractive index variations above the sensing surface. This surface-sensitive high- throughput label-free technique was previously demonstrated to monitor cell signaling and adhesion.5,30−35 Thanks to its excellent temporal resolution, the cellular adhesion can be recorded with unprecedented data quality.30 This feature is exploited in the present work by investigating the shapes of the cell adhesion kinetic curves in detail. A simple model is created to quantify the shape of the kinetic curves. The results of the label-free investigations are compared with classical MTT assay and flow cytometry employing PI staining. Our work demonstrates a novel way to measure cell viability in a fast, label-free, and highly sensitive manner.
■
RESULTS AND DISCUSSIONIn vitro effect of EGCG on cellular viability was accessed by three different methods using HeLa cells: (i) to analyze real- time cell adhesion kinetics, (ii) to determine metabolic activity using colorimetric MTT assay, and (iii) to quantify dead or dying cells by cytofluorometry with PI staining.
The plate-based EPIC system is suitable for observing adhesive parameters in real time as physiologically relevant and quantitative data related to the cellularfitness and viability. The optical core of the sensing procedure is schematically illustrated inFigure 1. Using classic end-point tetrazolium reduction, the cytostatic or cytotoxic activity can be determined through enzymatic activity as a marker of viable cells generating a signal that is proportional to the number of viable cells.
Adhesion Kinetics of EGCG Pre-Exposed Cells Recorded by the Optical Biosensor. The schematic illustration of the employed methodology is summarized in Figure 2. One can observe an interesting phenomenon on the kinetic curves measured by Epic BT.
If the cells can well adhere and spread, sigmoidal-like curves can be monitored as a characteristic pattern of living cells (living process). In contrast, at higher concentration, adsorption-like curves imply that the observed change is due to dying or dead cells (dead process). Note, the adsorption-like curves are typically observed when discrete objects are adsorbing on a solid surface. In this case, the main driving force is the unoccupied surface area; therefore, the adsorption is fastest at the very beginning, when the free surface area is maximal. In contrast, the sigmoidal kinetics require an active, self-catalytic, and self-controlled mechanism, a unique charac- teristics of the living cells.
In these measurements, we both monitored the sigmoidal- and adsorption-like kinetic curves, depending on the
cellsinstead of active adhesionmay even secrete some cell- specific compounds at higher extract concentrations.) This border concentration is approximately 40−50 μg/mL, above which the EGCG has harmful effects on the cancer cells.
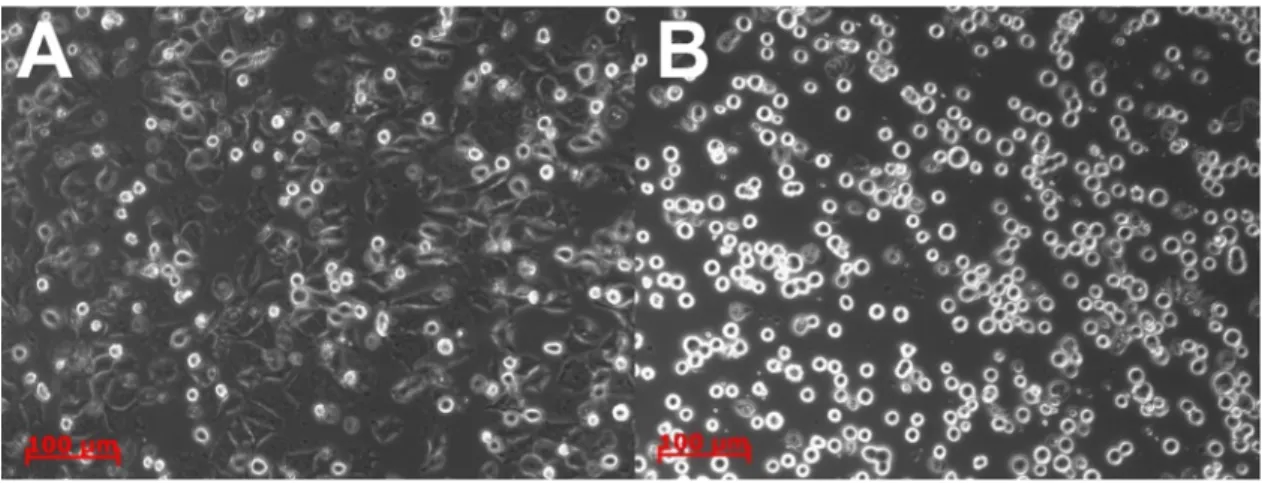
Following the EGCG preincubation, our observation was that the size of the cells shrunk and their shape, spreading, and adhesive properties also changed. The microscopy images (Figure 4) clearly show that at low EGCG concentrations (0− 40μg/mL), the cells could well adhere and spread; after the 2 h period, the cells almost formed a homogeneous layer on the RGD displaying a biosensor surface. However, at higher EGCG concentrations of 40−50 μg/mL, the shape of the cells changed; they are not as spread as the other cells with lower concentrations or without green tea extract. At higher quantities, the cells remained rounded. The observation of the same phenomenon can be followed on the kinetic curves as mentioned earlier.
In Vitro Cytotoxic and Cytostatic Activity of the Compound EGCG on HeLa Cell Culture (MTT assay).
Tetrazolium salts are widely used for in vitro assessment of metabolic activity of cells. 3-(4,5-Dimethylthiazol-2-yl)-2,5- diphenyltetrazolium bromide (MTT) reduction is one of the most frequently used methods for measuring cytotoxicity and cell proliferation.36 HeLa cells were treated with EGCG at 0.064−500μg/mL concentration range and the viability of the cells was determined by using the MTT assay.
The 50% inhibitory concentration (IC50) values were determined from the dose−response curves. We found that EGCG exhibited a modest, but not negligible cytotoxic effect on HeLa cells (IC50> 500 μg/mL). From the dose−response curves, it can be observed that the results obtained with the Epic BT measurements are reconcilable: the transition concentration is probably 20−30 μg/mL in the MTT cell cytotoxicity assay as well. The cytostasis assay (at 0.064−1000 Figure 3. Kinetic cell adhesion curves recorded by Epic BT. The plotted lines represent the averaged values of the three parallel experiments. For obtaining these data, the cells were preincubated with solutions having different EGCG concentrations. After, these treated cells were pipetted into the biosensor wells and cell adhesion was monitored for 2 h. It is clearly seen that increasing the EGCG concentration decreases the sigmoidal character of the kinetic curves.
For the highest EGCG concentrations, the sigmoidal character is completely missing and adsorption-like curves are recorded.
μg/mL concentration range) shows higher inhibitory concen- trations.
Evaluation of Viability Profiles of EGCG-Treated HeLa Cells by Flow Cytometry.The cells were exposed to EGCG for 1.5 h. Following the exposure and removal of EGCG by washing and trypsinization of the cells, they were transferred to the FACS tubes and stained with PI. As HeLa is an adherent culture, when preparing the samples for assay, the cells is carefully harvested to avoid the loss or damage of a certain subpopulations, and the cells are thoroughly processed to single-cell suspension before PI staining. The data shown are typical of those obtained from repeated experiments. The spontaneous cell death due to sample preparation was determined for untreated control cells (5−10% of death). For maximum lysis (100% of death), the cells were incubated at 37
°C with 20μL of saponin at 0.3 mg/mL (data not shown). A threshold was set on the forward scatter to exclude cell debris or any artifacts. The gates that were obtained with FACSDiva software and used for data acquisition. The gated dead cells were displayed on a histogram of log-scale redfluorescence of PI to enable the differentiation between dead and live HeLa cells. The cell death was expressed as the percentage of PI positive cells.
Quantification of the Shape of the Label-Free Kinetic Curves: Comparison with Classical Cell Viability Assays.
We analyzed the kinetic curves of the Epic BT in more detail by using the following ideas. First, the kinetic data were differentiated (first derivative) and the following parameter was calculated.
λ λ
Δ = Δ
− Δ
t t =
d d
d d t
max 0 (1)
Δλ t d
d max is thefirst derivative maximal value, Δλ
t t= d
d 0is thefirst derivative at thet= 0 timepoint (seeFigures 6and7for more details). Note, in the actual calculations, the first derivative recorded at 2.5 min was used instead of thefirst derivative att= 0 due to practical reasons.
The parameter Δ characterizes the shape of the kinetic curves in a straightforward manner. Simply, ifΔ> 0 pm/min, the recorded curve has a sigmoidal character. For all adsorption-like curves (having the maximum of the first
derivative att= 0), the parameter Δis zero. Therefore, these two types of behaviors can be well distinguished.
The schematic illustration of the method is seen inFigure 5 with all of the relevant parameters highlighted. The time dependency of the first derivatives for the actual biosensor measurements are plotted inFigure 6.
Figure 4.Microscopic images of the cells after the measurement in the Epic BT microplate wells. (A) Cells without EGCG treatment could spread onto the surface and form adhesive contacts. (B) Cells treated with 250μg/mL EGCG (highest concentration) remained rounded and spreading was inhibited. Scale bar: 100μm. The differences between the cells treated by the lowest EGCG concentrations cannot be detected by phase contrast microscopy (images not shown). Note, in contrast, the label-free kinetic curves well demonstrate the differences even at low EGCG concentrations (seeFigure 3for more details).
Figure 5.Schematic illustration of the calculation method to reveal the transition EGCG concentration from the Epic BT data from sigmoidal- to adsorption-like curves. (A) Typical sigmoidal- and adsorption-like kinetic curves. (B) Thefirst derivative of the curves plotted in (A) with the parameters appearing in the equation ofΔ highlighted. In case of adsorption-like curves, the parameter Δis 0 because thefirst derivative at t = 0 timepoint is equal to the first derivative’s maximum value.
ACS Omega
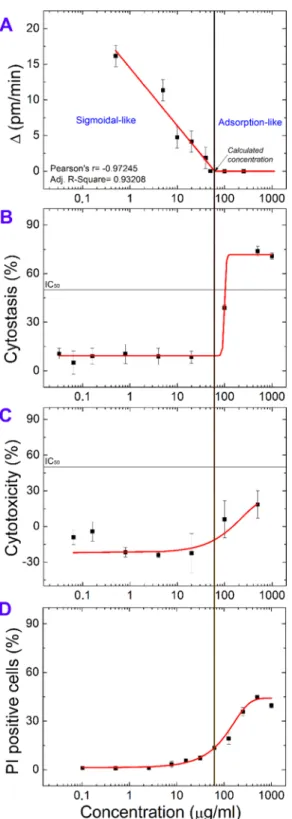
Next, the Δ values for various EGCG concentrations were plotted with the concentration data at the x-axis (logarithmic scale), and the data points were fitted with a linear curve (Figure 7A). The Δ values are 0 pm/min at concentrations higher than 40 μg/mL and >0 at lower concentrations. The exact transition concentration is 60±40μg/mL, calculated by linear extrapolation (Figure 7A). The error of the calculation is estimated from the standard errors of the linearfit. To compare the label-free data with thefindings of the labeling methods, we plotted the MTT cytostasis (Figure 7B), cytotoxicity (Figure 7C), andflow cytometry results (Figure 7D).
The calculated transition concentration is compatible with the MTT assay because this is the point where thefitted dose− response curve (cytostatic activity) starts to increase as well.
From the results shown inFigure 7, the novel method based on Epic BT seems to be much more sensitive because it shows evident dose dependence even under effective, transition concentration as well, whereas the other two MTT curves do not show a difference. Therefore, there is a dose-dependent noncytotoxic effect as well, which can be clearly monitored and highlighted by Epic BT. Therefore, the above protocol might serve as an alternative way to quantitatively characterize cell viability in a completely label-free and highly sensitive manner.
In general, the Epic BT assay was more sensitive than the flow cytometric or MTT assay. The MTT assay gave results approximately comparable to those from the flow cytometric assay. In comparing theflow cytometric with the MTT assay, we find higher standard deviations with the flow cytometric assay (standard deviation less than 10−15% of mean versus 6− 8% for the MTT assay).
Moreover, Epic BT is a high-throughput and fast method.
Only 1 h would have been enough to receive the maximum values of the derivative curves (see Figure 6). These features make this measurement technique highly cost-effective too, when compared with standard biosensing equipment having a single measurement channel. Significant amount of time can be saved by performing hundreds of experiments in a single run.
Moreover, the status of the cells and the condition of the reagents are always the same in these parallel performed experiments. It should be also emphasized that the results obtained by the biosensor are not affected by any molecules typically used for labeling and possibly even interacting with the investigated compounds.
Figure 6.First derivatives of the kinetic curves recorded by Epic BT (and plotted inFigure 4). Data corresponding to HeLa cells treated by EGCG from 0 to 250μg/mL concentrations and a buffer control is shown. It is clearly seen that the character of the kinetic curves drastically changes as the EGCG concentration is increased.
Figure 7. Calculated dose−response curves and the transition concentration compared with the results of the MTT and cytofluorimetric assays. (A) Plotted andfittedΔvalues. On the left, Δ> 0 pm/min, indicating an active cell spreading process. On the right, at higher EGCG concentrations, Δ values are 0 pm/min, showing an adsorption-like process. The transition concentration between these two types of behaviors is 60±40μg/mL, calculated by linear extrapolation. (B) Result of the in vitro cytostatic activity assay.
It shows higher inhibitory concentrations than cytotoxicity test. (C) Result of the in vitro cytotoxicity assay (MTT assay). EGCG exhibited a modest, but not negligible cytotoxic effect on HeLa cells (IC50> 500 μg/mL). (D) Result of the in vitroflow cytometry assay. Cell death rate was expressed as the percentage of PI positive cells.
■
CONCLUSIONSCell-based assays are widely used to determine if a compound has a cytostatic activity or a direct cytotoxic effect leading to cell death. To access cellular viability plays an important role in the functional characterization of a molecule. There are wide variety of cell viability methods that provide accurate picture of cytostatic and cytotoxic activity, such as colometric assays and cytofluorimetric analysis of individual cells. Previous studies have shown that EGCG can inhibit cell adhesion,5,23,24,37and this extract has an obstructive effect not just on cancer cell adhesion but also on cell movement and can induce apoptosis too,9,23,24,37−39whereas EGCG has an influence on cell viability as well. The classic colorimetric end-point method to evince this effect is the MTT assay; however, both MTT- and 3-(4,5- dimethylthiazol-2-yl)-5-(3-carboxymethoxyphenyl)-2-(4-sulfo- phenyl)-2H-tetrazolium (MTS)-based assays underestimate the antiproliferative effect of EGCG. This phenomenon is probably due to the increased activity of mitochondrial dehydrogenase in response to the EGCG treatment, as well as the intrinsic potential of EGCG to reduce MTT and MTS and increase the formation of formazan.17 Thus, a careful evaluation of the applied method is essential for the in vitro assessment of cell viability and proliferation17after EGCG treatment.
To monitor compound-induced, real-time dose response, label-free technologies were demonstrated to be robust, but sensitive tools with high statistical significance and reduced artifacts.32,40,41
In this study, the Epic BTa novel high-throughput label- free RWG biosensorwas applied to study the effect of EGCG on the kinetics of cancer cell adhesion. The recorded real-time adhesion curves were compared with the data of MTT andflow cytometric cell viability assays.
On the basis of the kinetic information, we identified normal spreading curves, i.e., an active process of living HeLa cells, at EGCG concentrations lower than 60 μg/mL. Above this concentration, we observed simple adsorption curves lacking normal cell spreading, i.e., a cytostatic effect on HeLa cells is seen. We calculated that 60 ± 40 μg/mL is a transition concentration between the two types of kinetic curves by developing a straightforward mathematical methodology. This concentration value is the starting point of the increasing part of the fitted cell viability cytostatic curve obtained from the MTT assays. Our results show that the high-throughput Epic BT biosensor can be successfully applied in cytotoxicity assays with a superior sensitivity.
Our technique offers a noninvasive, label-free, cost-effective platform to characterize cell viability with a high sensitivity and an accurate correlation with the conventional (classical) tetrazolium method. Furthermore, this appliance distinguishes the differences between the efficacy caused by very low EGCG concentrations as well, whereas the effects of low concen- trations were too small to be reliably defined by the colorimetric or flow cytometry methods. These data points were represented as scattered flat sections (plateaus) on the respective graphs. The intensity of the measured signal (effect of EGCG based on absorbance or intracellular fluorescence intensity) is not detectable or difficult to quantify; the small changes produced by low concentrations of EGCG become lost within the base noise.
Using the label-free method, the observation range was considerably extended due to the enhanced signal-to-noise ratios. The data evaluation and the quantification of the
differences are simpler in the case of Epic BT as well. Thus, it may have an important role in biomedical research, for example, in early or second stage drug candidate testing due to its predictive ability. In our opinion, another possible scope of the introduced methodology is the testing of cytostatic or cytotoxic compounds on different tumor cells even from patients to find drugs that are harmful to the drug-resistant tumor cells as well. One would be able to measure a lot of active substances simultaneously in a very short time (in approximately 1 h); 16 drugs with their 8 concentrations or 8 drugs with their 16 concentrations in the case of a 384-well plate in triplicates. In this measurement/diagnostic, the spread cells could be separated from the dead ones in thefirst run, and then the survived cells could be treated with other active compounds in the second run.
■
MATERIALS AND METHODSSynthetic Polymer Solutions.The synthetic copolymers, poly(L-lysine)-graf t-poly(ethylene glycol) (PLL-g-PEG, [PLL(20)-g(3.5)-PEG(2)]) (hereafter PP) and its RGD f u n c t i o n a l i z e d c o u n t e r p a r t , P L L -g- P E G / P E G - GGGGYGRGDSP (PLL-g-PEG-RGD [PLL(20)-g(3.5)-PEG- (2.3)/PEG(3.4)-RGD]) (hereafter PPR), were obtained as powders from SuSoS AG, Dübendorf, Switzerland. The materials were stored at−20 °C until use. Each powder was then dissolved in 10 mM 4-(2-hydroxyethyl)-1-piperazine ethanesulfonic acid (HEPES, Sigma-Aldrich Chemie GmbH, Schelldorf, Germany) at pH 7.4 to make stock the solutions with a concentration of 1.0 mg/mL. The coating solution with RGD motifs and PLL-g-PEG were prepared by mixing the two 1 mg/mL stock solutions (hereafter PP/PPR).5,30
Preparation of EGCG Solutions. The EGCG powder (Sigma-Aldrich Chemie GmbH, Schelldorf, Germany) was solved in 10 mM HEPES at pH 7.4, or in an assay buffer (Hank’s Balanced Salt Solution (HBSS, Sigma-Aldrich Chemie GmbH, Schelldorf, Germany) containing 20 mM HEPES, pH 7.0, hereafter HBSS−HEPES). The concentration of the dissolved EGCG solution was 1, 10, 20, 40, 80, 100, 200, and 500μg/mL, resulted in afinal concentration of 0.5, 5, 10, 20, 40, 50, 100, and 250 μg/mL, respectively, in the biosensor wells.
Cell Culture and Cell Adhesion Assay Buffer.HeLa cells (ECACC 93021013 human, cervix, epitheloid, carcinoma) were routinely cultured in tissue culture polystyrene Petri dishes (Greiner Bio-One International GmbH, Kremsmünster, Aus- tria) placed in a humidified incubator (37°C, 5% CO2). The cells were maintained in Dulbecco’s modified Eagle’s medium (DMEM), supplemented with 10% fetal bovine serum (FBS, Biowest SAS, France), 4 mM L-glutamine, 0.25 μg/mL amphotericin B, 100 U/mL penicillin, and 100 μg/mL streptomycin solution. On reaching 80% confluence, the cells were detached every 3−4 days using 0.05% (w/v) trypsin and 0.02% (w/v) ethylenediaminetetraacetic acid (EDTA) solution and not used beyond passage 20.6,38 The cell adhesion assay buffer was prepared by adding 20 mM HEPES to HBSS and adjusted to pH 7.0 with a 1 mM NaOH.5,30
Epic Benchtop Resonant Waveguide Grating Bio- sensor.We used the Epic BenchTop (BT) system (Corning Incorporated, Corning, NY), a next-generation resonant waveguide grating (RWG) imager biosensor. It accepts 96- or 384-well Society for Biomolecular Screening standard format biosensor microplates. The bottom of the microplate is a planar optical waveguidea thin, high refractive index, transparent ACS Omega
wave) over the biosensor surface shifts the resonant wavelength to λ′. The refractive index variation can be caused by, for example, bulk refractive index change, molecular adsorption, cell spreading, or dynamic mass redistribution inside the cells.
The primary signal output of the Epic BT system is the shift in the resonant wavelength (Δλ= λ′ −λ) in each well.5,30
EGCG Pretreatment of Cancer Cells and the Biosensor Measurement.Wells were given 30μL assay buffer to prewet the sensors and establish a baseline with the RWG imager.
Following the stabilization of the biosensor signal, the measurement was stopped and the buffer was replaced with 30 μL of the coating solution and incubated for 0.5 h while gently shaking at room temperature.30 The coating solutions were then removed and the wells were rinsed three times with 30μL of the assay buffer, the polymers adsorbed to the surface irreversibly. Wells were then dosed with 30μL assay buffer for the fourth time to establish a new baseline for the subsequent room temperature cell spreading assay.30 HeLa cells were trypsinized with 1× prewarmed trypsin−EDTA. Trypsin was removed before complete detachment of HeLa cells and its activity arrested by adding culture medium containing 10%
FBS.30Harvested cells were centrifuged at 380gfor 6 min and the cell pellet was resuspended in assay buffer with intensive pipetting. Cell suspensions and EGCG solutions (in different concentrations) were pipetted in 1:1 ratio into 9 eppendorf tubes (with a total volume of 340μL in each tubes), and they were incubated together for 3 min. Later, we centrifuged them again for 6 min at 380g. We removed the supernatant from the cells, and the assay buffer was added to the cells. The 20 000 treated cells/well were pipetted into the biosensor wells, without replacing the plate from the Epic BT. Spreading was monitored until saturation of the biosensor signals. Averaging every 5 subsequent data points, the effective sampling rate was 1/15 s−1.3030 At the end of the biosensor measurement, the microplate was placed under a Zeiss Observer microscope to visually observe and image the cells with a 20×objective (all wells were completelyfilled up with assay buffer and covered with a microscope slide to improve imaging quality by eliminating the disturbing meniscus).30 All experiments were done in triplicates in three different wells at room temperature, and only the averaged data were used for further processing.5,30 MTT Cell Viability Assay.HeLa cells were plated into a 96- well plate with an initial cell number of 12 500 per well. After 24 h incubation at 37 °C, the cells were treated with the compound EGCG in 200μL serum-free medium or in 200μL HBSS−HEPES buffer. The cells were incubated with the compounds at 0.064 to 500 or 1000 μg/mL concentration range for 2 h. The control cells were treated with serum-free medium only or with HBSS−HEPES buffer at 37 °C for 2 h.
calculated using the following equation
= − ×
cytotoxicity/cytostasis %
[1 (ODtreated/ODcontrol)] 100 (2)
where ODtreated and ODcontrol correspond to the optical densities of the treated and the control cells, respectively. In each case, two independent experiments were carried out with four parallel measurements. The 50% inhibitory concentration (IC50) values were determined from the dose−response curves, which were defined using a MicrocalTM Origin1 (version 8.6) software.
Flow Cytometry.Before cell plating, the plates were coated with PP/PPR 1:1 v/v (total volume of 10 μL, shaking for 3 min, after washing with 200μL of HBSS buffer three times).
HeLa cells (1 ×10⁵ cells per well) were plated in 24-well plates. The cells were stimulated with the medium alone, or with EGCG (0.0039−1 mg/mL) solutions for 1.5 h. After treatment, the supernatants were removed and the cells were washed with serum-free DMEM media and then the adherent cells were treated with 100μL trypsin solution (Sigma, 2.5 g/L porcine trypsin solution in 0.9% sodium chloride), trypsin digestion was blocked using HPMI buffer (20 mM HEPES, 132 mM NaCl, 3.5 mM KCl, 0.5 mM MgCl2, 5 mM glucose, 1 mM CaCl2 [pH 7.4])43 supplemented with 10% (wt/vol) fetal bovine serum (FBS, Sigma) and the cells were collected by centrifugation at 300gfor 5 min and then washed twice with the serum-free HPMI buffer. The pellets were resuspended in the HPMI buffer.
The cell viability was assessed using 10μg/mL PI solution (for the gating strategy, fluorescence parameters were gated using unstained and the PI-stained untreated control cells, and 10 000 cells were counted for each treatment). PI was excited at 488 nm, using a BD LSR IIflow cytometer (BD Biosciences, San Jose, CA) Coherent Sapphire, 22 mW laser. After staining, the intracellularfluorescence intensity of the cells was measured on channel PE LP550 and the data were analyzed with a FACSDiva 5.0 software. All measurements were performed in triplicates.
■
AUTHOR INFORMATION Corresponding Author*E-mail: horvath.robert@energia.mta.hu.
ORCID
Robert Horvath:0000-0001-8617-2302 Author Contributions
R.H. established the research line and supervised the current work. B.P. conducted all biosensor experiments. R.U.-S. and
A.G.N. helped in the experiments. I.S. and S.B. maintained the cell culture. B.S. took part in biology-related discussions. S.B.
conducted the MTT and flow cytometry experiments. The methodology to quantify the kinetic curves was developed by R.H. B.P. and R.H. analyzed the data. B.P. prepared the manuscriptfigures and tables. The manuscript text was written by B.P., S.B., and R.H. All authors reviewed and commented on the manuscript.
Notes
The authors declare no competingfinancial interest.
■
ACKNOWLEDGMENTSThis work was supported by the Momentum Program (“Lendület”) of the Hungarian Academy of Sciences, Hungarian Research Fund (OTKA 104275) and by the ERC_HU and KH_17 programs of NKFIH. The project was subsidized by the European Union and co-financed by the European Social Fund. Images were created by Photoshop and ChemBioDraw Ultra.
■
(1) de Pace, R. C. C.; Liu, X.; Sun, M.; Nie, S.; Zhang, J.; Cai, Q.;REFERENCES Gao, W.; Pan, X.; Fan, Z.; Wang, S. Anticancer Activities of (−)-Epigallocatechin-3-Gallate Encapsulated Nanoliposomes in MCF7 Breast Cancer Cells.J. Liposome Res.2013,23, 187−196.(2) Shukla, R.; Chanda, N.; Zambre, A.; Upendran, A.; Katti, K.;
Kulkarni, R. R.; Nune, S. K.; Casteel, S. W.; Smith, C. J.; Vimal, J.;
Boote, E.; Robertson, J. D.; Kan, P.; Engelbrecht, H.; Watkinson, L.
D.; Carmack, T. L.; Lever, J. R.; Cutler, C. S.; Caldwell, C.; Kannan, R.; Katti, K. V. Laminin Receptor Specific Therapeutic Gold Nanoparticles (198AuNP-EGCg) Show Efficacy in Treating Prostate Cancer.Proc. Natl. Acad. Sci. U.S.A.2012,109, 12426−12431.
(3) Gordon, N. C.; Wareham, D. W. Antimicrobial Activity of the Green Tea Polyphenol (-)-Epigallocatechin-3-Gallate (EGCG) against Clinical Isolates of Stenotrophomonas Maltophilia.Int. J. Antimicrob.
Agents2010,36, 129−131.
(4) Peter, B.; Bosze, S.; Horvath, R. Biophysical Characteristics of Living Cells Exposed to the Green Tea Polyphenol Epigallocatecin-3- Gallate (EGCg): Review of Recent Advances from Molecular Mechanisms to Clinical Trials.Eur. Biophys. J.2017,46, 1−24.
(5) Peter, B.; Farkas, E.; Forgacs, E.; Saftics, A.; Kovacs, B.; Kurunczi, S.; Szekacs, I.; Csampai, A.; Bosze, S.; Horvath, R. Green Tea Polyphenol Tailors Cell Adhesivity of RGD Displaying Surfaces:
Multicomponent Models Monitored Optically. Sci. Rep. 2017, No. 42220.
(6) Mukhtar, H.; Ahmad, N. Tea Polyphenols: Prevention of Cancer and Optimizing Health.Am. J. Clin. Nutr.2000,71, 1698S−1702S.
(7) Suzuki, Y.; Isemura, M. Binding Interaction between (−)-Epi- gallocatechin Gallate Causes Impaired Spreading of Cancer Cells on Fibrinogen.Biomed. Res.2013,34, 301−308.
(8) Mereles, D.; Hunstein, W. Epigallocatechin-3-Gallate (EGCG) for Clinical Trials: More Pitfalls than Promises?Int. J. Mol. Sci.2011, 12, 5592−5603.
(9) Ahmad, N.; Gupta, S.; Mukhtar, H. Green Tea Polyphenol Epigallocatechin-3-Gallate Differentially Modulates Nuclear FactorκB in Cancer Cells versus Normal Cells.Arch. Biochem. Biophys. 2000, 376, 338−346.
(10) Gu, J.; Makey, K. L.; Tucker, K. B.; Chinchar, E.; Mao, X.; Pei, I.; Thomas, E. Y.; Miele, L. EGCG, a Major Green Tea Catechin Suppresses Breast Tumor Angiogenesis and Growth via Inhibiting the Activation of HIF-1α and NFκB, and VEGF Expression. Vasc. Cell 2013,5, No. 9.
(11) Weber, A. A.; Neuhaus, T.; Skach, R. A.; Hescheler, J.; Ahn, H.
Y.; Schrör, K.; Ko, Y.; Sachinidis, A. Mechanisms of the Inhibitory Effects of Epigallocatechin-3 Gallate on Platelet-Derived Growth
Factor-BB-Induced Cell Signaling and Mitogenesis.FASEB J.2004,18, 128−130.
(12) Hong, J.; Lu, H.; Meng, X.; Ryu, J.; Hara, Y.; Yang, C. S.
Stability, Cellular Uptake, Biotransformation, and Efflux of Tea Polyphenol (−)-Epigallocatechin-3-Gallate in HT-29 Human Colon Adenocarcinoma Cells.Cancer Res.2002,62, 7241−7246.
(13) Tachibana, H. Green Tea Polyphenol Sensing.Proc. Jpn. Acad., Ser. B2011,87, 66−80.
(14) Hirun, S.; Roach, P. D. A Study of Stability of (-)-Epigallocatechin Gallate (EGCG) from Green Tea in a Frozen Product.Int. Food Res. J.2011,18, 1261−1264.
(15) Mizooku, Y.; Yoshikawa, M.; Tsuneyoshi, T.; Arakawa, R.
Analysis of Oxidized Epigallocatechin Gallate by Liquid Chromatog- raphy/ Mass Spectrometry.Rapid Commun. Mass Spectrom.2003,17, 1915−1918.
(16) Moore, A.; Donahue, C. J.; Bauer, K. D.; Mather, J. P.
Simultaneous Measurement of Cell Cycle and Apoptotic Cell Death.
InMethods in Cell Biology; Academic Press, 1998; Vol.57, pp 265−
278.
(17) Wang, P.; Henning, S. M.; Heber, D. Limitations of MTT and MTS-Based Assays for Measurement of Antiproliferative Activity of Green Tea Polyphenols.PLoS One2010,5, No. e10202.
(18) Horvath, R.; McColl, J.; Yakubov, G. E.; Ramsden, J. J.
Structural Hysteresis and Hierarchy in Adsorbed Glycoproteins. J.
Chem. Phys.2008,129, No. 071102.
(19) Janshoff, A.; Kunze, A.; Michaelis, S.; Heitmann, V.; Reiss, B.;
Wegener, J. Cell Adhesion Monitoring Using Substrate-Integrated Sensors.J. Adhes. Sci. Technol.2010,24, 2079−2104.
(20) Wegener, J.; Keese, C. R.; Giaever, I. Electric Cell-Substrate Impedance Sensing (ECIS) as a Noninvasive Means to Monitor the Kinetics of Cell Spreading to Artificial Surfaces.Exp. Cell Res.2000, 259, 158−166.
(21) Wegener, J.; Seebach, J.; Janshoff, A.; Galla, H. J. Analysis of the Composite Response of Shear Wave Resonators to the Attachment of Mammalian Cells.Biophys. J.2000,78, 2821−2833.
(22) Hide, M.; Tsutsui, T.; Sato, H.; Nishimura, T.; Morimoto, K.;
Yamamoto, S.; Yoshizato, K. Real-Time Analysis of Ligand-Induced Cell Surface and Intracellular Reactions of Living Mast Cells Using a Surface Plasmon Resonance-Based Biosensor. Anal. Biochem. 2002, 302, 28−37.
(23) Peter, B.; Nador, J.; Juhasz, K.; Dobos, A.; Korosi, L.; Székács, I.;
Patko, D.; Horvath, R. Incubator Proof Miniaturized Holomonitor to in situ Monitor Cancer Cells Exposed to Green Tea Polyphenol and Preosteoblast Cells Adhering on Nanostructured Titanate Surfaces:
Validity of the Measured Parameters and Their Corrections.J. Biomed.
Opt.2015,20, No. 067002.
(24) Chan, C.-M.; Huang, J.-H.; Chiang, H.-S.; Wu, W.-B.; Lin, H.- H.; Hong, J.-Y.; Hung, C.-F. Effects of (-)-Epigallocatechin Gallate on RPE Cell Migration and Adhesion.Mol. Vis.2010,16, 586−595.
(25) Mosmann, T. Rapid Colorimetric Assay for Cellular Growth and Survival: Application to Proliferation and Cytotoxicity Assays. J.
Immunol. Methods1983,65, 55−63.
(26) Pasche, S.; Vrs, J.; Griesser, H. J.; Spencer, N. D.; Textor, M.
Effects of Ionic Strength and Surface Charge on Protein Adsorption at PEGylated Surfaces.J. Phys. Chem. B2005,109, 17545−17552.
(27) Lee, S.; Spencer, N. D. Adsorption Properties of poly(L- Lysine)-Graft-Poly(ethylene Glycol) (PLL-G-PEG) at a Hydrophobic Interface: Influence of Tribological Stress, pH, Salt Concentration, and Polymer Molecular Weight.Langmuir2008,24, 9479−9488.
(28) Pasche, S.; Textor, M.; Meagher, L.; Spencer, N. D.; Griesser, H.
J. Relationship between Interfacial Forces Measured by Colloid-Probe Atomic Force Microscopy and Protein Resistance of Poly(ethylene Glycol)-Grafted poly(L-Lysine) Adlayers on Niobia Surfaces.
Langmuir2005,21, 6508−6520.
(29) Orgovan, N.; Ungai-Salanki, R.; Luká csi, S.; Sá ndor, N.; Bajtay,́ Z.; Erdei, A.; Szabó, B.; Horvath, R. Adhesion Kinetics of Human Primary Monocytes, Dendritic Cells, and Macrophages: Dynamic Cell Adhesion Measurements with a Label-Free Optical Biosensor and ACS Omega
(34) Fang, Y. Label-Free Cell-Based Assays with Optical Biosensors in Drug Discovery.Assay Drug Dev. Technol.2006,4, 583−595.
(35) Fang, Y. Probing Cancer Signaling with Resonant Waveguide Grating Biosensors.Expert Opin. Drug Discovery2010,5, 1237−1248.
(36) Liu, Y.; Peterson, D. A.; Kimura, H.; Schubert, D. Mechanism of Cellular 3-(4,5-Dimethylthiazol-2-Yl)-2,5-Diphenyltetrazolium Bro- mide (MTT) Reduction.J. Neurochem.1997,69, 581−593.
(37) Melgarejo, E.; Medina, M. Á; Sánchez-Jiménez, F.; Urdiales, J. L.
Epigallocatechin Gallate Reduces Human Monocyte Mobility and Adhesion in Vitro.Br. J. Pharmacol.2009,158, 1705−1712.
(38) Tudoran, O.; Soritau, O.; Balacescu, O.; Balacescu, L.; Braicu, C.; Rus, M.; Gherman, C.; Virag, P.; Irimie, F.; Berindan-Neagoe, I.
Early Transcriptional Pattern of Angiogenesis Induced by EGCG Treatment in Cervical Tumour Cells.J. Cell. Mol. Med.2012,16, 520−
530.
(39) Hayakawa, S.; Saeki, K.; Sazuka, M.; Suzuki, Y.; Shoji, Y.; Ohta, T.; Kaji, K.; Yuo, A.; Isemura, M. Apoptosis Induction by Epigallocatechin Gallate Involves Its Binding to Fas.Biochem. Biophys.
Res. Commun.2001,285, 1102−1106.
(40) Xi, B.; Yu, N.; Wang, X.; Xu, X.; Abassi, Y. A. The Application of Cell-Based Label-Free Technology in Drug Discovery. Biotechnol. J.
2008,3, 484−495.
(41) Pamenter, M. E.; Haddad, G. G. High-Throughput Cell Death Assays.Methods Mol. Biol.2015,1254, 153−163.
(42) Denizot, F.; Lang, R. Rapid Colorimetric Assay for Cell Growth and Survival. Modifications to the Tetrazolium Dye Procedure Giving Improved Sensitivity and Reliability.J. Immunol. Methods 1986,89, 271−277.
(43) Kapuslo, A.; Grinsteinm, S.; Kandasamyll, R.; Orlowskill, J.
Functional Characterization of Three Isoforms of the Na +/H + Exchanger Stably Expressed in Chinese Hamster Ovary Cells.J. Biol.
Chem.1994,269, 23544−23552.