5.2 LABOUR MOBILITY IN HUNGARY
Júlia Varga
The occupational composition of all dynamic economies changes constant- ly: new occupations emerge and some of the old occupations disappear. This process is influenced by numerous factors: changes in technology, foreign trade, the composition of the population in terms of age and educational at- tainment level, and the regulatory environment and labour market institu- tions. In addition, individuals may also change jobs for several reasons: the insufficient alignment of qualification and job, changes in personal circum- stances (such as marital status or health), changes in the labour market, career progress or the search period typical of the early phases of a labour market career (job-shopping), etc.
One of the preconditions of labour mobility is the transferability of (some of ) the skills and knowledge across professions. Therefore, school education, higher education, training and lifelong learning policies have a profound im- pact on labour mobility. In countries where education policy places empha- sis on acquiring general knowledge and encourages participation in lifelong learning, there is more labour mobility and it is easier to adjust to changing labour market demands. However, in countries where school education focuses on occupation-specific knowledge, labour mobility is more limited (Johnson, 1979; Krueger–Kumar, 2004; ILO, 2010).
Low labour mobility may increase labour shortage. It hinders the continu- ous adaptation of businesses and slows down the flow of labour from declin- ing industries to expanding ones (see for example Davis–Haltiwanger, 2014).
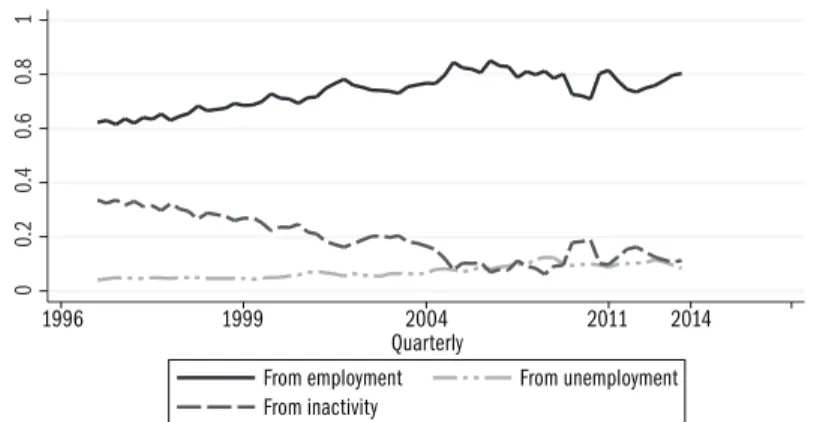
Although some of the newly created jobs are filled by fresh graduates as well as returnees from inactivity and unemployment, the majority is filled by work- ers previously employed in other occupations. Figure 5.2.1 presents the com- position of entrants to newly created jobs broken down by prior labour mar- ket status (using four-digit HSCO codes) in the period between 1997 and 2014. The findings show that the share of entrants from inactivity decreased and the share of entrants from unemployment stagnated, while the share of entrants from another occupation increased from 60 per cent to 80 per cent.
The proportion of those entering newly created jobs from unemployment slightly grew after 2004 but entrants previously employed in other occupa- tions still have a significant role.
In the following it is discussed how the intensity of labour mobility has changed in Hungary and what individual characteristics influence the prob- ability of switching occupations. The analysis is based on the individual-level data of the panel database developed from the data collections of the LFS of the Central Statistical Office between 1997–2014.1 As in earlier studies,
1 The quarterly LFS surveys of the Central Statistical Office cover approximately 70 thou- sand persons in each quarter.
The sample is replaced in a ro- tation procedure. Individuals of households included in the sample are observed for six con- secutive quarters and in this way the data of individuals observed in the consecutive quarters may be integrated in a panel, which enables the observation of their occupational changes.
00.20.40.60.81
From employment From unemployment From inactivity
1996 1999 2004 2011 2014
Quarterly
labour mobility is measured by changes in the occupational classifications over two consecutive quarters (Boeri–Flinn, 1997; Berde–Scharle, 2004;
Elek–Szabó, 2016). The value of and change in this indicator depends on the timeframe and the level of aggregation of the occupational classification used for measuring mobility. Not even the most detailed, four-digit HSCO occupational classification can describe all occupational changes. Individu- als may progress considerably in their career without changing their origi- nal occupational classification. Several amendments have been made to the HSCO classification, which also makes the tracking of occupational changes more complicated. In the period examined (1997–2014), there was a major revision of the HSCO classification.2 In order to facilitate comparison, we merged the two classification systems and re-coded the findings on the ba- sis of the integrated system.3 We analysed the occupational changes of the different qualification levels using three types of classification: the most de- tailed four-digit classification, the two-digit classification and the aggregated occupational groups.4
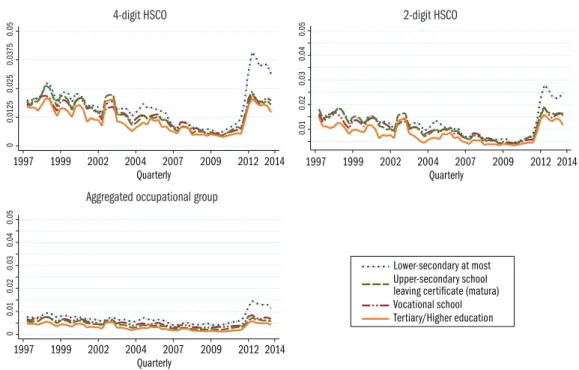
Figure 5.2.2 presents the proportions of occupation changers among em- ployees, analysed according to the four-digit and two-digit HSCO classifica- tion and the aggregated occupational groups. Obviously, the more detailed is the classification used, the higher the proportion of occupation changers.
Figure 5.2.1: The composition of entrants to newly created jobs broken down according to prior labour market status
Source: Calculated form the quarterly data collections of the LFS of the HCSO.
The extent of mobility in the total of all qualification levels ranged between 0.5–0.8 per cent in the aggregated occupational groups, 0.5–1.8 per cent in the two-digit and 0.7–2.5 per cent in the four-digit HSCO classification quarterly. These proportions are very low by international comparison, much lower than in the majority of European countries, lower than in the low la- bour mobility level of the Southern European countries and are only compa- rable to some former communist countries (Andersen et al, 2008; Dex et al,
2 The system of occupations revised in 1996 (HSCO–93) was in effect from 1 January 1997 until 31 December 2010, at which date a newly revised HSCO took effect.
3 The re-coding was undertaken by Melinda Tir and the author is grateful for the input provided by her.
4 �hen developing the aggre-�hen developing the aggre- gated occupational groups, we intended to classify occupations in roughly homogenous groups (the classification is presented in Table A5.2.1 of Annex5.2).
00.01250.0250.03750.05
1997 1999 2002 2004 2007 2009 2012 2014 Quarterly
0.040.050.010.020.03
1997 1999 2002 2004 2007 2009 2012 2014 Quarterly
00.020.030.040.050.01
Lower-secondary at most
Vocational school Upper-secondary school leaving certificate (matura) Tertiary/Higher education 1997 1999 2002 2004 2007 2009 2012 2014
Quarterly
2007; Lalé, 2012; Burda–Bachmann, 2008; Barone et al, 2011; Vavřinová–
Krčková, 2015).
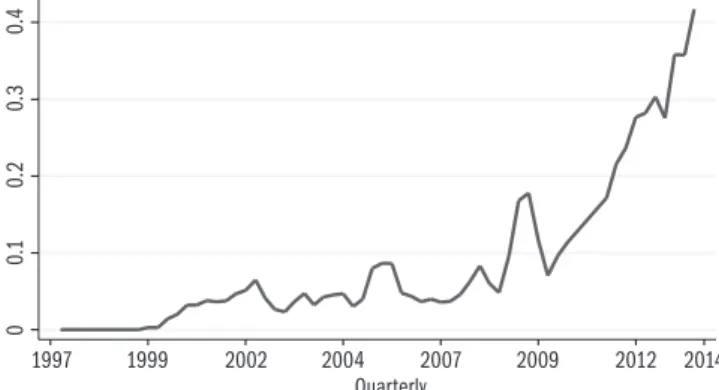
As regards educational attainment levels, the share of occupation changers was the highest among those with a lower secondary qualification at most and it was the lowest among higher education graduates according to each of the classification types. Figure 5.2.2 indicates that the increase in labour mobility after 2011 was considerably larger among those with a lower sec- ondary qualification at most than at other qualification levels. This increase in the labour mobility of the low-qualified was mainly due to the changes in occupations of public works participants. The share of public works par- ticipants among occupation changers with a lower secondary qualification at most started to increase sharply from 2010 and reached 40 per cent in 2014 (Figure 5.2.3).
Figure 5.2.2: The share of occupation changers among employees analysed according to the four-digit and two-digit HSCO classification and the aggregated occupational groups, Q2 1997 – Q1 2014
4-digit HSCO 2-digit HSCO
Source: Author’s calculations using the Q1 1997 – Q1 2014 LFS data of the HCSO, moving average smoothing over three quarters.
The factors of labour mobility were examined using two models. Model (1) analyses the probability of occupation change, regardless of the direction of occupation change (upward, downward or without a change in level) and model (2) analyses a subsample of occupation changers and whether they moved upward, downward or to an occupation at the same level.
Aggregated occupational group
00.10.20.30.4
1997 1999 2002 2004 2007 2009 2012 2014
Quarterly
Figure 5.2.3: The proportion of public works participants among occupation changers with a lower secondary qualification at most
Source: Author’s calculations using the Q1 1997 – Q1 2014 LFS data of the HCSO, moving average smoothing over three quarters.
Model (1) describing the probability of occupation change is as follows:
Yij=X’iβj+α EDi+δj+εij, (1) where Yij indicates the probability of an individual changing occupation, i shows the individuals, EDi the category-level variables describing the educa- tional attainment of the individual and j the outcomes. Xi describes the char- acteristics of the individual, δj the fixed effects of years and εij is a normally dis- tributed random error. Labour mobility (y = 1) takes place when the latent variable Yij > 0, where Yij = 1 if the individual changed occupations between two quarters and Yij = 0 if he did not change occupations.
Model (2) is written as follows:
Ziq=X’iβq+α EDq+δq+εiq, (2) where ηij is multivariate normally distributed. Ziq is the probability of ob- serving the qth outcome in the case of the ith individual and Ziq > Zij if j ≠ q.
We applied the model analysing labour mobility with two outcomes to the various levels of mobility: for occupational changes between two-digit HSCO groups, four-digit HSCO groups and the aggregated occupational groups. We defined occupation changers as those whose two-digit or four-digit HSCO codes or aggregated occupational groups in a quarter and the previous one were different but who were in employment in both quarters.
In the second model, we identified the direction of occupational chang- es on the basis of transfer between one-digit HSCO groups, excluding the group “Occupations in the armed forces”. The HSCO classification is hierar- chical: when moving downwards in the main categories, an increasingly high- er formal qualification and skill level are needed to fill positions. Although one-digit HSCO classification enables only a rough comparison, a more de-
tailed classification would have made it difficult to distinguish between the directions of occupational changes. An upward mobility is defined as a new occupation of smaller value in the one-digit HSCO groups, downward mo- bility is defined as a new occupation with a higher value and unchanged in the occupational hierarchy if the value did not change.
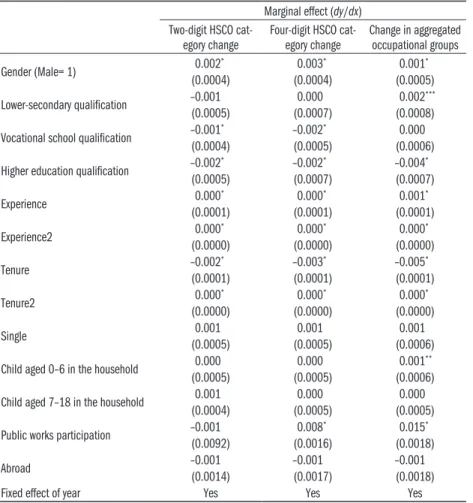
The findings of model (1), with two outcomes for the probability of oc- cupational change – the marginal effects at sample mean – are included in Table 5.2.1. The findings show that higher education graduates are sig- nificantly less likely to change occupations than the reference category of upper-secondary school graduates with a Matura, between either two-digit, four-digit HSCO categories or aggregated occupational groups. Vocational school graduates are also significantly less likely to change occupations be- tween two-digit and four-digit HSCO groups than the reference category and there is no significant difference between vocational school graduates and upper-secondary school graduates with a Matura when considering ag- gregated occupational groups. Neither is there a significant difference be- tween those with a lower-secondary school qualification and upper-second- ary school graduates with a Matura in occupation change between two-digit or four-digit HSCO groups, although the former are more likely to move between aggregated occupational groups.
Our findings on the impact of educational attainment level are in accord- ance with theoretical assumptions about occupation-specific human capital (Shaw, 1984, 1987; Dolton–Kidd, 1998; Kambourov–Manovskii, 2009; Sul- livan, 2010). At educational attainment levels where more occupation-specif- ic skills are obtained – vocational school qualification and higher education qualification in Hungary – labour mobility is lower. This is because occupa- tion-specific skills may be lost upon occupational change and this forces voca- tional graduates to stay in their occupations and higher education graduates to stay in their occupational groups.
Increasing occupation-specific skills tend to decrease the likelihood of la- bour mobility in general. The more time someone spends at an employer, that is, the more occupation-specific skills and expertise they have acquired, the lower the likelihood is of occupational change– according to all of the occu- pational classifications. However, if controlling for tenure at the employer con- cerned, the increase in experience increases the probability of labour mobility.
The estimates show that, controlling for other factors, men are more likely to change occupations than women. Public works participants were also more likely to change occupations when mobility is examined in terms of four-digit HSCO categories or aggregate occupational groups.
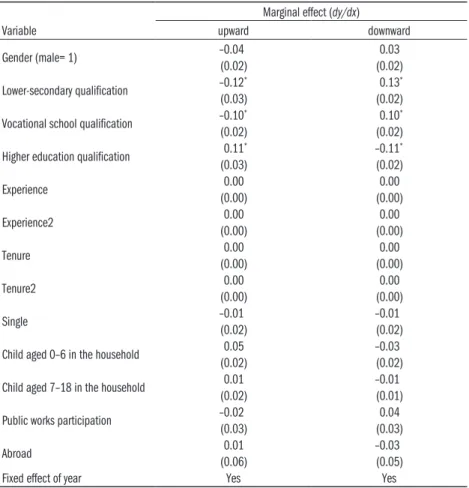
Table 5.2.2 presents the estimates of the determining factors of the direction of labour mobility, that is, the results of the multinomial probit model. The educational attainment level has a significant impact on the direction of la-
bour mobility. Marginal effects indicate that occupation changers with a low- er-secondary qualification are 12 per cent less likely to move upwards and are 13 per cent more likely to move downwards than the reference category of upper-secondary school graduates with a Matura. Vocational school qualifi- cation reduces the probability of upward labour mobility by 10 per cent and increases the probability of downward mobility by 10 per cent. In contrast, higher education graduates are 11 per cent more likely to move upward in the occupational hierarchy and are 11 per cent less likely to move downwards than members of the reference group.
Table 5.2.1: The decisive factors of labour mobility – probit models with two outcomes
Marginal effect (dy/dx) Two-digit HSCO cat-
egory change Four-digit HSCO cat-
egory change Change in aggregated occupational groups
Gender (Male= 1) 0.002* 0.003* 0.001*
(0.0004) (0.0004) (0.0005)
Lower-secondary qualification –0.001 0.000 0.002***
(0.0005) (0.0007) (0.0008)
Vocational school qualification –0.001* –0.002* 0.000
(0.0004) (0.0005) (0.0006)
Higher education qualification –0.002* –0.002* –0.004*
(0.0005) (0.0007) (0.0007)
Experience 0.000* 0.000* 0.001*
(0.0001) (0.0001) (0.0001)
Experience2 0.000* 0.000* 0.000*
(0.0000) (0.0000) (0.0000)
Tenure –0.002* –0.003* –0.005*
(0.0001) (0.0001) (0.0001)
Tenure2 0.000* 0.000* 0.000*
(0.0000) (0.0000) (0.0000)
Single 0.001 0.001 0.001
(0.0005) (0.0005) (0.0006)
Child aged 0–6 in the household 0.000 0.000 0.001**
(0.0005) (0.0005) (0.0006)
Child aged 7–18 in the household 0.001 0.000 0.000
(0.0004) (0.0005) (0.0005)
Public works participation –0.001 0.008* 0.015*
(0.0092) (0.0016) (0.0018)
Abroad –0.001 –0.001 –0.001
(0.0014) (0.0017) (0.0018)
Fixed effect of year Yes Yes Yes
Reference category: female, upper-secondary school graduate with a Matura, not single, without children aged 0–6 in the household, without children aged 7–18 in the household, not public works participant, the site of her employer is not abroad.
*** Significant at a 1 per cent level, ** at a 5 per cent level, * at a 10 per cent level.
Table 5.2.2: Determining factors of the direction of labour mobility Variable
Marginal effect (dy/dx)
upward downward
Gender (male= 1) –0.04 0.03
(0.02) (0.02)
Lower-secondary qualification –0.12* 0.13*
(0.03) (0.02)
Vocational school qualification –0.10* 0.10*
(0.02) (0.02)
Higher education qualification 0.11* –0.11*
(0.03) (0.02)
Experience 0.00 0.00
(0.00) (0.00)
Experience2 0.00 0.00
(0.00) (0.00)
Tenure 0.00 0.00
(0.00) (0.00)
Tenure2 0.00 0.00
(0.00) (0.00)
Single –0.01 –0.01
(0.02) (0.02)
Child aged 0–6 in the household 0.05 –0.03
(0.02) (0.02)
Child aged 7–18 in the household 0.01 –0.01
(0.02) (0.01)
Public works participation –0.02 0.04
(0.03) (0.03)
Abroad 0.01 –0.03
(0.06) (0.05)
Fixed effect of year Yes Yes
Note: Multinomial probit model, reference: the level of occupation remains un- changed following occupational change.
Reference category: female, upper-secondary school graduate with a Matura, not single, without children aged 0–6 in the household, without children aged 7–18 in the household, not public works participant, the site of her employer is not abroad.
*** Significant at a 1 per cent level, ** at a 5 per cent level, * at a 10 per cent level.
The results of the models reveal that there is a lower likelihood of labour mo- bility among those who have acquired more occupation-specific skills either in formal education (for example vocational school graduates and higher edu- cation graduates) or in on-the-job training (those with a longer traineeship at an employer). The low labour mobility among higher education graduates is probably due to the focus of Hungarian higher education on occupation-spe- cific knowledge: students are provided mainly occupation-specific education from the start of their Bachelor studies and this was only slightly altered by the introduction of the Bologna system.
However, higher education graduates and vocational school graduates differ in the direction of their labour mobility. Vocational school graduates are less
mobile and are more likely to move downwards in the occupational hierarchy.
This indicates that on the one hand, changing their occupation is not volun- tary, and on the other hand that they can only use their transferable skills in lower-level jobs. In other words, the level of their general competences does not enable them to move upwards in the occupational hierarchy.
The findings show that the extent of labour mobility may also contribute to labour shortage in Hungary. It is especially worrisome that the occupational changes of vocational school graduates have a downward tendency and that their transferable human capital only enables them to fill lower level occupa- tions.
References
Andersen, T.–Haahr, J. H.–Hansen, M. E.–Holm-Ped- ersen, M. (2008): Job mobility in the European Un- ion: Optimising its social and economic benefits. Final report for the European Commission, DG for Employ- ment, Social Affairs and Equal Opportunities by the Danish Technological Institute.
Barone, C–Lucchini, M.–Schizzerotto, A. (2011):
Career mobility in Italy: A growth curves analysis of occupational attainment in the twentieth century. Eu- ropean Societies, Vol. 13. No. 3. pp. 377–400.
Berde Éva–Scharle Ágota (2004): A kisvállalkozók foglalkozási mobilitása 1992 és 2001 között (Th e la- (The la- bour mobility of the self-employed between 1992 and 2001). In: Közgazdasági Szemle (Economic Review), Vol. 61. No. 4. pp. 346–361.
Boeri, T.–Flinn, C. J. (1999): Returns to Mobility in the Transition to a Market Economy. Journal of Compara- tive Economics, Vol. 27. No. 1. pp. 4–32.
Burda, M. C.–Bachmann, R. (2008): Sectoral Transfor- mation, Turbulance, and Labor Market Dynamics in Germany. IZA Discussion Paper, No. 3324.
Davis, S. J.–Haltiwanger, J. (2014): Labor market flu- idity and economic performance. National Bureau of Economic Research. NBER �orking Paper Series.
No. w20479.
Dex, S.–Lindley, J–Ward, K. (2007): Vertical occupa- tional mobility and its measurement. �orking Paper.
Department of Economics. University of Sheffield.
Dolton, P. J.–Kidd, M. P. (1998): Job changes, occupa- tional mobility and human capital acquisition: An empirical analysis. Bulletin of Economic Research, Vol. 50. No. 4. pp. 265–295.
Elek Péter–Szabó Péter András (2013): A közszférá-
ból történő munkaerő-kiáramlás elemzése Magyar- országon (Analysis of outward labour migration from the public sector in Hungary). In: Közgazdasági Szem-Közgazdasági Szem- le (Economic Review), Vol. 70. No. 5. pp. 601–628.
ILO (2010): A Skilled �orkforce for Strong, Sustainable and Balanced Growth. A G20 Training Strategy. In- ternational Labour Office, Genf, November.
Johnson, W. R. (1979): The demand for general and spe- cific education with occupational mobility. The Re- view of Economic Studies, Vol. 46. No. 4. pp. 695–705.
Kambourov, G.–Manovskii, I. (2009): Occupational specificity of human capital. International Economic Review, Vol. 50. No. 1. pp. 63–115.
Krueger, D.–Kumar, K. B. (2004): Skill-specific rath- er than general education: A reason for US–Europe growth differences? Journal of Economic Growth, Vol.
9. No. 2. pp. 167–207.
Lalé, E. (2012): Trends in occupational mobility in France: 1982–2009. Labour Economics, Vol. 19. No.
3. pp. 373–387.
Shaw, K. L. (1984): A formulation of the earnings function using the concept of occupational investment. Jour- nal of Human Resources, Vol. 19. No. 3. pp. 319–340.
Shaw, K. L. (1987): Occupation change, employer change, and the transferability of skills. Southern Economic Journal, Vol. 53. No.3. pp. 702–719.
Sullivan, P. (2010): Empirical evidence on occupation and industry specific human capital. Labour Econom- ics, Vol. 17. No. 3. pp. 567–580.
Vavřinová, T.–Krčková, A. (2015): Occupational and Sectoral Mobility in the Czech Republic and its Changes during the Economic Recession. Statistika, Vol. 95. No. 3.1 pp. 6–30.
Annex 5.2
Table A5.2.1: Aggregated occupational groups
Occupational group HSCO category Occupational group HSCO category
1 Armed forces Occupations of armed forces requir- ing a higher education qualification;
Occupations of armed forces requir- ing an upper-secondary qualification;
Occupations of armed forces not requiring an upper-secondary qualifi- cation
13 Culture 2 Culture, sports, arts and religion-based occupations not requiring a higher edu- cation qualification
2 Legislation Legislators, heads of public adminis- tration and special interest organisa- tions
14 Trade Trade and catering occupations
3 Management Managing directors, production and
specialised services managers 15 Service Service occupations 4 STEM Technical, information technology and
science professionals 16 Agriculture Agricultural occupations; forestry occupa- tions; game-farming occupations; fisher- ies occupations; food industry occupa- tions
5 Healthcare 1 Health professionals 17 Light industry Light industry occupations 6 Social welfare 1 Social services professionals 18 Metal and electrical
industry Metal and electrical industry occupations
7 Education Educators and teachers 19 Construction Construction industry occupations
8 Economy, law, social
science Business, legal and social sciences
professionals 20 Handicrafts Handicraft occupations
9 Culture 1 Culture, sports, arts and religion-
related professionals 21 Other industry Other industry and construction industry occupations
10 Technicians Technicians and other related techni-
cal professionals 22 Operators Manufacturing machine operators; assem-
blers; stationary machine operators;
drivers and mobile machinery operators 11 Healthcare 2 Healthcare occupations (not requir-
ing a higher education qualification) 23 Unskilled Elementary occupations not requir- ing a qualification
12 Social welfare 2 Educational assistants, social welfare and labour market services related occupations