The knowledge of high school students from Budapest about cervical cancer, HPV infection and its prevention
PhD thesis
Bettina Claudia Balla
Doctoral School of Pathological Sciences Semmelweis University
Supervisors: Péter Balázs, MD., Ph.D.
András Terebessy, MD., Ph.D.
Official reviewers: Ágoston Ghidán, MD., Ph.D.
Regina Molnár, Ph.D.
Head of the Final Examination Committee: Iván Forgács, MD., C.Sc.
Members of the Final Examination Committee: Sára Felszeghi, MD, Ph.D Zsuzsa Győrffy, MD., Ph.D.
Budapest
2018
Introduction
Cervical cancer was the 4th most frequent malignant disease among women worldwide and the 10th of all malignant tumors in 2015. In the same year, nearly 526 000 new cases were registered (ASIR=14,3/100 000) and the mortality was estimated to be 239 000 (ASDR=6,6/100 000), covering about 7.5% of female deaths from cancer.
Almost 85% of cervical cancer cases are registered in the developing countries, where the disease is responsible for 12% of cancer-related deaths among females. Furthermore, nine out of ten lethal cases are registered in these countries. In Hungary, cervical cancer incidence is higher than the EU-average: incidence was two-fold in 2012 with 1178 new cases. In the same year, 461 women deceased from the disease.
In Hungary, cervical cancer screening has been operating opportunistically since the 1950s. In 2003, however, a population-based screening program was established as part of the National Public Health Program. According to the provided schedule, organized cervical cancer screening is recommended by cytology to women aged 25-65 every 3 years after an initial negative test. Since 2008, following international practices, nurses of the Maternity and Child Health Service (MCHS) joined the MCHS Cervical Cancer Screening pilot program, and afterwards the general program.
Since September 2014, two doses of the bivalent HPV vaccine are offered nationwide free of charge to 7th grade school girls. As HPV infection is responsible for 99% of cervical cancers, the prevention of this STI is primordial, for screening and immunization my significantly reduce the incidence and mortality of this condition.
The success of a population-based screening program (secondary prevention) depends essentially on the demand i.e.: motivation of the target population, thus in order to increase attendance, one of the main pre-requisites are raising the awareness of the disease to an optimal level (primary prevention). Furthermore, the acceptance and uptake of the HPV vaccine, also part of primary prevention, relies fundamentally on the awareness of the disease and the vaccine, which helps eliminate fears and misbeliefs (deterrent factors) considering vaccination.
Aims
Our study aimed to explore the knowledge about HPV infection, cervical cancer and the attitude towards HPV vaccination of high school graduates in Budapest, as sexual behavior and vaccine uptake are equally influenced by the awareness of the disease itself, its risk factors and vaccine- related attitudes. One of the main arguments for choosing this population was the high HPV- prevalence of this age-group. These students could not benefit from the current vaccination program, though had access to the vaccine under different circumstances, nevertheless,
vaccination is still recommended for them. Even though cervical cancer only affects women, we decided to include males in our study as vaccination is available for both sexes. Furthermore, we also aimed to explore the knowledge of males regarding the conditions caused by the virus in men (e.g.: genital warts, anal cancer etc.).
Methods
In our cross-sectional study, we determined the target population as grammar and vocational high school graduates 18 years of age. Data collecting took place between March 2013 and May 2014. The participating institutions (N=40) were randomly selected through the online database of the National Educational Agency. We contacted the principal of each school in e-mail to ask their permission to conduct our research in their establishment. In the end, we were invited by 19 high schools with 73 classes. The contents of the questionnaire and the method of our study was accepted by the Semmelweis University’s Board of Ethics (reference number: 23/2013).
Questionnaires were typically filled out by students during headmaster or biology classes. Students were orally informed by the conducting teachers that participation was voluntarily, and data processing was anonymous.
We distributed 2180 questionnaires and received 1636 (response rate: 75%). Data were first registered by Microsoft Office Excel and transferred later to IBM SPSS v.23. 56 questionnaires were excluded from further analysis (e.g.: questionnaires where items concerning the knowledge of the disease were left unanswered or responses were inadequate).
In the end, we started analysis with 1580 questionnaires.
The questionnaire contained 54 items with single or multiple-choice questions on the following five topics: socio-demographic background (9 items), lifestyle factors (17 items), knowledge about cervical cancer/HPV infection (12 items), attitude towards the HPV vaccine (11 items), cervical cancer screening related knowledge and attitudes (4 items).
We first performed frequency analysis, then Pearson Chi-square tests based on sex and school-type for associations. Results were accepted at p<0.05 with 95% confidence interval (95%CI). For variables with non-normal distribution, we used nonparametric tests as Mann- Whitney U and Kruskal-Wallis H test.
To describe the attitude towards vaccination, we determined a new variable. While creating it, we used the following variables: the self-perceived risk of HPV infection, the will to vaccinate the future child, the will to make the vaccine mandatory, the efficacy of vaccination after the initiation of sexual life, the will to vaccinate boys, and the items discussing the general efficacy of the vaccine. We tested the internal consistency of the questions indicated above, and the Cronbach’s alpha value was 0.774, thus we judged the answers suitable to analyze the
attitude towards vaccination. Next, answers were recoded with attributing code 1 to “no” and code 2 to “yes” answers. Missing items were coded as 0. After adding the code numbers, we created a new variable - “attitude score” - with values ranging from 1 to 12. The average score was 7.08 (SD=2.89), the median: 7.00. Our goal was to construct a multi-variable model to define the predictors of the attitudes towards vaccination. We therefore conducted binary logistic regression with a new variable that we created by applying a median split on our
“attitude score” (1-6 and 7-12 respectively).
Results
Socio-demographic characteristics
Socio-demographic factors are presented by contingency tables based on sex and school-type (Table 1).
Table 1. Characteristics of the high-school sample based on sex and school-type (N=1580).
Variables Sex, N (%) χ2-test,
p-value
School-type, N (%) χ2-test, p-value
Male Female Vocational Grammar
Male Female
--- --- --- 490 (77.2)
601 (57.2)
121 (22.8)
449 (42.8) <0.001 Budapest
Outside Budapest
351 (6.2) 179 (33.8)
743 (71.6)
294 (28.4) 0.027 651 (65.2) 347 (34.8)
443 (77.9)
126 (22.1) <0.001 Pursue education
Yes
No 251 (67.5)
121 (32.5) 463 (75.8)
148 (24.2) 0.005 472 (67.3)
230 (32.8) 463 (92.2)
39 (7.8) <0.001 Pocket-money
<5000 Ft
>5000 Ft 279 (74.0)
98 (26.0) 625 (83.6)
123 (16.4) <0.001 572 (79.0)
152 (21.0) 332 (82.8)
69 (17.2) 0.146 Works
Yes No
302 (60.9) 194 (39.1)
858 (54.0) 729 (46.0)
0.007 580 (60.4) 380 (39.6)
580 (51.6) 543 (48.4)
<0.001 Religious
Atheist 132 (50.8)
128 (49.2) 257 (57.2)
192 (42.8) 0.095 243 (56.5)
187 (43.5) 146 (52.3)
133 (47.7) 0.274 Eats
Regularly Irregularly
313 (60.9) 201 (39.1)
508 (49.5)
519 (50.5) <0.001 498 (50.6) 487 (49.4)
323 (58.1)
233 (41.9) 0.005 No diet
Diet
407 (85.1) 71 (14.9)
770 (78.3)
214 (21.7) 0.002 760 (81.3) 174 (18.7)
417 (79.0)
111 (21.0) 0.298 1st child
Before 25 After 25
119 (30.1) 276 (69.9)
388 (55.4) 312 (44.6)
<0.001 335 (41.8) 466 (58.2)
172 (38.2) 286 (61.8)
0.154 Sport
Occasionally
Regularly 256 (53.1)
226 (46.9) 703 (73.6)
252 (26.4) <0.001 628 (68.6)
288 (31.4) 331 (63.5)
190 (36.5) 0.051 TV
No TV
419 (79.0) 111 (21.0)
888 (84.6)
162 (15.4) 0.007 837 (82.9) 173 (17.1)
470 (82.5)
100 (17.5) 0.887 Radio
No radio
344 (64.9) 186 (35.1)
772 (73.5)
278 (26.5) <0.001 719 (71.2) 291 (28.8)
397 (69.6)
173 (30.4) 0.554 Smoker
Non-smoker
172 (34.9) 321 (65.1)
290 (28.9)
713 (71.1) 0.021 324 (25.2) 960 (74.8)
138 (25.7)
398 (74.3) 0.862 Daily
< 10 cigarettes
> 10 cigarettes
93 (53.8) 80 (46.2)
199 (69.8)
86 (30.2) <0.001 199 (61.6) 124 (38.4)
93 (68.9)
42 (31.1) 0.170
Factors related to knowledge
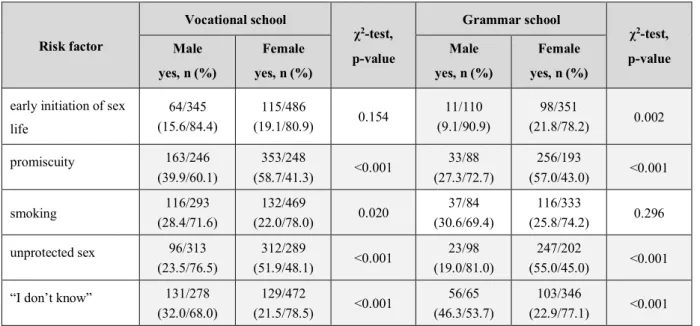
- Risk factors for cervical cancer (Table 2.):
Table 2. Primary cause of cervical cancer based on sex and school-type.
Risk factor
Vocational school
χ2-test, p-value
Grammar school
χ2-test, p-value Male
yes, n (%)
Female yes, n (%)
Male yes, n (%)
Female yes, n (%) early initiation of sex
life
64/345 (15.6/84.4)
115/486
(19.1/80.9) 0.154 11/110
(9.1/90.9)
98/351
(21.8/78.2) 0.002
promiscuity 163/246
(39.9/60.1)
353/248
(58.7/41.3) <0.001 33/88 (27.3/72.7)
256/193
(57.0/43.0) <0.001
smoking 116/293
(28.4/71.6)
132/469
(22.0/78.0) 0.020 37/84
(30.6/69.4)
116/333
(25.8/74.2) 0.296
unprotected sex 96/313
(23.5/76.5)
312/289
(51.9/48.1) <0.001 23/98 (19.0/81.0)
247/202
(55.0/45.0) <0.001
“I don’t know” 131/278
(32.0/68.0)
129/472
(21.5/78.5) <0.001 56/65 (46.3/53.7)
103/346
(22.9/77.1) <0.001 Note: Grey background indicates significant difference.
- Prevention of cervical cancer (Table 3.):
Table 3. Prevention of cervical cancer based on sex and school-type.
Answers
Vocational school
χ2-test, p-value
Grammar school
χ2-test, p-value Male
yes n (%)
Female yes, n (%)
Male yes, n (%)
Female yes, n (%)
screening 247/162
(60.4/39.6)
452/149
(75.2/24.8) <0.001 66/55 (54.5/45.5)
344/105
(76.6/23.4) <0.001
HPV vaccine 177/232
(43.3/56.7)
438/163
(72.9/27.1) <0.001 52/69 (43.0/57.0)
347/102
(77.3/22.7) <0.001
safe sex 107/302
(26.2/73.8)
242/359
(22.0/78.0) 0.020 21/100
(17.4/82.6)
182/267
(40.5/59.5) <0.001
“I don’t know” 84/325
(20.5/79.5)
34/567
(5.7/94.3) <0.001 36/85 (29.8/70.2)
21/428
(4.7/95.3) <0.001 Note: Grey background indicates significant difference.
- Transmission of HPV (Table 4.):
Table 4: Transmission of HPV based on sex and school-type.
Transmission of HPV
Vocational school
χ2-test, p-value
Grammar school
χ2-test, p-value Male
yes, n (%)
Female yes, n (%)
Male yes, n (%)
Female yes, n (%)
STI 151/258
(36.9/63.1)
398/203
(66.2/33.8) <0.001 36/85 (29.8/70.2)
279/170
(62.1/37.9) <0.001 blood and saliva 74/335
(18.1/81.9)
133/468
(22.1/77.9) 0.119 22/99
(18.2/81.8)
110/339
(24.5/75.5) 0.144
vertical 41/368
(10.0/90.0)
62/539
(10.3/89.7) 0.880 7/114
(5.8/94.2)
63/386
(14.0/86.0) 0.014
“I don’t know” 197/212
(48.2/51.8)
138/463
(23.0/77.0) <0.001 70/51 (57.9/42.1)
122/327
(27.2/72.8) <0.001 Note: Grey background indicates significant difference and yellow incorrect answers.
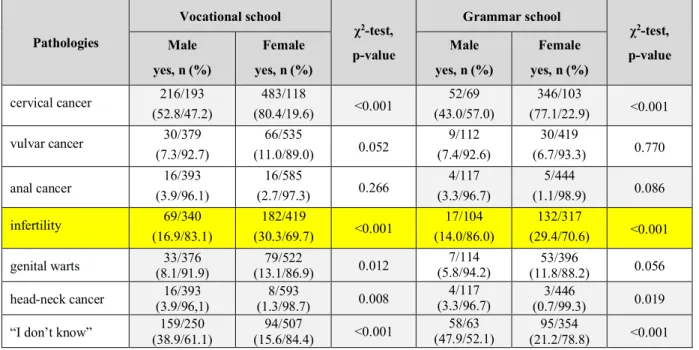
- Pathologies caused by HPV in women (Table 5.):
Table 5. Pathologies caused by HPV in women based on sex and school-type.
Pathologies
Vocational school
χ2-test, p-value
Grammar school
χ2-test, p-value Male
yes, n (%)
Female yes, n (%)
Male yes, n (%)
Female yes, n (%) cervical cancer 216/193
(52.8/47.2)
483/118
(80.4/19.6) <0.001 52/69 (43.0/57.0)
346/103
(77.1/22.9) <0.001
vulvar cancer 30/379
(7.3/92.7)
66/535
(11.0/89.0) 0.052 9/112
(7.4/92.6)
30/419
(6.7/93.3) 0.770
anal cancer 16/393
(3.9/96.1)
16/585
(2.7/97.3) 0.266 4/117
(3.3/96.7)
5/444
(1.1/98.9) 0.086
infertility 69/340
(16.9/83.1)
182/419
(30.3/69.7) <0.001 17/104 (14.0/86.0)
132/317
(29.4/70.6) <0.001
genital warts 33/376
(8.1/91.9)
79/522
(13.1/86.9) 0.012 7/114
(5.8/94.2) 53/396
(11.8/88.2) 0.056 head-neck cancer 16/393
(3.9/96,1)
8/593
(1.3/98.7) 0.008 4/117
(3.3/96.7) 3/446
(0.7/99.3) 0.019
“I don’t know” 159/250 (38.9/61.1)
94/507
(15.6/84.4) <0.001 58/63
(47.9/52.1) 95/354
(21.2/78.8) <0.001 Note: Grey background indicates significant difference and yellow incorrect answers with significant difference.
- Pathologies caused by HPV in men (Table 6.):
Table 6. Pathologies caused by HPV in men based on sex and school-type.
Pathology
Vocational school
χ2-test, p-value
Grammar school
χ2-test, p-value Male
yes, n (%)
Female yes, n (%)
Male yes, n (%)
Female yes, n (%)
no pathology 43/366
(10.5/89.5)
113/488
(18.8/81.2) <0.001 9/112 (7.4/92.6)
68/381
(15.1/84.9) 0.028 prostate cancer 56/353
(13.7/86.3)
113/488
(18.8/81.2) 0.033 15/106
(12.4/87.6)
63/386
(14.0/86.0) 0.642 head-neck cancer 7/402
(1.7/98.3)
16/585
(2.7/97.3) 0.320 2/119
(1.7/96.7)
0/449
(0.0/100.0) 0.006
“I don’t know” 253/156 (61.9/38.1)
296/305
(49.3/50.7) <0.001 81/40 (66.9/33.1)
267/182
(59.5/40.5) 0.134 Note: Grey background indicates significant difference and yellow incorrect answers with significant difference.
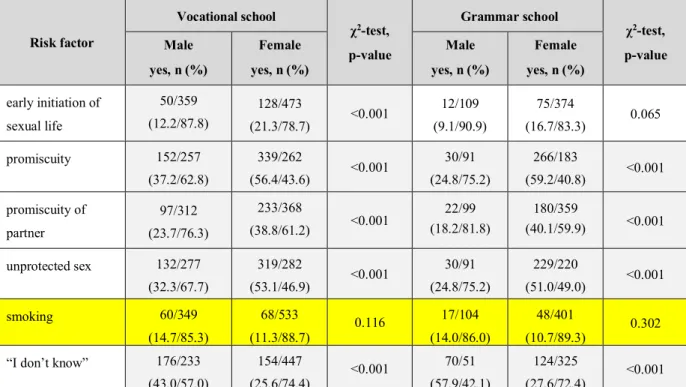
- Risk factors for HPV infection (Table 7.):
Table 7. Risk factors for HPV infection based on sex and school-type.
Risk factor
Vocational school
χ2-test, p-value
Grammar school
χ2-test, p-value Male
yes, n (%)
Female yes, n (%)
Male yes, n (%)
Female yes, n (%) early initiation of
sexual life
50/359 (12.2/87.8)
128/473
(21.3/78.7) <0.001 12/109 (9.1/90.9)
75/374
(16.7/83.3) 0.065
promiscuity 152/257
(37.2/62.8)
339/262
(56.4/43.6) <0.001 30/91 (24.8/75.2)
266/183
(59.2/40.8) <0.001 promiscuity of
partner
97/312 (23.7/76.3)
233/368
(38.8/61.2) <0.001 22/99 (18.2/81.8)
180/359
(40.1/59.9) <0.001 unprotected sex 132/277
(32.3/67.7)
319/282
(53.1/46.9) <0.001 30/91 (24.8/75.2)
229/220
(51.0/49.0) <0.001
smoking 60/349
(14.7/85.3)
68/533 (11.3/88.7)
0.116 17/104
(14.0/86.0)
48/401
(10.7/89.3) 0.302
“I don’t know” 176/233 (43.0/57.0)
154/447
(25.6/74.4) <0.001 70/51 (57.9/42.1)
124/325
(27.6/72.4) <0.001 Note: Grey background indicates significant difference and yellow incorrect answers.
- Prevention of HPV infection (Table 8.):
Table 8. Prevention of HPV infection based on sex and school-type.
Method
Vocational school
χ2-test, p-value
Grammar school
χ2-test, p-value Male
yes, n (%)
Female yes, n (%)
Male yes, n (%)
Female yes, n (%)
HPV vaccine 150/259
(36.7/63.3)
422/179
(70.2/29.8) <0.001 42/79 (34.7/65.3)
316/133
(70.4/29.6) <0.001
screening 154/255
(37.7/62.3)
368/233
(61.2/38.8) <0.001 41/80 (33.9/66.1)
271/178
(60.4/39.6) <0.001
safe sex 139/270
(34.0/66.0)
312/289
(51.9/48.1) <0.001 33/88 (27.3/72.7)
241/208
(53.7/46.3) <0.001
monogamy 25/384
(6.1/93.9)
63/538
(10.5/89.5) 0.016 9/112
(11.6/88.4)
54/395
(12.0/88.0) 0.153
“I don’t know” 143/266 (35.0/65.0)
83/518
(13.8/86.2) <0.001 57/64 (47.1/52.9)
70/379
(15.6/84.4) <0.001 Note: Grey background indicates significant difference.
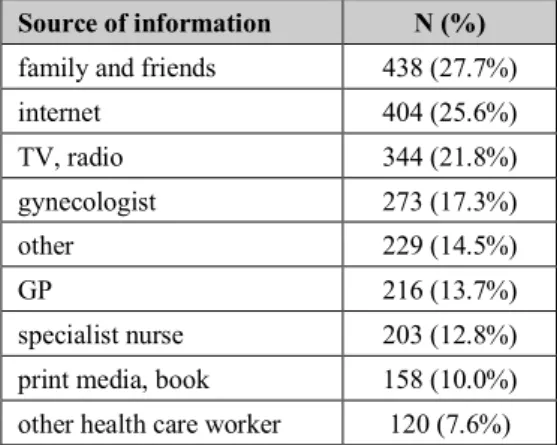
- Source of information on cervical cancer/HPV infection (Table 9.):
Table 9. Source of information on cervical cancer/HPV infection
Source of information N (%) family and friends 438 (27.7%)
internet 404 (25.6%)
TV, radio 344 (21.8%)
gynecologist 273 (17.3%)
other 229 (14.5%)
GP 216 (13.7%)
specialist nurse 203 (12.8%) print media, book 158 (10.0%) other health care worker 120 (7.6%)
Attitude towards HPV vaccination
- Awareness of the HPV vaccine (Table 10.):
Table 10. Awareness of the HPV vaccine based on sex and school-type.
Heard of the vaccine
Vocational school
χ2-test, p-value
Grammar school
χ2-test, p-value Male
yes, n (%)
Female yes, n (%)
Male yes, n (%)
Female yes, n (%)
“I don’t know” 1 (0.3) 16 (2.8)
<0.001
0 (0.0) 14 (3.2)
<0.001
yes 187 (57.5) 493 (85.9) 40 (47.6) 379 (87.5)
no 137 (42.2) 65 (11.3) 44 (52.4) 40 (9.2)
Note: Grey background indicates significant difference.
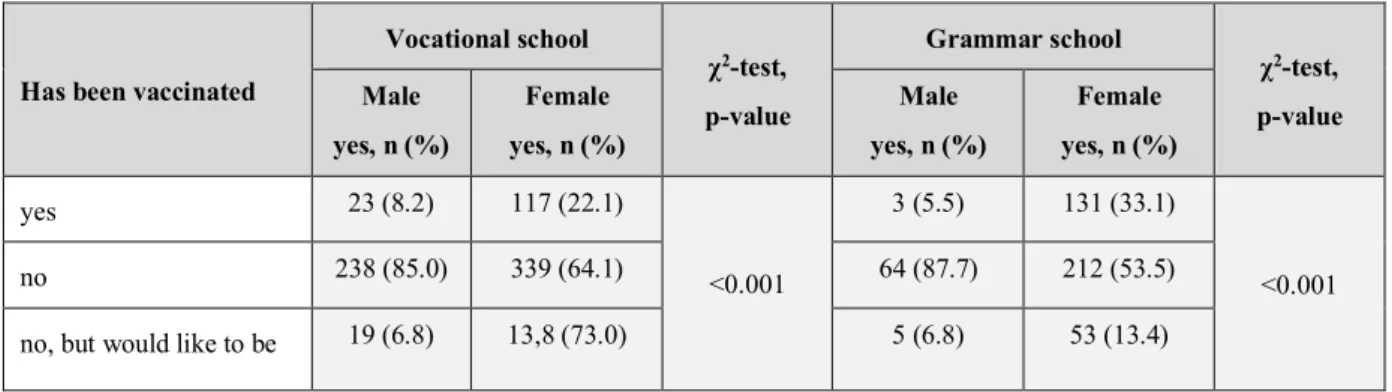
- HPV vaccination status (Table 11.):
Table 11. HPV vaccination status based on sex and school-type.
Has been vaccinated
Vocational school
χ2-test, p-value
Grammar school
χ2-test, p-value Male
yes, n (%)
Female yes, n (%)
Male yes, n (%)
Female yes, n (%)
yes 23 (8.2) 117 (22.1)
<0.001
3 (5.5) 131 (33.1)
<0.001
no 238 (85.0) 339 (64.1) 64 (87.7) 212 (53.5)
no, but would like to be 19 (6.8) 13,8 (73.0) 5 (6.8) 53 (13.4)
Note: Grey background indicates significant difference.
- Self-perceived risk of HPV infection (Table 12.):
Table 12. Self-perceived risk of HPV infection based on sex and school-type.
Self-perceived risk of HPV infection
Vocational school
χ2-test, p-value
Grammar school
χ2-test, p-value Male
yes, n (%)
Female yes, n (%)
Male yes, n (%)
Female yes, n (%)
yes 29 (8.4) 130 (23.9)
<0.001
11 (10.6) 78 (18.8)
<0.076
no 144 (43.4) 238 (43.8) 43 (41.3) 176 (42.5)
“I don’t know” 160 (48.2) 176 (32.4) 43 (41.3) 176 (42.5)
Note: Grey background indicates significant difference.
- Attitude towards the HPV vaccine based on sex and school-type (Table 13.):
Table 13. Attitude towards the HPV vaccine based on sex and school-type.
Factor
Vocational school
χ2-test, p-value
Grammar school
χ2-test, p-value Male
yes, n (%)
Female yes, n (%)
Male yes, n (%)
Female yes, n (%) Vaccinate future child
yes no
“I don’t know”
157 (45.5) 110 (31.9) 78 (22.6)
324 (58.9) 87 (15.8) 139 (25.3)
<0.001
44 (42.3) 28 (26.9) 32 (30.8)
253 (61.7) 69 (16.8) 88 (21.5)
0.002
Mandatory vaccination yes
no
“I don’t know”
93 (27.0) 118 (34.3) 133 (38.7)
247 (44.0) 186 (33.1) 129 (23.0)
<0.001 21 (20.4) 41 (39.8) 41 (39.8)
193 (45.8) 125 (29.7) 103 (24.5)
<0.001
Vaccination after starting sex life
yes no
“I don’t know”
187 (54.8) 50 (14.7) 104 (30.5)
409 (72.4) 54 (9.6) 102 (18.1)
<0.001 50 (46.3) 8 (7.4) 50 (46.3)
301 (70.2) 41 (9.6) 87 (20.3)
<0.001
Vaccination of males yes
no
“I don’t know”
84 (25.0) 93 (27.7) 159 (47.3)
265 (47.2) 99 (17.6) 197 (35.1)
<0.001 23 (20.9) 29 (26.4) 58 (52.7)
156 (37.3) 89 (21.3) 173 (41.4)
0.005
Efficacy of the vaccine trusts it
trusts it but with doubts no trust in it
66 (21.7) 169 (55.6)
69 (22.7)
130 (24.9) 327 (62.5) 66 (12.3)
<0.001 20 (23.5) 52 (61.2) 13 (15.3)
110 (27.6) 247 (61.9) 42 (10.5)
0.400
Note: Grey background indicates significant difference.
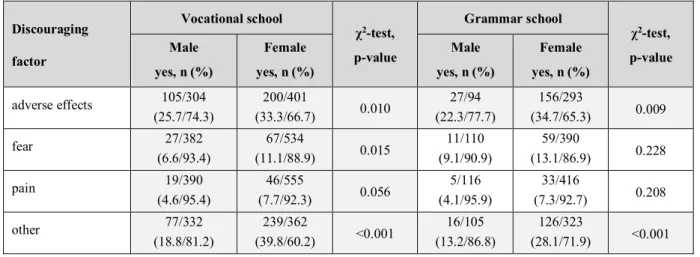
- Discouraging factors for vaccination (Table 14.):
Table 14. Discouraging factors for vaccination based on sex and school-type.
Discouraging factor
Vocational school
χ2-test, p-value
Grammar school
χ2-test, p-value Male
yes, n (%)
Female yes, n (%)
Male yes, n (%)
Female yes, n (%) adverse effects 105/304
(25.7/74.3)
200/401
(33.3/66.7) 0.010 27/94
(22.3/77.7)
156/293
(34.7/65.3) 0.009
fear 27/382
(6.6/93.4)
67/534
(11.1/88.9) 0.015 11/110
(9.1/90.9)
59/390
(13.1/86.9) 0.228
pain 19/390
(4.6/95.4)
46/555
(7.7/92.3) 0.056 5/116
(4.1/95.9)
33/416
(7.3/92.7) 0.208
other 77/332
(18.8/81.2)
239/362
(39.8/60.2) <0.001 16/105 (13.2/86.8)
126/323
(28.1/71.9) <0.001 Note: Grey background indicates significant difference.
- Attitude towards the HPV vaccine of vaccinated students (Table 15.):
Table 15. Attitude towards the HPV vaccine of vaccinated students.
Variables
HPV vaccinated students, n (%)
p-value
Yes No No, but wants
to be vaccinated HPV vaccinated family
member (yes)
male 20 (86.9) 19 (13.1) 4 (50.0) <0.001
female 165 (78.9) 36 (8.7) 14 (18.4) <0.001 heard of the vaccine (yes) male 21 (84.0) 151 (53.7) 14 (63.6) 0.011
female 242 (98.4) 463 (85.0) 818 (89.2) <0.001 self-perceived risk of HPV
infection (yes)
male 8 (42.1) 19 (11.4) 4 (33.3) <0.001
female 48 (27.1) 101 (29.8) 41 (55.4) <0.001 would vaccinate future child
(yes)
male 21 (84.0) 107 (49.1) 18 (78.3) <0.001 female 229 (98.2) 201 (58.8) 108 (96.4) <0.001 mandatory vaccination (yes) male 17 (68.0) 55 (30.5) 12 (70.6) <0.001 female 163 (76.9) 157 (40.3) 94 (86.2) <0.001 efficacy of vaccine after
starting sex life (yes)
male 17 (80.9) 149 (77.2) 13 (92.8) 0.371
female 199 (91.7) 354 (83.7) 102 (99.0) <0,001 vaccination of males (yes) male 15 (78.9) 54 (36.7) 11 (73.3) <0.001 female 110 (74.8) 206 (60.9) 69 (85.2) <0.001 trusts the efficacy of the
vaccine (yes)
male 21 (87.5) 190 (76.0) 12 (66.7) 0.271
female 233 (97.4) 401 (82.2) 117 (97.5) <0.001 Note: Grey background indicates significant difference.
Factors influencing attitude towards vaccination
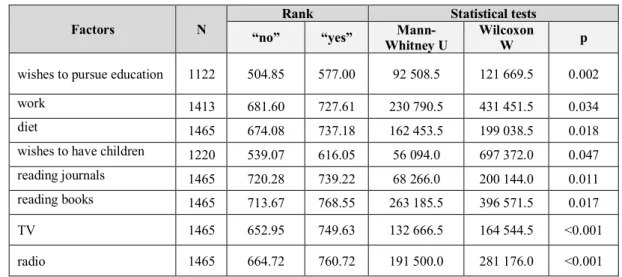
- Socio-demographic and lifestyle factors related to the attitude score (Table 16.):
Table 16. Socio-demographic and lifestyle factors related to the attitude score.
Factors N
Rank Statistical tests
“no” “yes” Mann-
Whitney U
Wilcoxon
W p
wishes to pursue education 1122 504.85 577.00 92 508.5 121 669.5 0.002
work 1413 681.60 727.61 230 790.5 431 451.5 0.034
diet 1465 674.08 737.18 162 453.5 199 038.5 0.018
wishes to have children 1220 539.07 616.05 56 094.0 697 372.0 0.047
reading journals 1465 720.28 739.22 68 266.0 200 144.0 0.011
reading books 1465 713.67 768.55 263 185.5 396 571.5 0.017
TV 1465 652.95 749.63 132 666.5 164 544.5 <0.001
radio 1465 664.72 760.72 191 500.0 281 176.0 <0.001
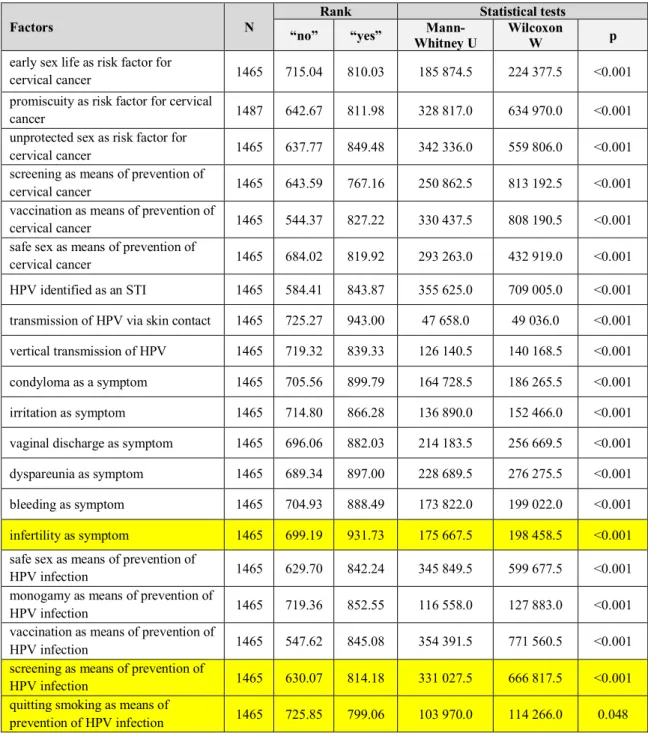
- Knowledge about the disease related to the attitude score (Table 17.):
Table 17. Knowledge about the disease related to the attitude score.
Factors N
Rank Statistical tests
“no” “yes” Mann-
Whitney U Wilcoxon
W p
early sex life as risk factor for
cervical cancer 1465 715.04 810.03 185 874.5 224 377.5 <0.001
promiscuity as risk factor for cervical
cancer 1487 642.67 811.98 328 817.0 634 970.0 <0.001
unprotected sex as risk factor for
cervical cancer 1465 637.77 849.48 342 336.0 559 806.0 <0.001
screening as means of prevention of
cervical cancer 1465 643.59 767.16 250 862.5 813 192.5 <0.001
vaccination as means of prevention of
cervical cancer 1465 544.37 827.22 330 437.5 808 190.5 <0.001
safe sex as means of prevention of
cervical cancer 1465 684.02 819.92 293 263.0 432 919.0 <0.001
HPV identified as an STI 1465 584.41 843.87 355 625.0 709 005.0 <0.001 transmission of HPV via skin contact 1465 725.27 943.00 47 658.0 49 036.0 <0.001 vertical transmission of HPV 1465 719.32 839.33 126 140.5 140 168.5 <0.001 condyloma as a symptom 1465 705.56 899.79 164 728.5 186 265.5 <0.001 irritation as symptom 1465 714.80 866.28 136 890.0 152 466.0 <0.001 vaginal discharge as symptom 1465 696.06 882.03 214 183.5 256 669.5 <0.001 dyspareunia as symptom 1465 689.34 897.00 228 689.5 276 275.5 <0.001
bleeding as symptom 1465 704.93 888.49 173 822.0 199 022.0 <0.001
infertility as symptom 1465 699.19 931.73 175 667.5 198 458.5 <0.001 safe sex as means of prevention of
HPV infection 1465 629.70 842.24 345 849.5 599 677.5 <0.001
monogamy as means of prevention of
HPV infection 1465 719.36 852.55 116 558.0 127 883.0 <0.001
vaccination as means of prevention of
HPV infection 1465 547.62 845.08 354 391.5 771 560.5 <0.001
screening as means of prevention of
HPV infection 1465 630.07 814.18 331 027.5 666 817.5 <0.001
quitting smoking as means of
prevention of HPV infection 1465 725.85 799.06 103 970.0 114 266.0 0.048 Note: Yellow background indicates incorrect answers.
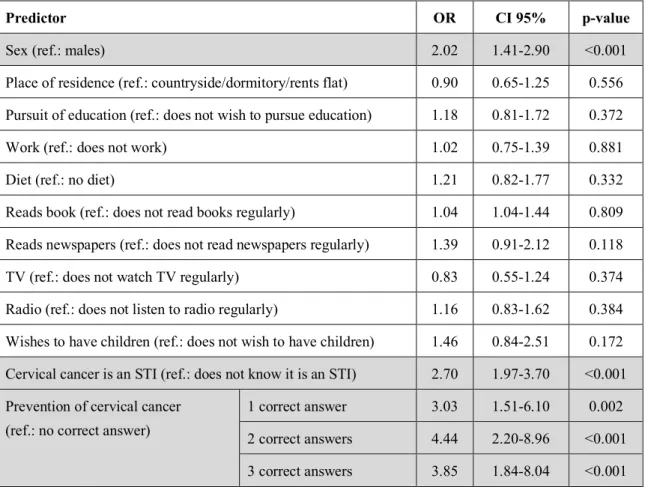
Predictors of the attitude score
Our multi-variable model contained the socio-demographic and lifestyle factors presented in Table 16. As the indicator of knowledge about the disease, we used the items that discussed the STI origins of cervical cancer and the means of its prevention. In our binary logistic regression, only the sex of the responder, the STI origins of the disease and the awareness of the means of prevention were proven to be the predictors of the attitude score, thus vaccine acceptance (Table 18.).
Table 18. Predictors of attitude scores > 7 (median).
Predictor OR CI 95% p-value
Sex (ref.: males) 2.02 1.41-2.90 <0.001
Place of residence (ref.: countryside/dormitory/rents flat) 0.90 0.65-1.25 0.556 Pursuit of education (ref.: does not wish to pursue education) 1.18 0.81-1.72 0.372
Work (ref.: does not work) 1.02 0.75-1.39 0.881
Diet (ref.: no diet) 1.21 0.82-1.77 0.332
Reads book (ref.: does not read books regularly) 1.04 1.04-1.44 0.809 Reads newspapers (ref.: does not read newspapers regularly) 1.39 0.91-2.12 0.118
TV (ref.: does not watch TV regularly) 0.83 0.55-1.24 0.374
Radio (ref.: does not listen to radio regularly) 1.16 0.83-1.62 0.384 Wishes to have children (ref.: does not wish to have children) 1.46 0.84-2.51 0.172 Cervical cancer is an STI (ref.: does not know it is an STI) 2.70 1.97-3.70 <0.001 Prevention of cervical cancer
(ref.: no correct answer)
1 correct answer 3.03 1.51-6.10 0.002
2 correct answers 4.44 2.20-8.96 <0.001 3 correct answers 3.85 1.84-8.04 <0.001 Note: Grey background indicates significant difference. Nagelkerke R2 =17,7%.
Conclusions
The awareness and knowledge about cervical cancer/HPV infection among adolescents is insufficient worldwide, however, it is difficult to make objective comparisons between distinct populations. In our country, the knowledge of the disease has been studied in various samples already, both among females and males, and similar tendencies were recorded. Our results of the high school graduates from Budapest were mostly in line with these previous findings, which supports the fact that young Hungarians need further education concerning HPV infection and its prevention.
Several studies, including our own, conducted among high school students, have shown that women have a higher knowledge about the disease. While it is not entirely surprising that women possess more information about cervical cancer, as they are the ones affected by it, the lack of knowledge of men regarding pathologies in males is an indisputable indicator of their poor awareness of the virus and the ineffectiveness of health education programs targeting the youth.
Despite their low level of knowledge, our sample was mostly positive towards the HPV vaccine, as the majority of students would vaccinate their future children. Mandatory vaccination and vaccination of males was less popular however. Deterrents of vaccine
acceptance were the fear of adverse effects and the price of the vaccine; the latter being partially solved by offering the vaccine to 7th grade school girls free of charge since the fall of 2014.
Extending free vaccination to a wider population could positively influence vaccine coverage, as could fear of adverse effects be reduced by health education programs.
The main sources of information of the high school graduates from our sample were family and friends, the internet and “traditional” media (TV, radio). Several international and domestic studies have pointed out the importance and efficacy of school-based health education programs. This also underlines the role of these programs, specialist nurses and school doctors.
Of course, gynecologists, GPs etc. are also supposed to provide the population with regular and up to date information about the viral infection. Furthermore, as mass media was also indicated as a source of information for high school students, its responsibility in health education is to be mentioned. Having uncovered the lack of knowledge among the youth, the synergic collaboration of the previous actors, and the creation of extended and targeted health education programs would be necessary.
Bibliography
Publications related to the Ph.D. thesis:
1. Bettina Claudia Balla
The prevention of cervical cancer and HPV-related diseases of the anogenital region JOURNAL OF HEALTH & MEDICAL INFORMATICS 8:(1) pp.1. (2017)
2. Bettina Claudia Balla, András Terebessy, Emese Tóth, Péter Balázs A fiatal magyar férfiak attitűdje a HPV-oltással kapcsolatban EGÉSZSÉSGTUDOMÁNY 61:(1) pp. 38-53. (2017)
3. Bettina Claudia Balla, András Terebessy, Emese Tóth, Péter Balázs
Young Hungarian students’ knowledge about HPV and their attitude toward HPV vaccination
VACCINES 5:(1) pp. 1-9. (2017)
4. Bettina Claudia Balla, András Terebessy, Emese Tóth, Péter Balázs Fiatal férfiak ismeretei a humán papillomavírusról
LEGE ARTIS MEDICNAE 26:(7-8) pp. 359-364. (2016) 5. Bettina Claudia Balla, András Terebessy, Emese Tóth, Péter Balázs
Hungarian high-school students’ attitudes toward the HPV vaccination NEW MEDICINE 19:(3) pp. 94-100. (2015)
6. Bettina Claudia Balla, Gábor Dobos
Felmérés a fiatal magyar nők körében a méhnyakrákról, szűréséről és HPV- oltásról EGÉSZSÉGFEJLESZTÉS 51:(3) pp. 22-24. (2010)
Other publications:
1. András Terebessy, Edit Czeglédi, Bettina Claudia Balla, Ferenc Horváth, Péter Balázs Medical student’s health behaviour and self-reported mental health status by their country of origin: a cross-sectional study
BMC PSYCHIATRY 16:(171) pp.1-9. (2016)