Patterns of informal patient payments in Bulgaria, Hungary and Ukraine: a
comparison across countries, years and type of services
Tetiana Stepurko,
1,2* Milena Pavlova,
2Irena Gryga,
1Pe´ter Ga al
3and Wim Groot
2,41School of Public Health, National University of ‘Kyiv-Mohyla Academy’; Ukraine, Skovorody street 2, Kiev, Ukraine,2Department of Health Services Research, CAPHRI, Maastricht University Medical Center, Faculty of Health, Medicine and Life Sciences, Maastricht University, The Netherlands, 3Faculty of Health and Public Services, Semmelweis University, Budapest, Hungary and 4Top Institute Evidence-Based Education Research (TIER); Maastricht University, The Netherlands
*Corresponding author. Tetiana Stepurko, School of Public Health, National University of ‘Kyiv-Mohyla Academy’, Skovorody street 2; Kiev 04655, Ukraine, Tel.þ380-44-4257769, Email: t.stepurko@maastrichtuniversity.nl
Accepted on 23 September 2016
Abstract
Informal payments for health care are a well-known phenomenon in many health care systems around the world. While informal payments could be an important source of health care financing, they have an adverse impact on efficiency and access to care, and are a major impediment to on- going health care reforms. This paper aims to study the scale and patterns of informal patient pay- ments for out-patient and in-patient services in three former-socialist countries: Bulgaria, Hungary and Ukraine. The data are collected in 2010 and 2011 based on national representative samples and are analysed in pooled models to explain variations in payments. The results of the cross-country comparison suggest a relatively higher prevalence of informal patient payments in Ukraine and Hungary than in Bulgaria, where patients also have to pay formal user charges in the public sector.
Nevertheless, informal payments for hospitalization in Bulgaria are quite extensive. We observe some differences in informal payments across the years. Variations in payment size are mainly ex- plained by the nature, type and need for services, fee awareness and, on some occasions, by house- hold income. Interpreted within the context of structural differences (e.g. reform paths, regulations, funding, user fees, anti-corruption policies), the findings of our study have implications on how to address informal payments for health care.
Keywords: Central and Eastern Europe, informal payments for health care, in-patient service, out-patient service, out-of-pocket payments
VCThe Author 2016. Published by Oxford University Press in association with The London School of Hygiene and Tropical Medicine.
All rights reserved. For permissions, please e-mail: journals.permissions@oup.com 453
doi: 10.1093/heapol/czw147 Advance Access Publication Date: 25 November 2016 Original Article
Introduction
Informal payments for health care services are a well-known phe- nomenon in many health care systems around the world (Balabanova et al.2004,Gaalet al.2006,Lewis, 2002,Liaropoulos and Tragakes 1998,Tethet al.1971,Vianet al.2006).The phenomenon is very di- verse ranging from small in-kind gifts through payments for consum- ables and other goods, such as medicines, syringes, bandages or even light bulbs and bed linen, brought by patients in order to receive medical services (Gaalet al.2006). Most often, informal payments compensate for the shortage of health care resources, provide a stimulus for physicians to remain in practice and allow patients to re- ceive adequate care (Allinet al.2006,Belli 2001,Gaalet al.2006).
On the other hand, informal payments aggravate the efficiency and equity problems in the health care system by distorting resource allocation decisions and by impeding access to care for the poor(Ensor 2004,Gaal and McKee 2004,2005). Since the informal cash-flow goes directly from the patient to the medical staff and re- mains unregistered, these payments hinder the estimation of actual health care expenditure as well as future funding requirements of the health care sector (Delchevaet al.1997,Ensor 2004). Thus, deeply ingrained informal practices accepted by both providers and con- sumers, and tolerated or neglected by the government, can become a major impediment to ongoing reforms (Lewis 2002).
There is a great variety of empirical studies in terms of health care providers studied, data collection methods as well as recall peri- ods, not to mention the diversity of the definitions of informal pa- tient payment applied (Stepurko et al. 2010). This makes the comparisons of the results of single-country studies difficult, while cross-country evidence on the scale of informal patient payments from multi-country studies is rare (Central and Eastern European Health Network 2003).
This paper aims to study the scale and patterns of informal patient payments for out-patient and in-patient services in three former- socialist countries: Bulgaria, Hungary and Ukraine. These countries represent an interesting case for comparison because the existence of informal patient payments is a well-recognized characteristic of their health care systems, while the level of their socio-economic develop- ment differs. The countries once shared a common socio-political orientation under the communist regimes. However, their transition to democracy and a market-oriented economy proceeded at different speed, which places them at the moment at different stages of devel- opment. Yet, informal patient payments present a policy challenge in all three countries (Atanasovaet al.2010,Bajiet al.2012,Danyliv et al.2012,Rechel and McKee 2009). Hence, we compare the scale and patterns of informal patient payments in these countries taking into account the diversity of the countries’ health care systems and general socio-economic context.
Our analysis makes an important contribution to the literature on informal payments for health care, not only because of the cross-
country comparison, but also because the study distinguishes be- tween informal cash payments paid to the health care provider for service provision and payments for goods brought by the patient into the health care facilities, although these goods are supposed to be provided free-of-charge to the patient (Allinet al.2006). This lat- ter type of informal patient payments is rarely addressed in the lit- erature but is considered to be important for the estimation of total out-of-pocket payments in a country and of the severity of the health care shortages in the public sector (Gaalet al.2006).
The paper is organized as follows: the background section de- scribes the country specific context, followed by a brief discussion of the factors that influence informal payments for health care. The methods section summarizes the data collection process and intro- duces the variables used in the analysis. This is followed by presenta- tion of results. Discussion and conclusion complete the paper.
Background
Although the three countries had a common socialistic past, now- adays, the socio-economic and political climate in these countries differs in many aspects. Hungary and Bulgaria became EU-members in 2004 and 2007 respectively. During the past two decades, better macro-indicators were observed in the case of Hungary, though the Bulgarian economy currently shows a very respectable development.
Hungary is struggling in the aftermath of the financial crisis, espe- cially by the total debt of roughly 80% of the GDP and a stagnating economy. Meanwhile, Ukraine can be considered a contrasting case to the other two countries, i.e. a non-EU-member, much lower standards of living, ever-present corruption coupled with weak gov- ernance (Pavlovaet al.2012).
Given this diversity of the political and socio-economic context, the health care systems in the three countries differ as well. In Hungary and Bulgaria, social health insurance has replaced the old Semashko system, albeit health care reforms did not always have an even nature. This is especially visible in the delayed structural changes in hospital care provision in Bulgaria (Atanasova et al.
2011), which is in contrast to Hungary, where the number of acute hospital beds was almost halved during the last 20 years (Gaalet al.
2006). At the same time, the Ukrainian health care system has not achieved visible improvements, i.e. the publicly funded health sys- tem is still financed via line-item budgets, infrastructure remains the same as that during the Soviet time, and the system of GPs (general practitioners or family physicians) is still undeveloped (Lekhanet al.
2010). Also, official salaries of medical staff continue to be per- ceived as ‘low’, and in fact, they are lower than the average wage in the industrial sector (State Statistics Committee of Ukraine2013).
This is a common feature shared with Bulgaria and Hungary, and perceived by the medical profession as the key factor in the persist- ence of informal payments (Gaal and McKee 2004 and 2005, Key Messages
• A significantly higher number of users report informal payments to a specialist compared to GPs and also significantly more frequent and higher payments are noted for surgery and pregnancy/childbirth except for emergency childbirth.
• In- patients pay higher amounts when the reason for the informal payment is better services as well as when requested by medical staff.
• In addition to the informal payments, in Bulgaria, Hungary and Ukraine, respondents also report that they brought goods for their last hospitalization at the medical staff’s request.
• Poor knowledge of the formal fee size is associated with higher amounts paid informally for the last physician visit.
Hungarian Central Statistical Office 2013, National Statistical Institute Bulgaria 2013).
In addition to the informal patient payments reported in the three countries (Atanasova et al.2011, Baji et al.2012, Danyliv et al.2012), there are various formal and/or quasi-formal fees in the public system. In Bulgaria, patients are obliged to pay a co-payment for each out-patient visit and for each day of hospitalization for a maximum of 10 days per year. Emergency care is officially free-of- charge and some socio-economic groups are fully or partially ex- empted. However, patients are not always conversant with the ex- emption mechanism as well as with the exact amounts to be paid (Atanasovaet al.2010,Rechelet al.2011).
In Hungary, formal out-of-pocket payments for patient-doctor encounters and for hospital stays were introduced in 2007 and abol- ished in 2008 after a national referendum (Bajiet al.2012). Since then, formal user charges are only applicable in case of certain den- tist services, free choice of health care providers, when bypassing the referral system, and for the above-standard accommodation and meals during hospitalization. Cost sharing is quite extensive for medical products (pharmaceuticals, medical aids and prostheses in ambulatory care) (Gaalet al.2011). Qualitative data suggest that Hungarian patients would accept official service fees, if they received an adequate service provision, which they assure at present via informal payments, or in the expanding private sector (Bajiet al.
2011).
In Ukraine, the Constitution guarantees free-of-charge health care services, which virtually excludes any attempt to introduce for- mal out-of-pocket payments. Nevertheless, a short list of patient fees for ‘luxury’ health care services has been introduced by a gov- ernment decree (Lekhanet al. 2010). Also, given the chronically underfunded health care system, unregulated ‘charitable contribu- tions’ to health care facilities (quasi-formal payments) became a common practice.
By and large, the scale of informal payments is closely coupled with the type of service consumed, as well as with the assertiveness and rank of medical staff (Belliet al.2004,Lewis 2007,Tomini and Maarse 2011), which rather support the fee-for-service explanation of the phenomenon. Informal payments are found to be more extensive in a case of hospitalizations rather than physician visits, and are more conspicuous in a case of surgeons and gynaecologists (Stepurkoet al.
2010). In addition to this, other factors such as the overall corruption, manner of health care provision and lack of patients’ satisfaction have also been reported to be associated with informal payments (Cohen 2012,Radin 2009). Another interesting finding is the association be- tween informal payments and the ignorance regarding entitlements to health care (exclusions, official user charges, exemption rules, etc).
According to Mokhtari and Ashtari (2012)well-informed patients have a lower probability of paying informally. This finding is worth further study for two reasons. First, it suggests that informal payments can be explained by the lack of knowledge on official entitlements, which, in turn, implies that the prevalence of the phenomenon can be decreased by the provision of information to the public. Second, the finding is somewhat contradictory: if a patient did not know whether or not there was any official user charge in effect for the service s/he utilized, how did s/he know whether s/he paid a formal fee, or an in- formal patient payment?
In our comparative study, we explore the association between in- formal patient payments and a number of the above-mentioned
factors in the countries, which are represented in the empirical data by the country citizenship identifier and indicators of patients’
knowledge about the fee, type of service consumed, purpose of in- formal payments as well as its initiator.
Methods
We use national representative data collected in two successive years (July-August 2010 and 2011) in Bulgaria, Hungary, and Ukraine.
The country samples are drawn based on a multi-staged random probability approach: after the selection of sampling points (accord- ing to regional, urban/rural and ethnic characteristics), about 10 addresses/households per sampling point are chosen using the ran- dom route method. One household member older than 18 years is selected for the survey using the ‘last birthday’ principle. The data collection was finalized after having about 1000 and 800 interviews per country in 2010 and 2011 respectively. A description of key socio-demographic variables and response rates per country per year can be found inSupplementary Material, Table S1. Individuals, who refused or were unable to participate, were replaced following the same selection approach. Additionally, about 0.5–4% of the ques- tionnaires per country were not included in the analysis after quality control and because of inconsistencies in the answers.
Respondents were interviewed face-to-face in their homes using a standardized questionnaire identical for all countries.
Supplementary Material, Table S2 presents the exact English word- ing of the questions analysed in this paper. In 2010 and 2011, respondents were asked about their consumption and expenditure (total and informal) on out- and in-patient health care services dur- ing the preceding 12 months. For informal patient payments, re- spondents were asked to include both cash payment and the value of in-kind gifts. Socio-demographic data were surveyed in both years.
In 2011, more detailed information was collected on payments for the last visit to a physician and last hospitalization, including type of care, size of formal and informal payments, purpose and mechanism of the informal payment, as well as payments for other goods (e.g. medical supplies, pharmaceuticals, bed linen, food) that the patient brought for the treatment (in-kind contribution). To re- duce recall bias, we exclude from the analysis visits and hospitaliza- tions which have taken place before 2009 and include information on the last physician visit and last hospitalization that have taken place since 2009 only (i.e. in the preceding 2.5 years, from January 2009 till the time of data collection – the Summer of 2010). In add- ition to potential recall bias, the limitations of our study are related to the length of the period covered (only 2–3 subsequent years), cross-sectional design of the surveys, and the sensitive nature of the questions on informal patient payments.
The two types of data collection, i.e. annual informal payments for health care services and informal payments for the last visit/hos- pitalization, serve two different research purposes: the former is to address the scale of the phenomenon and the latter is to understand the process. It is not possible to obtain information on the magni- tude of informal payments, if only payments for the last visit/hospi- talization are studied, while data on annual payments alone are not sufficient to analyse the process of informal payments. Therefore, we do not compare annual payments and payments for the last phys- ician visit/hospitalization in our analysis, the two approaches are used to complement each other.
Regarding the scale of informal payments, both mean and me- dian values of the amounts1spent either totally or informally on health care services, are presented in theTables 1and2. However, the data presented in the text are the median values.
We use binary logistic regression analysis to determine the extent to which socio-demographic features as well as other factors (e.g. year of service consumption, quantity of services used) including structural factors (country citizenship, fee awareness, nature, type of service) are associated with the experience of paying informally and bringing goods during the last hospitalization at the staff’s requests.
Considering possible non-linear effects, such variables indicating year, fee awareness, residence place and type of service are included as bin- ary indicators in the regression analyses. Related to type of service, GP
visit is taken as the base category in last physician model since it pre- sents the least complicated care. For the same reason, planned proced- ure not related to pregnancy/childbirth is taken as the base service category in the last hospitalization model2.Binary logistic regression analyses is performed on health care users only. The correlation be- tween the independent variables included in the analysis is weak (cor- relation coefficient<0.6) or insignificant (P>0.05).
Also, we carry out linear regression analysis with the amounts paid informally (either during the year prior to the survey or for the last visit/hospitalization), as well as with the monetary value of goods brought during the last hospitalization on staff’s requests. In case of the last visit/hospitalization, we use an extended set of inde- pendent variables, which also includes factors such as the purpose of the informal payment (better attention, better services or other rea- sons) and the initiator of the payment (expected/required by medical Table 1.Health care services consumption and payments during the last 12 monthsa
Bulgaria Hungary Ukraine
2010 2011 2010 2011 2010 2011
Use of out-patient (phys- ician) services during the last 12 months
No N(%) 239 (24.5) 226 (27.7) 207 (20.0) 123 (15.3) 426 (42.7) 345 (43.2) Yes N(%) 735 (75.5) 589 (72.3) 826 (80.0) 682 (84.7) 572 (57.3) 454 (56.8)
Number of visits Median 3.00 3.00 4.00 4.00 2.00 2.00
Mean (SD) 5.81 (6.48) 5.50 (5.74) 6.58 (6.29) 6.51 (7.05) 3.45 (4.25) 2.88 (3.82) Payments for out-patient
(physician) services by users
No N(%) 172 (24.2) 92 (16.0) 594 (72.7) 483 (70.8) 246 (43.3) 213 (47.1) Yes N(%) 540 (75.8) 483 (84.0) 223 (27.3) 199 (29.2) 322 (56.7) 236 (52.6)
Total payments Median 6.1 5.2 36.4 37.8 19.2 20.7
Mean (SD) 27.33 (83.3) 19.0 (51.4) 80.3 (115.5) 73.9 (101.8) 60.8 (123.5) 85.8 (153.1) Informal payments for
out-patient (physician) services by users
No N(%) 658 (90.3) 539 (91.8) 647 (78.8) 540 (79.2) 359 (63.3) 294 (65.0)
Yes N(%) 71 (9.7) 48 (8.2) 174 (21.2) 142 (20.8) 208 (36.7) 158 (35.0)
Total informal payments
Median 14.1 10.4 36.4 37.8 9.6 10.4
Mean (SD) 29.1 (36.2) 23.8 (35.9) 61.3 (80.1) 75.3 (100.8) 32.2 (62.4) 52.8 (121.2) Knowledge of the official
fees for physician’s services
Never N(%) 88 (12.7) 88 (15.9) 570 (69.4) 468 (68.7) 280 (49.0) 284 (62.6) Somewhat N(%) 207 (29.9) 172 (31.0) 185 (22.5) 163 (23.9) 227 (39.7) 130 (28.6)
Always N(%) 397 (57.4) 294 (53.1) 66 (8.0) 50 (7.3) 65 (11.4) 40 (8.8)
Use of in-patient (hos- pital) services during the last 12 months
No N(%) 831 (83.0) 689 (84.3) 817 (78.9) 656 (81.5) 816 (81.6) 647 (81.1) Yes N(%) 170 (17.0) 128 (15.7) 219 (21.1) 149 (18.5) 184 (18.4) 151 (18.9) Number of
hospitalizations
Median 1.00 1.00 1.00 1.00 1.00 1.00
Mean (SD) 1.73 (2.59) 1.52 (0.96) 1.88 (2.17) 1.69 (1.82) 1.48 (0.81) 1.34 (0.81) Payments for in-patient
(hospital) services by users
No N(%) 52 (33.1) 45 (36.9) 115 (53.2) 58 (38.9) 48 (27.0) 37 (25.2)
Yes N(%) 105 (66.9) 77 (63.1) 101 (46.8) 91 (61.1) 130 (73.0) 110 (74.8)
Total payments Median 25.6 25.0 90.9 75.6 95.9 155.3
Mean (SD) 91.1 (153.1) 103.0 (197.4) 134.8 (131.3) 121.5 (126.4) 195.9 (235.2) 219.2 (219.5) Informal payments for in-
patient (hospital) ser- vices by users
No N(%) 120 (78.4) 108 (88.5) 119 (55.1) 62 (42.2) 87 (49.4) 84 (57.1)
Yes N(%) 33 (21.6) 14 (11.5) 97 (44.9) 85 (57.8) 89 (50.6) 63 (42.9)
Total informal payments
Median 10.2 31.3 100.0 75.6 38.3 51.8
Mean (SD) 98.5 (188.7) 113.2 (236.3) 123.7 (122.8) 107.1 (101.1) 81.2 (121.1) 145.0 (185.7) Knowledge of the official
fees for hospital services
Never N(%) 31 (20.3) 32 (23.5) 154 (70.6) 100 (67.6) 87 (47.3) 96 (63.6) Somewhat N(%) 46 (30.1) 44 (38.3) 47 (21.6) 36 (24.3) 65 (35.3) 38 (25.2)
Always N(%) 76 (49.7) 39 (33.9) 17 (7.8) 12 (8.1) 32 (17.4) 17 (11.3)
aAll amounts in the table are presented in Euro. Firstly, in local currency for 2011 and 2009 amounts are converted to 2010 values based on Consumer Price Index per country (source: World Bank), then converted from local currency to Euro based on average conversion rate for 2010 (source: ESB).
1 Endnotes
All variables that present amounts in national currency (pay- ments or value of goods) are first adjusted for inflation (base year 2010) using data provided by the World Bank’s Consumer Price Index (World Bank 2012). The adjusted amounts are then converted into Euros using the average ex- change rate for 2010 (ESB Consultancy 2012). We also run the linear regression analysis after a conversion of the amounts into Int.$PPP but we do not notice significant differences.
Thus, we only present results for amounts in Euro.
2 The indicators of the hospitalization type are compiled from two original variables on (a) the type of hospitalization (four answer options: planned surgery, planned procedure, emer- gency surgery, emergency procedure) and (b) whether the last hospitalization was related to pregnancy or childbirth into seven indicators. Planned procedure not related to pregnancy/
childbirth was taken as a base category as it is expected to be the least complicated type of hospital care.
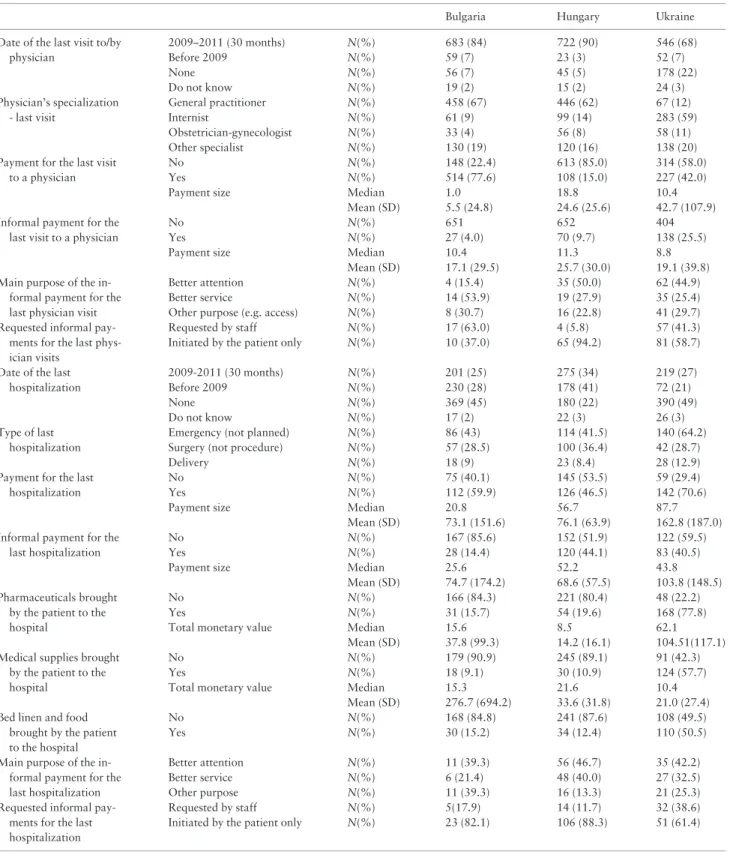
Table 2Informal payments for the last physician visit/hospitalization (2009-2011)a
Bulgaria Hungary Ukraine
Date of the last visit to/by physician
2009–2011 (30 months) N(%) 683 (84) 722 (90) 546 (68)
Before 2009 N(%) 59 (7) 23 (3) 52 (7)
None N(%) 56 (7) 45 (5) 178 (22)
Do not know N(%) 19 (2) 15 (2) 24 (3)
Physician’s specialization - last visit
General practitioner N(%) 458 (67) 446 (62) 67 (12)
Internist N(%) 61 (9) 99 (14) 283 (59)
Obstetrician-gynecologist N(%) 33 (4) 56 (8) 58 (11)
Other specialist N(%) 130 (19) 120 (16) 138 (20)
Payment for the last visit to a physician
No N(%) 148 (22.4) 613 (85.0) 314 (58.0)
Yes N(%) 514 (77.6) 108 (15.0) 227 (42.0)
Payment size Median 1.0 18.8 10.4
Mean (SD) 5.5 (24.8) 24.6 (25.6) 42.7 (107.9)
Informal payment for the last visit to a physician
No N(%) 651 652 404
Yes N(%) 27 (4.0) 70 (9.7) 138 (25.5)
Payment size Median 10.4 11.3 8.8
Mean (SD) 17.1 (29.5) 25.7 (30.0) 19.1 (39.8) Main purpose of the in-
formal payment for the last physician visit
Better attention N(%) 4 (15.4) 35 (50.0) 62 (44.9)
Better service N(%) 14 (53.9) 19 (27.9) 35 (25.4)
Other purpose (e.g. access) N(%) 8 (30.7) 16 (22.8) 41 (29.7)
Requested informal pay- ments for the last phys- ician visits
Requested by staff N(%) 17 (63.0) 4 (5.8) 57 (41.3)
Initiated by the patient only N(%) 10 (37.0) 65 (94.2) 81 (58.7)
Date of the last hospitalization
2009-2011 (30 months) N(%) 201 (25) 275 (34) 219 (27)
Before 2009 N(%) 230 (28) 178 (41) 72 (21)
None N(%) 369 (45) 180 (22) 390 (49)
Do not know N(%) 17 (2) 22 (3) 26 (3)
Type of last hospitalization
Emergency (not planned) N(%) 86 (43) 114 (41.5) 140 (64.2)
Surgery (not procedure) N(%) 57 (28.5) 100 (36.4) 42 (28.7)
Delivery N(%) 18 (9) 23 (8.4) 28 (12.9)
Payment for the last hospitalization
No N(%) 75 (40.1) 145 (53.5) 59 (29.4)
Yes N(%) 112 (59.9) 126 (46.5) 142 (70.6)
Payment size Median 20.8 56.7 87.7
Mean (SD) 73.1 (151.6) 76.1 (63.9) 162.8 (187.0) Informal payment for the
last hospitalization
No N(%) 167 (85.6) 152 (51.9) 122 (59.5)
Yes N(%) 28 (14.4) 120 (44.1) 83 (40.5)
Payment size Median 25.6 52.2 43.8
Mean (SD) 74.7 (174.2) 68.6 (57.5) 103.8 (148.5) Pharmaceuticals brought
by the patient to the hospital
No N(%) 166 (84.3) 221 (80.4) 48 (22.2)
Yes N(%) 31 (15.7) 54 (19.6) 168 (77.8)
Total monetary value Median 15.6 8.5 62.1
Mean (SD) 37.8 (99.3) 14.2 (16.1) 104.51(117.1) Medical supplies brought
by the patient to the hospital
No N(%) 179 (90.9) 245 (89.1) 91 (42.3)
Yes N(%) 18 (9.1) 30 (10.9) 124 (57.7)
Total monetary value Median 15.3 21.6 10.4
Mean (SD) 276.7 (694.2) 33.6 (31.8) 21.0 (27.4) Bed linen and food
brought by the patient to the hospital
No N(%) 168 (84.8) 241 (87.6) 108 (49.5)
Yes N(%) 30 (15.2) 34 (12.4) 110 (50.5)
Main purpose of the in- formal payment for the last hospitalization
Better attention N(%) 11 (39.3) 56 (46.7) 35 (42.2)
Better service N(%) 6 (21.4) 48 (40.0) 27 (32.5)
Other purpose N(%) 11 (39.3) 16 (13.3) 21 (25.3)
Requested informal pay- ments for the last hospitalization
Requested by staff N(%) 5(17.9) 14 (11.7) 32 (38.6)
Initiated by the patient only N(%) 23 (82.1) 106 (88.3) 51 (61.4)
aAll amounts in the table are presented in Euro. Firstly, in local currency for 2011 and 2009 amounts are converted to 2010 values based on Consumer Price Index per country (source: World Bank), then converted from local currency to Euro based on average conversion rate for 2010 (source: ESB).
staff or solely initiated by the patient). This part of the analysis in- cludes only the health care users, who paid informally.
We first run the regressions per country. Then, we pool the data for the three countries and analyse them together including country indicators (Hungary is taken as a reference category). When com- pared to the country models, the pooled-data models do not lead to different conclusions although occasionally we miss some significant or insignificant effects per country. In this paper, we only present the pooled-data regression models. In all pooled-data models, when- ever possible, we include an interaction between year and country indicators to check for year difference per country.
Results
Descriptive statistics
AsTables 1and2indicate (for both the preceding 12 months and last visit/hospitalization), patient payments for health care services exist in all three countries. However, in Bulgaria, these are mainly official payments since the share of service users who pay informally is much lower than the proportion of users who make any payment.
In contrast, in Hungary, these two proportions are rather similar per service type, which means that informal payments predominate in this country. By the same token, in Ukraine, both types of payments (namely quasi-official and informal payments) are spread. In all three countries, the proportion of in-patient service users who pay informally as well as the amounts spent on in-patient care are higher compared to that in out-patient care. We also observe inTables 1 and2that the mean values for all countries are much higher than the median values, while the standard deviations are much larger than the mean values. This indicates a large variability in the amounts stated by the respondents. Below, we refer to the median values, which are not affected by outliers.
The annual informal payments for out-patient services are reported by 9.7% of Bulgarian health care users in 2010 and 8.2% in 2011 (a median value of 14.1 and 10.4 Euro per year per payer in 2010 and 2011 respectively), 21.2% of Hungarian health care users in 2010 and 20.8% in 2011 (a median value of 36.4 and 37.8 Euro, respectively) and 36.7 and 35.0% of Ukrainian health care users(a median value of 9.6 and 10.4 Euro respectively) (seeTable 1). For informal payments for the last physician visit, 4.0, 9.7 and 25.5% paid informally in the respective countries (a median value of 10.4 Euro in Bulgaria, 11.3 Euro in Hungary and 8.8 Euro in Ukraine per visit per payer) (see Table 2).
In case of in-patient services in the preceding year, 21.6% of the health care users in 2010 and 11.5% in 2011 paid informally in Bulgaria, 44.9% and 57.8% in Hungary, while 50.6% and 42.9%
in Ukraine. The median amount of the informal payment is 31.3Euro per year per payer in Bulgaria in 2011, 75.6 Euro in Hungary and 51.8 Euro in Ukraine (Table 1). Regarding the last hospitalization (Table 2), in Hungary, 44.1% paid informally me- dian value of 52.2 Euro per payer and in Ukraine, 40.5% paid infor- mally median value of 43.8 Euro. In Bulgaria, this proportion is lower (14.4% paid informally with a median value of 25.6 Euro).
Table 2provides additional information on the main reason for the informal payment during the last physician visit/hospitalization and on the payment initiator (staff or patient).In all three countries, the most frequent reason mentioned is ‘better attention’ of the med- ical staff (50 and 46.7%in Hungary and 44.9 and 42.2% in Ukraine for out- and in-patient services respectively, and 39.3% in Bulgaria for in-patient services). In case of out-patient service in Bulgaria,
‘better service’ (53.9%) is indicated as the main reason. ‘Better
service’ is also quite often mentioned as the main reason of making informal payments for hospitalizations (40%) in Hungary, where virtually all patients (94.2% of out-patients and 88.3% of in- patients), who paid informally, do this on their own initiative. In Ukraine, the share of out- and in-patients, who initiated informal payments is somewhat lower: 58.7 and 61.4%, respectively.
Bulgaria is an interesting mix: where 82.1% of in-patients initiated informal payment by themselves in contrast to 63.0% of out- patients who report that the informal payment was requested.
About half of the respondents in Bulgaria always know the fee size in contrast to the much smaller shares in Hungary and Ukraine (see Table 1). Though, in 2011about 15.9% of out-patients and about 23.5% of in-patients in Bulgaria report that they never knew the size of the formal fee.
In addition to the informal payments, in all three countries, re- spondents also report that they brought goods for their last hospital- ization at the medical staff’s request (see the data at the bottom of Table 2). This includes pharmaceuticals, medical supplies, but also bed linen and food. The percentage of those, who brought such items to the hospital, is rather similar in Bulgaria and Hungary: 15–
20% in the case of pharmaceuticals, about 10% in the case of med- ical supplies, and 10–15% in the case of bed linen and food. In Ukraine, these shares are much higher: 77.8% brought pharmaceut- icals, 57.7% medical supplies and 50.5% bed linen. Also, the data show a relatively moderate median value of pharmaceuticals brought by patients in Bulgaria (15.6 Euro per hospitalization) and Hungary (8.5 Euro) in contrast to Ukraine (62.1 Euro). At the same time, the median value of medical supplies brought by patients is the highest in Hungary (21.6 Euro).
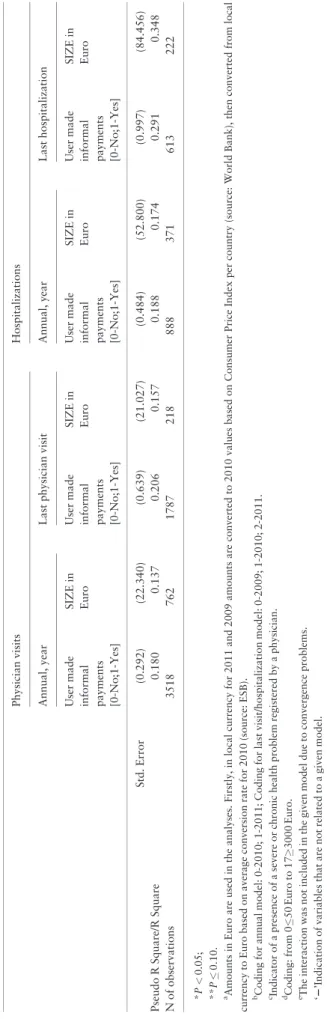
Results of the regression analyses on informal patient payments
Table 3presents the results of the binary logistic and linear regres- sion analyses based on the annual informal payments for out-patient and in-patient services, and for the last visit/hospitalization. The re- sults indicate that in 2010 (reference year category), compared to Hungary (reference country category), the number of out-patient users who paid informally in the preceding 12 month, was signifi- cantly higher in Ukraine and lower in Bulgaria (P<0.05) but there were no statistically significant cross-country differences with regard to the annual amounts of informal payments (see annual physician visits models). The last physician visit models confirm that payments for physician visits in 2010 in Ukraine were less frequent than in Hungary (P<0.1), and that there are no statistically significant dif- ferences in payments across countries. For hospitalization in 2010, we observe the same pattern for Bulgaria, i.e. a significantly lower number of informal payers in Bulgaria compared to Hungary in both the annual model and last hospitalization model (P<0.05).
But we also observe significantly higher payments for the last hospi- talization in 2010 in Bulgaria (P<0.05) and Ukraine (P<0.1) com- pared to Hungary.
For physician visits (see all four physician visits models), the fre- quency of paying informally and informal payment size remain vir- tually the same over the years, except for informal payments for the last physician visit in Hungary in 2009 which are less frequent than in 2010 (see coefficient for 2009,P<0.05). However, for hospital- ization, informal payments for hospital services became more likely in Hungary in 2011 (see coefficient for 2011,P<0.05), and less likely in Bulgaria (see interaction Bulgaria*2011, P<0.05) and Ukraine (see interaction Ukraine*2011,P<0.1).However, the an- nual amount of informal payment for hospitalizations in Ukraine
Table3Informalpaymentsforservices—resultsofregressionanalysisa PhysicianvisitsHospitalizations Annual,yearLastphysicianvisitAnnual,yearLasthospitalization Usermade informal payments [0-No;1-Yes]
SIZEin EuroUsermade informal payments [0-No;1-Yes]
SIZEin EuroUsermade informal payments [0-No;1-Yes]
SIZEin EuroUsermade informal payments [0-No;1-Yes]
SIZEin Euro TypeofregressionanalysisBinarylogisticLinearBinarylogisticLinearBinarylogisticLinearBinarylogisticLinear Countryindicator:Hungary–basecategory BulgariaCoefficient20.958*–17.99420.924217.83021.000*243.93521.000*85.537* [0-No;1-Yes]Std.Error(0.193)(14.776)(0.625)(20.596)(0.316)(33.593)(0.508)(42.459) UkraineCoefficient1.064*28.8340.867**211.8100.457227.6710.62164.809** [0-No;1-Yes]Std.Error(0.175)(12.941)(0.480)(15.017)(0.294)(29.145)(0.432)(33.398) Year:2010–basecategory Year:2009Coefficient2221.845*229.6342220.17027.526 [0-No;1-Yes]Std.Error(0.622)(21.403)22(0.360)(25.803) Year:2011Coefficient20.0467.36420.286212.1580.472*230.6250.2135.086 [0-No;1-Yes]Std.Error(0.137)(10.287)(0.413)(13.787)(0.235)(21.440)(0.344)(23.989) Country*Yearinteractions Bulgaria*2009Coefficient22excludedeexcludede2220.927223.187 [0-No;1-Yes]Std.Error(0.839)(73.606) Bulgaria*2011Coefficient20.170223.97820.3121.06521.104*68.64620.630296.141** [0-No;1-Yes]Std.Error(0.255)(20.718)(0.669)(22.742)(0.436)(49.702)(0.617)(50.781) Ukraine*2009Coefficient22excludedeexcludede220.024284.929* [0-No;1-Yes]Std.Error(0.588)(41.572) Ukraine*2011Coefficient0.06812.6220.2420.93320.580**96.727*20.468224.542 [0-No;1-Yes]Std.Error(0.196)(14.043)(0.473)(15.204)(0.336)(31.955)(0.499)(35.939) Feeawareness:Never–basecategory Feeawareness:SometimesCoefficient0.485*3.3750.644*212.362*0.790*10.4620.668*212.282 [0-No;1-Yes]Std.Error(0.103)(7.348)(0.176)(5.385)(0.182)(16.916)(0.238)(16.756) Feeawareness:AlwaysCoefficient0.293*20.697*0.751*29.3650.31847.720**0.563**2.451 [0-No;1-Yes]Std.Error(0.141)(9.967)(0.250)(7.739)(0.223)(22.028)(0.311)(23.992) Typeofphysician:GP–basecategory InternistCoefficient220.987*2.2102222 [0-No;1-Yes]Std.Error(0.227)(7.280) Obstetrician–GynecologistCoefficient221.110*21.8732222 [0-No;1-Yes]Std.Error(0.294)(9.776) OtherspecialistCoefficient220.815*11.3002222 [0-No;1-Yes]Std.Error(0.232)(7.735) Typeofhospitalization:Planedprocedurenotrelatedtochildbirth–basecategory EmergencyprocedurenotCoefficient2222220.26012.139 birth-related[0-No;1-Yes]Std.Error(0.304)(23.883) PlannedsurgerynotrelatedtobirthCoefficient2222221.261*41.866** [0-No;1-Yes]Std.Error(0.349)(24.592) (continued)
Table3(continued) PhysicianvisitsHospitalizations Annual,yearLastphysicianvisitAnnual,yearLasthospitalization Usermade informal payments [0-No;1-Yes]
SIZEin EuroUsermade informal payments [0-No;1-Yes]
SIZEin EuroUsermade informal payments [0-No;1-Yes]
SIZEin EuroUsermade informal payments [0-No;1-Yes]
SIZEin Euro Emergencysurgerynotbirth-relatedCoefficient2222220.822**64.263** [0-No;1-Yes]Std.Error(0.452)(32.632) PlannedprocedurerelatedtobirthCoefficient2222222.346*82.553* [0-No;1-Yes]Std.Error(0.538)(37.406) EmergencyprocedurerelatedtoCoefficient2222222.152*63.089** childbirth[0-No;1-Yes]Std.Error(0.471)(34.039) Plannedsurgerychildbirth-relatedCoefficient2222222.566*65.682** [0-No;1-Yes]Std.Error(0.560)(37.058) Emergencysurgerychildbirth-relatedCoefficient2222223.285*84.552* [0-No;1-Yes]Std.Error(0.758)(42.359) PaidforbetterserviceCoefficient2225.401**22236.353** [0-No;1-Yes]Std.Error(2.919)(20.471) PaidforbetterattentionCoefficient22225.467**22224.126 [0-No;1-Yes]Std.Error(2.921)(20.227) AskedtopayinformallybCoefficient2220.190222103.508* [0-No;1-Yes]Std.Error(0.257)(19.666) Numberofvisits/hospitalizations/nightsCoefficient0.060*4.242*220.135*26.262*0.0120.303 Std.Error(0.008)(0.490)22(0.058)(4.162)(0.008)(0.402) AgeCoefficient20.0032.0210.0002.407*20.0060.42220.0030.562 [Years]Std.Error(0.003)(0.219)(0.006)(0.175)(0.005)(0.516)(0.008)(0.605) Gender[0-Male;Coefficient0.368*24.7920.285**6.2150.12827.4712.771*44.735 1-Female]Std.Error(0.093)(7.019)(0.170)(5.500)(0.153)(15.456)(0.449)(31.521) Residence:Village–basecategory Residence:TownCoefficient20.509*12.68120.1366.87820.518*7.27220.2244.078 [0-No;1-Yes]Std.Error(0.107)(7.935)(0.197)(6.373)(0.180)(17.454)(0.241)(17.588) Residence:CityCoefficient20.1683.9630.2463.85420.420**36.157**20.10125.060 [0-No;1-Yes]Std.Error(0.119)(4.499)(0.213)(6.726)(0.215)(20.194)(0.288)(21.539) Education[from0-ISCED0toCoefficient0.0672.91320.0412.2390.03522.15520.0993.582 5-ISCED5þ6]Std.Error(0.042)(3.096)(0.075)(2.378)(0.074)(7.358)(0.092)(6.833) HealthproblemscCoefficient0.518*4.4870.18915.762*0.429*22.9860.681*42.002* [0-No;1-Yes]Std.Error(0.107)(7.881)(0.188)(6.152)(0.190)(19.405)(0.271)(20.169) NumberofpersonsinCoefficient20.0355.269**20.0442.12920.0978.12020.228*6.307 householdStd.Error(0.040)(3.082)(0.072)(2.332)(0.068)(7.137)(0.103)(7.936) Householdincomed[from0-Lessthan50Coefficient0.061*2.6890.060**20.1470.093*5.979**0.113*5.617** Euroto17-Morethan3000Euro]Std.Error(0.018)(1.357)(0.032)(0.963)(0.031)(3.096)(0.041)(2.948) ConstantCoefficient22.654*24.16923.304*32.66221.079*246.36324.260*2195.937** (continued)
was higher in 2011 compared to 2010 (see interaction Ukraine*2011,P<0.05). We also notice that in Ukraine in 2009, payers paid less for the last hospitalization than in 2010 (P<0.05) while in Bulgaria in 2011 payers paid less for the last hospitalization (P<0.1). All associations mentioned above have a level of statistical significance ofP<0.05 orP0.10 (seeTable 3for more details).
A significantly higher number of users report informal payments to a specialist compared to GPs (P<0.05). Also, when compared to planned procedure not related to pregnancy/childbirth, significantly larger share and higher payments are made for the last hospitaliza- tion which include planned surgery (P<0.05 for the share and P<0.1 for size) and emergency surgery not related to pregnancy/
childbirth (P<0.1 for the share andP<0.1 for size). Applying the same base category, a higher share of informal payers for all types of last hospitalizations which are related to pregnancy/childbirth (P<0.05)is observed. We also observe that patients pay higher amounts when the pregnancy/childbirth-related hospitalization is characterized as a planned procedure and emergency surgery (P<0.05), planned surgery and emergency procedure (P<0.1).
Moreover, higher informal payments occur when the reason for the informal payment was ‘better services’ (P<0.01 for both last phys- ician visit and last hospitalization models), when it was requested by medical staff during last hospitalization (P<0.05) and lower amounts are given under ‘better attention of physician’ reason (P<0.1).
Those who use health care more frequently per year (P<0.05) and those who are more aware of the size of the formal fee, have a higher probability of paying informally (P<0.05 for out-patient care and last physician models,P<0.05 for ‘sometimes’ indicator in both in-patient care andP<0.1 for ‘always’ indicator in last hospi- talization models) and make higher annual informal payments(P<0.1 for ‘always’ indicator). In contrast, the model of the last physician visit model suggests that poor knowledge of the formal fee size is associated with higher amounts of informal pay- ments for the last physician visit (P<0.05 for ‘sometimes’ indica- tor). This inconsistency in the association between informal payments and knowledge of the official fee is an important finding which is discussed in the next section.
Regarding socio-demographic characteristics, a higher probabil- ity of making informal payments is observed among female (P<0.05 for out-patient and last hospitalization model,P<0.1 for last physician model), among those who have health problems (P<0.05 for annual models and last hospitalization model), and among members of wealthier households(P<0.05 for annual and last hospitalization models).A lower probability is noted among citi- zens of towns (P<0.05 for annual models)
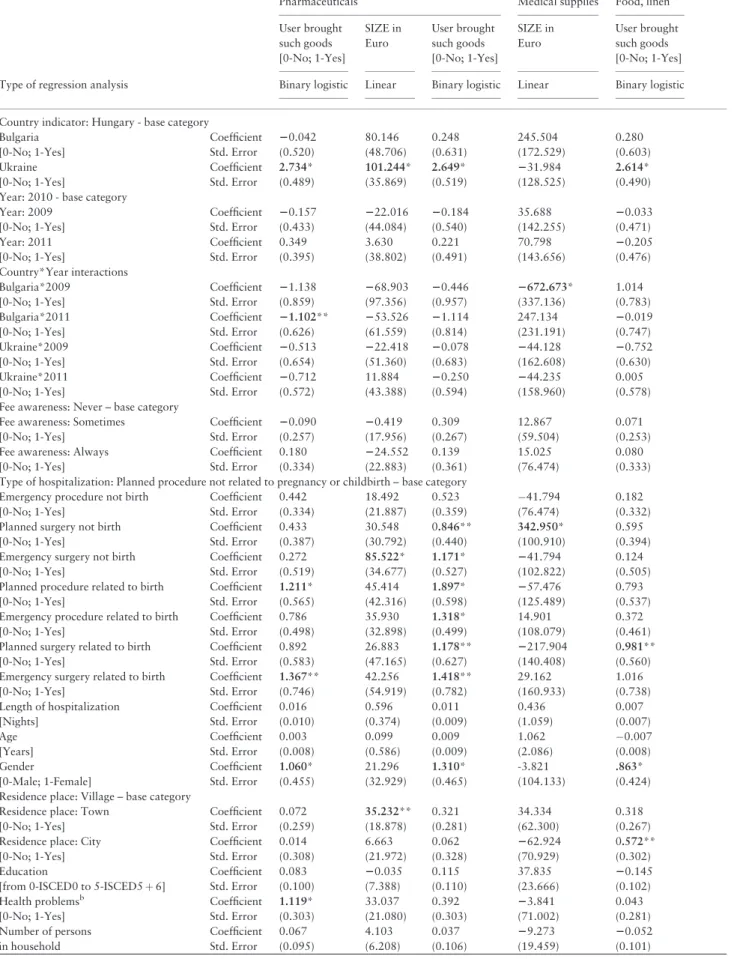
Results of the regression analyses on goods brought by patients during the last hospitalization
Table 4presents the results of the regression analyses carried out for bringing pharmaceuticals, medical supplies and food and bed linen for the last hospitalization. For all three types of goods, for 2010 (reference year), we find a significantly more extended practice of bringing goods to the hospital in Ukraine as compared to Hungary (P<0.05), as well as higher payments for pharmaceuticals brought to the hospital in Ukraine (P<0.05) compared to Hungary.
Although there are no significant differences across years for Hungary and Ukraine, the amount spent on medical supplies was lower in Bulgaria in 2009 compared to 2010 (P<0.05). The same holds for the share of in-patients with expenditures on pharmaceut- icals which was lower in Bulgaria in 2011 compared to 2010 Table3(continued) PhysicianvisitsHospitalizations Annual,yearLastphysicianvisitAnnual,yearLasthospitalization Usermade informal payments [0-No;1-Yes]
SIZEin EuroUsermade informal payments [0-No;1-Yes]
SIZEin EuroUsermade informal payments [0-No;1-Yes]
SIZEin EuroUsermade informal payments [0-No;1-Yes]
SIZEin Euro Std.Error(0.292)(22.340)(0.639)(21.027)(0.484)(52.800)(0.997)(84.456) PseudoRSquare/RSquare0.1800.1370.2060.1570.1880.1740.2910.348 Nofobservations35187621787218888371613222 *P<0.05; **P0.10. aAmountsinEuroareusedintheanalyses.Firstly,inlocalcurrencyfor2011and2009amountsareconvertedto2010valuesbasedonConsumerPriceIndexpercountry(source:WorldBank),thenconvertedfromlocal currencytoEurobasedonaverageconversionratefor2010(source:ESB). bCodingforannualmodel:0-2010;1-2011;Codingforlastvisit/hospitalizationmodel:0-2009;1-2010;2-2011. cIndicatorofapresenceofasevereorchronichealthproblemregisteredbyaphysician. dCoding:from050Euroto173000Euro. eTheinteractionwasnotincludedinthegivenmodelduetoconvergenceproblems. ‘2’Indicationofvariablesthatarenotrelatedtoagivenmodel.
Table 4Goods brought by patients during the last hospitalization—regression resultsa
Pharmaceuticals Medical supplies Food, linen
User brought such goods [0-No; 1-Yes]
SIZE in Euro
User brought such goods [0-No; 1-Yes]
SIZE in Euro
User brought such goods [0-No; 1-Yes]
Type of regression analysis Binary logistic Linear Binary logistic Linear Binary logistic
Country indicator: Hungary - base category
Bulgaria Coefficient 20.042 80.146 0.248 245.504 0.280
[0-No; 1-Yes] Std. Error (0.520) (48.706) (0.631) (172.529) (0.603)
Ukraine Coefficient 2.734* 101.244* 2.649* 231.984 2.614*
[0-No; 1-Yes] Std. Error (0.489) (35.869) (0.519) (128.525) (0.490)
Year: 2010 - base category
Year: 2009 Coefficient 20.157 222.016 20.184 35.688 20.033
[0-No; 1-Yes] Std. Error (0.433) (44.084) (0.540) (142.255) (0.471)
Year: 2011 Coefficient 0.349 3.630 0.221 70.798 20.205
[0-No; 1-Yes] Std. Error (0.395) (38.802) (0.491) (143.656) (0.476)
Country*Year interactions
Bulgaria*2009 Coefficient 21.138 268.903 20.446 2672.673* 1.014
[0-No; 1-Yes] Std. Error (0.859) (97.356) (0.957) (337.136) (0.783)
Bulgaria*2011 Coefficient 21.102** 253.526 21.114 247.134 20.019
[0-No; 1-Yes] Std. Error (0.626) (61.559) (0.814) (231.191) (0.747)
Ukraine*2009 Coefficient 20.513 222.418 20.078 244.128 20.752
[0-No; 1-Yes] Std. Error (0.654) (51.360) (0.683) (162.608) (0.630)
Ukraine*2011 Coefficient 20.712 11.884 20.250 244.235 0.005
[0-No; 1-Yes] Std. Error (0.572) (43.388) (0.594) (158.960) (0.578)
Fee awareness: Never – base category
Fee awareness: Sometimes Coefficient 20.090 20.419 0.309 12.867 0.071
[0-No; 1-Yes] Std. Error (0.257) (17.956) (0.267) (59.504) (0.253)
Fee awareness: Always Coefficient 0.180 224.552 0.139 15.025 0.080
[0-No; 1-Yes] Std. Error (0.334) (22.883) (0.361) (76.474) (0.333)
Type of hospitalization: Planned procedure not related to pregnancy or childbirth – base category
Emergency procedure not birth Coefficient 0.442 18.492 0.523 41.794 0.182
[0-No; 1-Yes] Std. Error (0.334) (21.887) (0.359) (76.474) (0.332)
Planned surgery not birth Coefficient 0.433 30.548 0.846** 342.950* 0.595
[0-No; 1-Yes] Std. Error (0.387) (30.792) (0.440) (100.910) (0.394)
Emergency surgery not birth Coefficient 0.272 85.522* 1.171* 241.794 0.124
[0-No; 1-Yes] Std. Error (0.519) (34.677) (0.527) (102.822) (0.505)
Planned procedure related to birth Coefficient 1.211* 45.414 1.897* 257.476 0.793
[0-No; 1-Yes] Std. Error (0.565) (42.316) (0.598) (125.489) (0.537)
Emergency procedure related to birth Coefficient 0.786 35.930 1.318* 14.901 0.372
[0-No; 1-Yes] Std. Error (0.498) (32.898) (0.499) (108.079) (0.461)
Planned surgery related to birth Coefficient 0.892 26.883 1.178** 2217.904 0.981**
[0-No; 1-Yes] Std. Error (0.583) (47.165) (0.627) (140.408) (0.560)
Emergency surgery related to birth Coefficient 1.367** 42.256 1.418** 29.162 1.016
[0-No; 1-Yes] Std. Error (0.746) (54.919) (0.782) (160.933) (0.738)
Length of hospitalization Coefficient 0.016 0.596 0.011 0.436 0.007
[Nights] Std. Error (0.010) (0.374) (0.009) (1.059) (0.007)
Age Coefficient 0.003 0.099 0.009 1.062 0.007
[Years] Std. Error (0.008) (0.586) (0.009) (2.086) (0.008)
Gender Coefficient 1.060* 21.296 1.310* -3.821 .863*
[0-Male; 1-Female] Std. Error (0.455) (32.929) (0.465) (104.133) (0.424)
Residence place: Village – base category
Residence place: Town Coefficient 0.072 35.232** 0.321 34.334 0.318
[0-No; 1-Yes] Std. Error (0.259) (18.878) (0.281) (62.300) (0.267)
Residence place: City Coefficient 0.014 6.663 0.062 262.924 0.572**
[0-No; 1-Yes] Std. Error (0.308) (21.972) (0.328) (70.929) (0.302)
Education Coefficient 0.083 20.035 0.115 37.835 20.145
[from 0-ISCED0 to 5-ISCED5þ6] Std. Error (0.100) (7.388) (0.110) (23.666) (0.102)
Health problemsb Coefficient 1.119* 33.037 0.392 23.841 0.043
[0-No; 1-Yes] Std. Error (0.303) (21.080) (0.303) (71.002) (0.281)
Number of persons Coefficient 0.067 4.103 0.037 29.273 20.052
in household Std. Error (0.095) (6.208) (0.106) (19.459) (0.101)
(continued)
(P<0.1). Fee awareness and length of hospitalization do not have a significant association with the dependent variables.
The value of medical supplies brought by the patients is signifi- cantly higher for planned surgery which is not related to pregnancy/
childbirth (P<0.05, compared to planned procedures not related to childbirth) and the value of pharmaceuticals is significantly higher for emergency surgery not childbirth related (P<0.05). Moreover, a higher share of in-patients bring medical supplies for virtually all types of hospitalization when compared to planned procedure not related to pregnancy/childbirth except of emergency procedure not related to childbirth. We observe some minor statistically significant socio- demographic characteristics in the goods-related models, e.g. higher share of females report of bringing pharmaceuticals, medical supplies and bed linen, food into the hospital (P<0.05) as well as higher share of in-patients who have health problems (P<0.05).
Discussion
Our results demonstrate that there are significant differences in informal patient payments across countries and types of services, and to a certain extent across the years. However, we cannot draw strong conclusions about time trends since the time period studied is only 2–3 years. The results are sensitive to some biases, as well.
Recall bias, which occurs in consumption and expenditure surveys, has been reduced by using a moderate recall period for the questions on last year’s experiences as well as by indicating the exact service use in the questions on the last visit/hospitalization. The significance level of the regression coefficients (P<0.1 in some cases) should be addressed in further studies with a larger sample size. Also, the infor- mal nature of the studied phenomenon provides a number of chal- lenges, e.g. frank answers of respondents on the sensitive questions as well as their ability to distinguish the informal part in the total payments for health care services. As presented inSupplementary Material, Table S2, these potential challenges were limited by asking a question on informal payments after the general questions on ser- vices use and total payments. Also, respondents were asked to in- clude not only cash payments but also to assess in monetary terms the gifts given. Since an insignificant number of respondents refused to answer the questions on informal payment, we assume that the
sensitivity bias did not distort our results substantially. Moreover, we have mainly focused on the cross-country comparison of the in- formal payments. As cross-country studies serve mainly comparative purposes, the research instrument should be kept as identical as pos- sible (as it was in our study). Thus, it was impossible for us to reflect in the questionnaire all country-specific regulations and other specif- icities related to patient payments. In the view of this, single-country studies will still be necessary to provide an in-depth analysis on pa- tient payment arrangements in a given country.
Despite these potential limitations, our cross-country study pro- vides evidence on the association of informal payments with factors such as patients’ fee awareness, the purpose of the payment and its initiator. The former appears statistically significant in virtually all cases while the latter two factors as well as some socio-demographic features of respondents appear significant on some occasions. In this section, these findings are subsequently discussed.
Country context and the forms and scale of informal payments
All our findings consistently show a lower extent of informal patient payments in Bulgaria and a higher extent in Ukraine when compared to Hungary, which is in accordance with previous studies (Health Consumer Powerhouse 2010,Lewis 2007).
The difference between Hungary and Bulgaria is puzzling at first glance given the traditionally better indicators in Hungary, e.g.
higher health care funding and political stability (Pavlovaet al.
2012). One obvious explanation is the successful introduction and functioning of a formal co-payment system in Bulgaria (Atanasova et al.2011) as opposed to Hungary, where such attempts failed in the hospital and ambulatory care setting by and large a year after its introduction in 2007, formal user charges were abolished (Bajiet al.
2012). Thus, the relatively low share of informal payments in Bulgaria could be explained by the existence of formal out-of- pocket payments, which by decreasing the resources of households, decreases their ability to pay informally. Also, the private health care sector in Bulgaria is growing and provides formal alternatives for patients who are willing to pay for better and quicker services.
Further, the lower extent of informal patient payments reported in Bulgaria can be explained by the fact that in Bulgaria recent anti- Table 4(continued)
Pharmaceuticals Medical supplies Food, linen
User brought such goods [0-No; 1-Yes]
SIZE in Euro
User brought such goods [0-No; 1-Yes]
SIZE in Euro
User brought such goods [0-No; 1-Yes]
Type of regression analysis Binary logistic Linear Binary logistic Linear Binary logistic
Household income [from 0-Less than 50 Coefficient 20.082** 20.470 0.016 27.568 0.072**
Euro to 17-More than 3000 Euro] Std. Error (0.042) (3.009) (0.046) (9.656) (0.043)
Constant Coefficient 23.625* 2103.736 25.875* 266.836 23.208*
Std. Error (1.071) (79.506) (1.195) (277.410) (1.063)
Pseudo R Square/R Square 0.447 0.235 0.377 0.333 0.268
Number of observations 626 225 627 146 630
*P<0.05;
**P0.10.
aAmounts in Euro are used in the analyses. Firstly, in local currency for 2011 and 2009 amounts are converted to 2010 values based on Consumer Price Index per country (source: World Bank), then converted from local currency to Euro based on average conversion rate for 2010 (source: ESB).
bIndicator of a presence of a severe or chronic health problem registered by a physician..
corruption measures required for entering the EU, played an import- ant role in the country and facilitated the creation of negative atti- tudes towards informal patient payments (Atanasovaet al. 2010, Health Consumer Powerhouse 2010). In contrast, in Hungary and Ukraine, the positive and/or indifferent attitudes towards informal patient payments are more extensive (Stepurko et al. 2013).
Additionally, the inadequate public health care provision and the need to further reduce government expenditure on health care may hold back policy attempts in Hungary, as well as Ukraine to elimin- ate informal payments (Baji et al. 2011). This also applies to Bulgaria.
Still, a high share of the requested informal payments by out- patient care providers in Bulgaria is a distinctive finding in our study which can be attributed both to underfunding of the Bulgarian health care sector (Dimovaet al.2012) and to the co-payment mech- anism, which establishes a formal payment channel between the pa- tient and the individual out-patient physician in the public health care sector. This payment channel brings the money issue in the patient-provider relation, and may well ease the request of informal payments (Tamboret al.2013). Moreover, from the patient perspec- tive, imperfect knowledge about official fees is revealed in this study.
Also, in case of hospital services in Bulgaria, where the collection of formal co-payments is done by the hospital administration (not directly by the physician), informal payments are relatively wide- spread. This can be explained to a certain extent by the delayed structural changes in Bulgarian hospital care as well as by the un- clear payment regulations resulting in various quasi-formal hospital fees, which are official but have no base in national legislation (Atanasovaet al.2011). For a successful implementation of the re- forms it is important to assure concordance of out- and in-patient care reforms, as well as an adequate monitoring of the financial flows in the health care sector.
In comparison to Bulgaria and Hungary, the Ukrainian case seems to be a rather despairing one. The Ukrainian government maintains the ‘status quo’ in providing goods to patients free of charge at the point of use, while the quality- and access-related chal- lenges in public health care faced in the 1990s have not been solved (Lekhanet al.2010,Rechel and McKee 2009). Nevertheless, the re- sponsibility for sufficient service funding has been implicitly shifted from the state to the patients. This is evidenced by higher private ex- penditures most of which are informal or quasi-formal (Danyliv et al.2012). The latter, according to the definition ofGaalet al.
(2006), are also informal, if donations to charities are linked to an actual care episode, despite the fact that the money goes through formal payment channels. The inadequate health care funding in Ukraine is also supported by our results on in-kind contributions by patients. The lack of consistent policy goals, an adequate result- oriented management culture, an up-to-date strong institutional base further aggravate the quality and access problems in the Ukrainian public health care provision.
On the other hand, the case of Bulgaria suggests that measures to eliminate informal payments by the introduction of formal user fees, are unlikely to be successful if shortages or chronic underfunding persist as well as if reforms have uneven character. Our findings show that patients continue to pay informally on top of the official user fees. This is especially worrying for those who are not able to pay for health care. Clearly, the inequity effects of formal co- payments are going to be aggravated when these payments are com- bined with informal payment requests on the side of the provider.
Fee-for-service and fee-for-goods payments (in kind contribution)
Although lower than in Hungary, we find that informal patient pay- ments are relatively widespread in Bulgaria as well, especially for hospitalizations and, as we argued before, this has to be interpreted within the context of total out-of-pocket payments. In particular, we have explored payments for goods (e.g. pharmaceuticals, medical supplies) that had to be provided to patients for free, but which pa- tients were requested to bring with them for their hospital treatment.
As suggested by previous research, such requests are explained by the staff by the lack of sufficient funding and consequently the ab- sence of basic supplies for adequate service provision. Patients usu- ally purchase these goods officially but outside the health care settings, e.g. at private pharmacies (Ensor 2004,Fotaki 2009,Gaal et al.2006). Therefore, these payments are not formally registered as treatment costs and these payments are not ‘fee-for-service’, but
‘fee-for-goods’ informal payments. Given these specialities it is im- portant to separate them from informal cash payments in order to understand better the out-of-pocket payment patterns in a country.
As a separate category of informal payments, they are referred to as
‘in-kind contribution’ in the literature (Gaalet al.2006).They can be also seen as quasi-informal payments since they are officially pur- chased but brought to the hospital informally. Thus, they remain un- registered with the hospital system.
While in Hungary and Bulgaria, about 15% of in-patients report such payments, they are much more common in Ukraine. Overall, the practice of patients bringing goods for hospital treatment shows a government failure in health care provision (Cohen 2012, Falkingham et al. 2010). However, when some patients have to bring also their bed linen and food for their hospitalization, it is an indicator of the major drawbacks in hospital care and the need of immediate policy actions (Falkinghamet al.2010).
Still, we cannot deny the possibility that patients are asked to bring goods for their hospital treatment not only due to the actual absence of basic supplies in the hospital, but also due to the health care providers’ misuse of their market power. Since the costs of these goods are already included in the hospital reimbursement or hospital budget, when patients bring the goods for their treatment, the hos- pital ‘saves’ funds and can use the ‘savings’ for other purposes, e.g.
an increase of staff’s income. Such a situation occurs when adequate monitoring and control of the hospital practice is absent.
Services and supply-side factors
As reported in our study and as confirmed by previous empirical evi- dence (Szende and Culyer 2006, Tomini and Maarse 2011, Vian et al.2006), in-patient health care consumption leads to wider share and higher amounts of informal patient payments compared to out- patient care. We find that informal payments in case of surgery and childbirth/pregnancy are higher compared to other in-patient ser- vices, which is comparable to previous findings (Kornai 2000, Shahriariet al.2001). Also, we find lower informal payments for GP services than for out-patient specialists, which are also reported in previous studies (Vianet al.2006).
Our results show that a considerable number of informal payers in our study report ‘better attention’ as the main reason of informal payments as well as the relevance of service quality and ‘better atten- tion’ in the models which explain informal patient payments. In Central and Eastern European countries, the lack of a favourable at- titude of medical staff to patients may be found in physicians’ social status inconsistency (when profession prestige and education does not correspond to salary/income) that results in personal doctors’
discordance, e.g. in aggressiveness and/or negligence of medical staff (Cockcroftet al.2011,Geschwender 1967). We also observe a posi- tive relation between being asked to pay informally and the size of informal payment for a hospitalization. In this regard, it is import- ant to strengthen the norms of appropriate behaviour among health care staff, i.e. clear policies for misconduct, professional training, more involvement of professional committees and possibilities for patients to complain when asked to pay informally (Lewis 2007).
These measures alone, however, are unlikely to be effective, if the issue of selection, promotion and remuneration of physicians is not addressed.
When we examine the size of the informal payment for hospital- ization, obtaining better services also emerges as an important pur- pose of informal payments. Thus, health care provision is organized in a way that the patient is prompted to pay informally to obtain ad- equate care. Specifically, governments have no resources or ability to assure services with adequate quality for all, and lack the political will to acknowledge this explicitly. Introducing formal charges for better quality/access is unpopular and contradicts equity principles.
As a result, access to desirable attributes of health care services de- pends on patients’ ability to pay informally (Cohen 2012, Gaal 2006). All these suggest that informal payments are rather a product of system failure than the culture of gifts. Without addressing the underlying shortage, including but not limited to salaries of medical staff, and addressing the eroded social capital in health care, infor- mal payments are likely to persist (Gaal and McKee 2004).
Knowledge of the size of the official payment for health care services
Patients’ access to information on official fee schedules is highly im- portant for an adequate health care system, and the key in the dis- crimination of formal and informal patient payments (Allinet al.
2006, Ensor and Witter 2001,Fotaki 2009,Gaal and McKee 2005).
As our results suggest, in all three countries, more efforts are needed in increasing patients’ knowledge about the entitlement to care.
Overall, we find that patients are poorly informed about the size of the formal fees. Even in the case of Bulgaria, where formal co- payments for health care services have been broadly applied since 2000, only about half of the patients always know always the exact fee size. Contrary to previous results (Mokhtari and Ashtari 2012), but with the exception of the size of informal payment for the last physician visit, we observe a higher probability of informal pay- ments among well-informed patients. This finding is more plausible, insofar as only well-informed patients are in a position to distinguish formal fees and additional payments made informally. Moreover, better knowledge about official fees can be related to higher aware- ness about health care utilization issues, e.g. how to increase the ac- cessibility and quality of the services demanded. This finding supports the assumption that informal payments are primarily not a product of the lack of knowledge regarding entitlements to health care. Complicated fee schemes and utilization regulations are none- theless problematic (Belliet al.2004), because they put service pro- viders in a better position to take advantage of ill-informed patients and extort informal payments as if formal user fees were due.
Therefore, the service utilization rules should be clear for any pa- tient. Mobilization of nongovernmental organizations and civil soci- eties, which are currently emerging in Central and Eastern European countries, can help in achieving this objective.
In any case, the contradictory findings call for further research with more detailed questions on fee awareness, related to actual epi- sodes of care. From the research point of view, the respondents’
knowledge of official entitlements is indispensible to distinguish be- tween formal and informal payments. Therefore, it is crucial for the accurate estimation of the scale of the phenomenon. From the per- spective of health policy, the provision of information on entitle- ment to health care is an important prerequisite to eliminate informal payments but good knowledge alone is unlikely to bring on the required change in human behaviour. Along with financing and structural changes, other structural factors, e.g. regulations and anti-corruption policies are also important to eliminate informal payments (Tamboret al.2013).
Conclusions
The results of cross-country comparison confirm the existence of widespread informal payments in Bulgaria, Hungary and Ukraine though the scale and patterns vary across countries and services, and to a certain extent over the years. Differences in regulatory mechan- isms, the extent of ‘internal and external competition’, and the level and sources of funding explain the cross-country diversity (Ensor 2004). It is common in all three countries, that informal patient pay- ments (both ‘bribes and fees’) are a symptom of system failure and provide a means for patients to obtain the health care they desire, which the government is not able to guarantee.
Patients’ perception of poor service provision and hence the ap- plication of ‘do-it-yourself’ policies or ‘inxit’ strategies (informal pay- ments, using connections) in an attempt to benefit of better service (Cohen 2012, Gaalet al.2004), may lead to an improvement of one’s situation at the individual level, but distort the achievement of the health policy objectives of the government at the level of the health care system. Policy-makers should consider the purposes of informal payments in the country and select corresponding measures to elim- inate this type of payment. In case patients need better attention of medical personnel, it is important to motivate the staff (via salaries, bonuses, work conditions, trainings). At the same time, because of the lack of regulations (protocols), sanctions, it is mainly physicians (still underpaid and unmotivated) who make the decision on the ser- vice they provide to patients (Thompson and Xavier 2004). Hence, only wise regulations coupled with incentives/disincentives may de- crease the level of informal payments for health care provision.
Supplementary Material
Supplementary dataare available atHEAPOLonline.
Funding
This work was supported by the European Commission under FP7 Theme 8 Socio-economic Sciences and Humanities, Project ASSPRO CEE 2007 [grant agreement number 217431]. The content of the publication is the sole responsibility of the authors and it in no way represents the views of the Commission or its services.
Conflict of interest statement. None declared.
References
Allin S, Davaki K, Mossialos E. 2006. Paying for0free0health care: the conun- drum of informal payments in post-communist Europe. In: Kotalik J, Rodriguez D (eds.). Global Corruption Report 2006 Special Focus:
Corruption and Health. London: International Transparency, 63-71.
Atanasova E, Kostadinova T, Moutafova E, Pavlova M. 2010. Patient pay- ments and the problems in medical service provision in Bulgaria.