Evaluation analysis of particulate relevant emission of a diesel engine running on fossil diesel and different biofuels
Gy€ orgy Szabados
a,*, Akos Bereczky
b, Tibor Ajtai
c, Zolt an Boz oki
caKTI Institute for Transport Sciences Non Profit Ltd., Vehicle and Engine Emission Test Laboratory, H-1119, Budapest, Than Karoly u. 3-5, Hungary
bBudapest University of Technology and Economics, Department of Energy Engineering, H-1111, Budapest, M}uegyetem rkp. 3, Hungary
cMTA-SZTE Research Group on Photoacoustic Spectroscopy, H-6720, Szeged, Dom ter 9, Hungary
a r t i c l e i n f o
Article history:
Received 1 February 2018 Received in revised form 9 July 2018
Accepted 23 July 2018 Available online 30 July 2018
Keywords:
Diesel engine TBK-Biodiesel
Triglycerides of Modified Structure Emission analysis
Particulate relevant emission
a b s t r a c t
Air pollutants derived from diesel engines have more and more dangerous effect on the nature and on the built environment as well. One of the most important emission-component of a diesel engine running on conventional diesel is particulate matter. For measuring particulate matter there are many different widely used measurement methods. Using biofuel in diesel engines also causes emission of particulate matter. The basic aim of our work was to investigate and to evaluate the conventional bio- diesel's and the new type TBK-Biodiesel's effect on the particulate relevant emission of a compression ignition engine. Particulate relevant emission mean in this case the four different measurement methods likefilter smoke number, opacity, particulate mass and particulate number. With a rising blending rate of the - in internal combustion engine useable - bio derived fuels (standardized biodiesel and non- standardized TBK-biodiesel) to fossil diesel the particulate relevant emission of the engine changes significantly. The tendencies in particulate relevant emission with growing blending rate are different among the measurement methods. Because of this situation biofuels cannot be evaluated clearly compared to fossil diesel in point of view of particulate relevant emission.
©2018 Elsevier Ltd. All rights reserved.
1. Introduction
Particulate matter derived from diesel engines running on diesel causes more and more problems in connection with the living being and with the built environment as well. Therefore it has been intensively studying from many aspects nowadays. Because of the
expected increasing in demand of energy consumption in the transport sector in the coming years the transport-origin environ- mental pollution will also go up on a global scale and in the Eu- ropean Union as well [21e23]. Diesel engines are used in a wide range of applications. The number of vehicles propelled with diesel engines are growing continuously [25]. A wide range of alternative fuels is offered in the transport sector, among them, biofuels [13,24]. Biofuels were introduced for a number of reasons: (i) diversification of the energy sources, (ii) reducing the consumption of fossil fuels, and (iii) increasing energy security. Additionally, biofuels have a more favourable exhaust gas emission and green- house gas emission [13,16]. But using biofuel in diesel engines doesn't show a clear advantage referring to the particulate relevant emission of CI engines [1e6]. There are many measurement methods to evaluate the particulate relevant emission of a CI en- gine. Regulations controlling air pollutant emission of vehicles are more and stricter [1]. So bio derived fuels can be an important part of sustainability from energy source, energy security point of view.
Besides they cannot be classified clearly as elements of sustain- ability if particulate emissions of an internal combustion engine are involved.
Abbreviations:CI engine, Compression Ignition engine; TBK, thefirst character of the surnames of the three inventors (Thesz, Boros, Kiraly) of the new biofuel production technology; TOMS, Triglycerides Of Modified Structures (the English name of TBK-Biodiesel); ICE, Internal Combustion Engine; FSN, Filter Smoke Number; PM, Particulate Matter; k value, coefficient of opacity; EN, European Norm; SMPS, Scanning Mobility Particle Sizer; LDMA, Long Differential Mobility Analyser; CPC, Condensation Particle Counter; CVS, Constant Volume Sampling;
PDP, Positive Displacement Pump; CMD, Count Median Diameter; GSD, Geometric Standard Deviation; EGR, Exhaust Gas Recirculation; RME, Rapeseed Methyl Ester;
PME, Palm oil Methyl Ester; SME, Soybean oil Methyl Ester; FAME, Fatty Acid Methyl Ester; FSO, Full Scale Output; BC, Black Carbon; EC, Elemental Carbon; BrC, Brown Carbon; AAE, Absorption Angstr€om Exponent; ESC, European Steady-state Cycle.
*Corresponding author.
E-mail addresses: szabados.giorgio@gmail.com (G. Szabados), bereczky@
energia.bme.hu(A. Bereczky), ajtai@titan.physx.u-szeged.hu(T. Ajtai), zbozoki@
physx.u-szeged.hu(Z. Bozoki).
Contents lists available atScienceDirect
Energy
j o u r n a l h o m e p a g e :w w w . e l s e v i e r . c o m / l o c a t e / e n e r g y
https://doi.org/10.1016/j.energy.2018.07.154 0360-5442/©2018 Elsevier Ltd. All rights reserved.
The number of studies in the literature dealing with measure- ment of particulate relevant emission of engines running on various bio-derived fuels is great.
Based on a research [2] carrying out on a single cylinder, com- mon rail diesel engine running on diesel and biodiesel, the soot concentration is lower with biodiesel in case of changing com- bustion phasing with conventional combustion condition in an operating point. With conventional combustion process the par- ticulate number is higher in case of diesel than that of biodiesel.
According to [3] there is a clear decreasing in FSN using B100 compared to D2. It has been measured on a bus diesel engine with M injection system. The measurement method was the European Steady-state Cycle (ESC), which contains 13 steady state operation points on the engine's torque-speedfield.
In case of [4] biodiesel was Karanja biodiesel. With these fuels and their blends test series were conducted on a four cylinder direct injection compression ignition engine in order to charac- terize the particulate size-number distribution and total particulate number concentration of the engine's exhaust gas at various sta- tionary operating conditions. Based on the result it can be said, that the blending rate of Karanja diesel doesn't have a significant effect on the particulate number concentration of the emitted exhaust gas. In function of engine load the total number values show larger values with blend in the direction of rising engine load. Besides the number concentrations with pure Karanja biodiesel go down at all engine load condition.
As for [5] particulate mass, Filter Smoke Number and particulate size distribution were measured using two different biodiesel fuels (derived from waste cooking oils) and their blends (30 V/V% and 70 V/V%) on a direct injection commercial engine in more operating points. Particulate mass increases, FSN decreases with rising bio blending rate independently from operating point. Changes of particulate size distribution among the operating points are sig- nificant. Lower size properties belong to higher blending rate of bio component. Mean concentration tendency increases in some points and decreases in other points in function of load.
In a research in Ref. [6] particulate size-number distribution of rapeseed methyl ester biodiesel of 30 V/V% blending rate to diesel was investigated and compared to the results of diesel. Operating points were steady-state points. As for the maximal particulate number of the exhaust gas of a turbo charged V6 modern diesel, it is higher for diesel in certain operating points and in the other points it looks inversely. The characteristic diameter belongs to the maximum number is almost the same for both tested fuels.
Summarizing the results of [7] in which Karanja oil derived biodiesel has been tested in a medium-duty naturally aspirated transportation diesel enginefitted with indirect injection, exhaust gas recirculation system. Beside the regulated gaseous emissions, particle sizeenumber distributions, elemental carbon and organic carbon content of particulates were investigated under different engine load conditions (no load, 25%, 50%, 75% and 100% load at speed of the rated torque, which is 2500 rpm) in order to be able to evaluate the impact of biodiesel blend (B20) regarding particulate emission compared to fossil diesel. A partialflow dilution tunnel was used for diluting the exhaust gas. A fraction of exhaust gas was diluted by pre-conditioned and pre-filtered air at 52C with a dilution ratio of 16. As for the results, the total particle numbers in the engine exhaust got larger with rising engine load. Exhaust gas of the engine running on B20 presented almost similar total particle number concentration compared to diesel. CMD increased at higher engine loads. Among the engine operating conditions used for the test of the engine, CMD varied between 39 and 76 nm for diesel and B20.
In the source of [9] there are a great number of comprehensive studies focussing on PM mass, FSN and size distribution of
particulates in the exhaust of biodiesel fuelled engines. There are many sources that reported lower particulate mass emission and there are some studies in which identical or higher mass level have found out with biodiesel. Thefilter smoke number (FSN) has also been recorded in many cases and it was significantly lower for biodiesel in all the studies.
A study cited as [10] examined the number emission charac- teristics of 10e1000 nm non-volatile particles from a heavy-duty diesel engine, operating with various waste cooking oil biodiesel blends (B2,B10,B20), with various engine loads (0%, 25%, 50% and 75%) under steady state point. The measurements were carried out on a 6-cylinder, naturally aspirated, water-cooled, no EGR, direct- injection engine with a piston displacement of 6 l. The engine was approved according to the requirements of the Euro I emission standard. The total particulate number shows a changeable value over the engine load. It means that the total number decreases significantly to 25% engine load and beyond it with increasing load a rise in total number can be observed. The total number of par- ticulates decreases at all load conditions with the increasing in bio levels of the blends (B2,B10,B20). This is the case at all recorded load points.
According to [11], which also summarize the results of different studies aiming to measure the particle size distribution in the en- gine exhaust running on biodiesel and biodiesel blends inconsis- tent trends reveal in particle size distribution when the engine is fuelled with biodiesel or biodiesel-diesel blend. Increase and also decline are published with using biodiesel regarding particulate mass and number. The work presented in Ref. [12] is focused on the measurement and analysis of the smoke opacity resulting from a diesel engine fuelled with conventional fuel and biofuels under transient conditions. Methyl esters of used cooking and unused vegetable oils were tested pure and as blends with blending rates of 30 V/V% and 70 V/V% of a commercial diesel fuel which was also used pure. Summarizing the results it can be stated that with the use of the diesel blends containing esters of vegetable oils a sig- nificant reduction in smoke opacity can be reached not only in steady state points but also in transient engine operation.
Another comprehensive research [14] dealt with three different kinds of biodiesel blended with fossil diesel fuel in 50 V/V%. They were tested in a Cummins 4BTA direct injection diesel engine, with a turbocharger and intercooler. Experiments were carried out using five engine loads of two steady speeds. The aim of this study was to identify the effects of fatty ester composition on the particulate emission of biodiesel from different feedstocks. Beside smoke opacity, the context of particulate size-number distribution and soluble organic friction has also been investigated. Smoke decreased in function of rising bio level of the tested fuel and it risen with increasing engine load but not linearly. Curves of smoke as a function engine load show a different course between the two different engine speeds. The smoke opacity of SME50 (Soybean oil methyl ester) is higher than that of RME50 (Rapeseed oil methyl ester) and PME50 (Palm oil methyl ester). As for the particulate size-number distributions, biodiesels have higher number level under the size of 50 nm and above 50 nm it shows the opposite tendency. Regarding the total number of particulates in the exhaust gas it is higher with bio materials at a given load-speed point. If the load gets higher the total number will be higher.
A related study [15], which is a review, treats many aspects of particulate relevant emission of internal combustion engine. As for particulate size over number distribution, total number declines at a given and constant engine speed with getting higher engine load.
At the same time with bio blend and with pure bio the numbers are higher than those of fossil diesel. For all engine speeds with a constant load, pure biodiesel shows highest particle number con- centration in all cases, whereas with B20 results are changeable. For
all operating conditions (investigated load-speed operating points), peak particle concentrations for B100 and B20 were always in lower side, i.e. high small size particle concentrations.
Reference [17] as a review shows variable results regarding particulate mass of biodiesels compared to fossil ones. On the one hand in two cases mass rising can be observed, and on the other hand in two cases decreasing can be detected from the 4 elaborated comprehensive researches.
Summarizing the results of the elaborated literature above statements can be made as follows: FSN and smoke opacity reduces in all cases using biodiesel in comparison to fossil diesel indepen- dently from the tested engine, test method, blending rate level, operating point of the engine. Moreover it is true during transient cycle as well. In case of particulate mass and size-number distri- bution (total number) the picture is not clear. The effects of bio- diesel on these parameters depend on mainly the tested engine, the engine operating point as well as the test method. Decreasing and also increasing of particulate mass and number with biodiesel compared to conventional diesel can be noticed, in these reviews [9,11,16,17] as well.
Researches cannot be found in the literature where the four most commonly used particulate measurement methods like Filter Smoke Number, opacity, particulate mass, particulate number have been used at the same time to evaluate the particulate relevant emission of an ICE. In parallel with the four different particulate measurement methods two different kinds of biodiesel cannot be foundein the related literatureeto be used with various blending rates to 100 V/V% of bio content.
Sometimes it can be worth it not to research in depth on afield, but to investigate the relationship between the different mea- surement methods as a basic for more complex evaluation. The effect of renewable fuels on operation of an internal combustion engine could be assessed correctly by the help of complex aspect.
1.1. Basic aim of the work
The basic aim of the work was dual. In one hand to carry out test series comparing three fuels and its blends as far as the particulate relevant emission of a CI engine is concerned. Measurement methods would be Filter Smoke Number, opacity, particulate mass, particulate number. Questions are as follows: (i) particulate emis- sion will increase or decrease with increasing bio blending rate?, (ii) can changes in particulate emission be evaluated clearly with the four methods? (iii) can biofuels be a kind of engine of the sustainability if the air pollution especially the particulate emission of an compression ignition engine is about.
On the other hand to evaluate the new type TBK-biodiesel with different physicochemical properties compared to conventional biodiesel regarding its effect on engine operation and on the par- ticulate emission of the used engine.
1.2. Introduction of TBK-biodiesel
The TBK-biodiesel (in the English name TOMS: Triglycerides of Modified Structure) is a new type bio based fuel. The main advantage of TBK is that during its production procedure without by-production of glycerine occurs, that is, the crude vegetable oil is wholly turned into fuel. This means that 15e20% more fuel is produced from the same volume of crude oil. With the retention of the glycerine-frame the internal oxygen content is 30% higher as compared with conventional biodiesel, which results in less harmful components in the exhaust gas than in the diesel exhaust [19,20]. The essential difference in the production procedure of TBK compared to the convetional production process is that the crude vegetable oil is not transesterified with alcohol, but with ester. The
final product is a mixture of modified chain of triglyceride and conventional biodiesel. Because of its producing process the TBK fuel doesn't meet the standard [39], which is for conventional biodiesel e.g. in case of most of the requirements listed in the standard. Theflexible production technology of TBK-Biodiesel al- lows on the one hand that two type of ester (methyl acetate or ethyl acetate) can be used for the esterification method, and on the other hand that in thefinal product the proportion of conventional bio- diesel and modified triglycerides can be changed. For our tests we used TBK based on rapeseed oil, transesterified with methyl ace- tate. It is very important to highlight that the TBK biodiesel is a raw material; it doesn't have any additive, blending component, con- trary to the two other standardized fuels, which contain many additives in order to improve their physical and chemical proper- ties and making them suitable for using in internal combustion engines. Based on the description above conventional biodiesel has disadvantages compared to TBK-Biodiesel as follows:
not each and every atom of biomass's triglyceride is utilized for fuel purposes
this is not an universal process for all kinds of oils/animal fats, higher manufacturing costs,
not an eco-friendly process (glycerol), use of methanol, derived from fossil sources
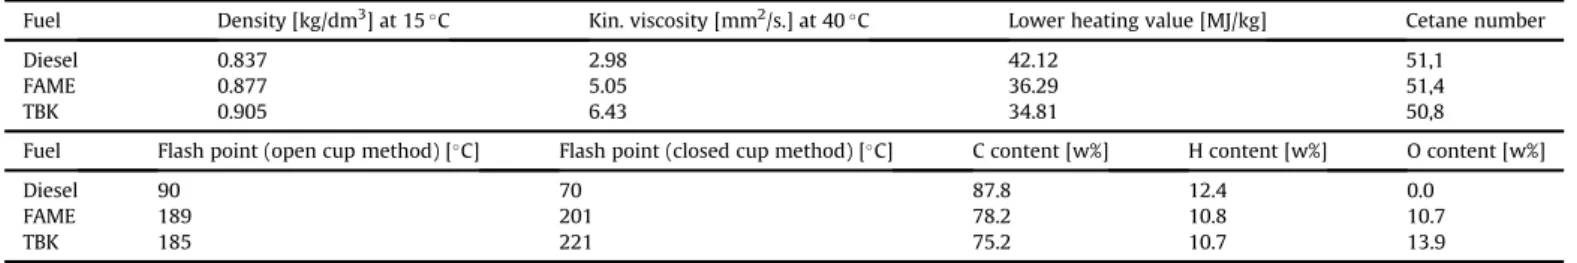
ICE relevant physicochemical properties of TBK-Biodiesel like density, kinematic viscosity, lower heating value, flash point are worse than those of conventional biodiesel [26]. From this point of view worse particulate relevant emission of TBK-biodiesel can probably be expected. The most important physicochemical prop- erties of the tested fuels can be seen inTable 1.
2. Experimental and methods
2.1. Tested fuels 2.1.1. Pure fuels
For our comparison tests diesel fuel (D2) - corresponding to the standard [31] - purchased from a gas station in Hungary was used as a reference fuel. The second fuel was Fatty-Acid-Methyl-Ester (rapeseed biodiesel) meeting the standard [39]. The TBK-Biodiesel - the third tested fuel e also called Triglycerides of Modified Structure (TOMS) is a new type biofuel.
2.1.2. Controlled blends
Beside the pure fuels four different blends have been made in a controlled way. So the seven different fuel compositions were tested according to the following: pure fossil diesel, blend of both bio fuels with blending ratio of 25 V/V% and 75 V/V%, pure FAME and pure TBK. It is important to mention that reference fuel, which is diesel, may consist of 7% of FAME. So blends have been created that this conjecture was taken into consideration. This also means that there is a small amount of conventional biodiesel in the TBK- Biodiesel and its diesel blends.
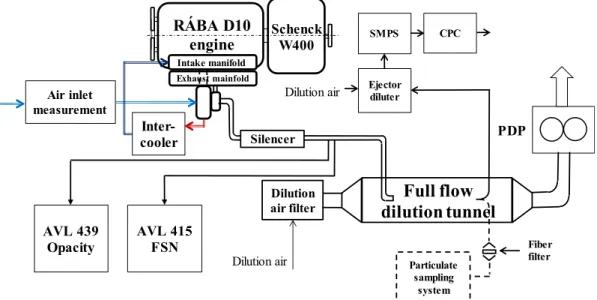
2.2. Experimental set-up and test procedure
To determine the FSN of the raw exhaust gas of the engine an AVL 415 type smoke meter was used. The exhaust sample was sucked through a paperfilter, and the Filter Smoke Number was identified based on the changing in reflectivity caused by black- ening effect of thefiltered particulate matter [44]. Samples were taken from the raw exhaust gas for this method.
Opacity meter of AVL 439 was used to measure the transparency of the row exhaust gas emitted by the engine. The opacity meter
measures the fraction of light transmitted through a given exhaust volume. Extinction based measurements quantify particle con- centrations via the BeereLamberteBouguer law, where the ratio of transmitted to incident light intensity is an exponential function of the path length and the extinction coefficient. Opacity depends on particle size and light wave length, as well as particle shape and composition [43]. Samples were taken from the raw exhaust gas for this method as well.
Particulate mass is determined by collecting particles onto a filter with partialflow sampling method after dilution in a fullflow dilution tunnel. The emission rate is then calculated by weighing thefilter before and after the test and specified on power of the engine running in the actual operating point. Thefilter is afiberfilm filter with 70 mm size. Samples were taken from the diluted exhaust gas after a fullflow CVS dilution for this method. Whole procedure detailed can be found in Ref. [18].
The number concentration and size distribution of the emitted particles were measured by a Scanning Mobility Particle Sizer (SMPS). Thefirst part of SMPS is a Classifier“Vienna”Type Long Differential Mobility Analyser. The sampled particle assembly is led into LDMA in which the particles are separated based on their electrical mobility. Then the size classified particles are sent to the Condensation Particle Counter (CPC) where the size segregated particulates are counted. The sheath and aerosolflow rates were set to 3.0 and 0.3 L per minute, thus the SMPS measured the size dis- tribution over the range of 11.1e1083.3 nm with resolution of
±0.5 nm at 11.1 nm to±30 nm at 1083.3 nm. Samples were taken from the diluted exhaust gas after a fullflow CVS dilution for this method as well [42].
Dilution, condition: The CI engine exhaust was directed into the fullflow constant volume sampling (CVS) system designed for the characterisation of particulate emission of disassembled engines according to [18], where the detailed description of the fullflow CVS technique can be found too. In short, the end of the engine exhaust pipe was connected to the entry port of the fullflow CVS system. Following that the inner port having a diameter of 120 mm led the exhaust into the centre of the dilution tunnel. The inner diameter of the tunnel was 600 mm. The sampling of the primary diluted raw exhaust was carried out from the centre of the tunnel at a distance of 6000 mm from outlet point of the inner port. The dilution of the raw exhaust was executed byfiltered air through the dilution inlet port. In the next step the concentration of the pri- marily diluted exhaust was further reduced by a factor of 10 by an ejector diluter. There were two measurement modes applied in the tests. During measurements aiming to characterize diesel emission in the function of engine working conditions and fuel types, the heating unit of the thermo-denuder was set to 50C. Experimental set up is shown inFig. 1. For the test series used equipment and their parameters are listed inTable 2.
The test series was carried out in engine type RABA D10 UTSLL 160, which is one of the most commonly used engine in the Hun- garian busfleet. Because of this it is very important to know, how
the particulate properties are changing with the different fuels, because it has a high influence on the imission situation in larger towns in Hungary. Modifications on the engine haven't been per- formed during the test series. The engine operated with the basic settings of the engine for fossil diesel. The main parameters of the engine are shown inTable 3. During the measurement series in case of all kinds of tested fuel the settings of the engine remained unchanged.
The three test points were chosen in relation to combustion process and the emission of particulate matter. In these three test points the combustion process and the properties of the particulate matter emitted by the engine may be very different. (Measuring more than three points did not seem justified and it was avoided in order to prevent damages caused to the engine or the measurement system during the 30e50 min' test, which requires a high quantity of fuel). At low speed the charger works with low charging pressure and the in-cylinder swirl is also lower which results in poorer mixture formation, besides a less air-fuel ratio at mean load occurs.
This can be a characteristic point in the emission of particulate matter in„mean”quantity. Lower quantity of particulate emission may be obtained at rated speed, and less load, where a greater mixing velocity and better air-fuel ratio results in better mixture formation. As regards the previous conclusions at rated speed and larger load one can expect a larger scale of particulate emission.
Three points have been chosen for the tests from the speed-load range of the engine as follows:
1. 1300 rpm - 50% load 2. 1900 rpm - 25% load 3. 1900 rpm - 75% load,
where 50% load means 450 Nm, 25% load means 200 Nm and 75%
load means 600 Nm torque.
These torque levels have been set for all kinds of the tested fuels.
These control points are a part of the formal emission type approval test method and they have been taken from Ref. [18]. Settings of the engine remained unchanged during the measurement series and there was no reconstruction on the engine.
3. Results and discussion
3.1. Physicochemical properties of the tested fuels
Table 1 summarizes the most important physicochemical properties of the tested fuels. Measurements have been carried out according to the related standards. Results have been determined for blends as well, but they are not shown here because of the limited volume of the article. The bio-derived fuels have higher density, kinematic viscosity which may have an effect on com- bustion process and pollutant formation. The lower heating value of the biodiesels appears because of oxygen content of them and may result in larger quantity of dose compared to diesel to reach the Table 1
Physicochemical properties of the tested fuels [26].
Fuel Density [kg/dm3] at 15C Kin. viscosity [mm2/s.] at 40C Lower heating value [MJ/kg] Cetane number
Diesel 0.837 2.98 42.12 51,1
FAME 0.877 5.05 36.29 51,4
TBK 0.905 6.43 34.81 50,8
Fuel Flash point (open cup method) [C] Flash point (closed cup method) [C] C content [w%] H content [w%] O content [w%]
Diesel 90 70 87.8 12.4 0.0
FAME 189 201 78.2 10.8 10.7
TBK 185 221 75.2 10.7 13.9
same torque level. With increasing blending rate of biodieselflash points are higher than those of fossil diesel. It means worse evap- oration properties, which can have an effect on the ignition delay.
Based on the cetane number of fuels it could be expected, that the ignition delay won't be changed when biofuel will be used compared to fossil diesel. Physicochemical results of fuels shown above run in parallel with results can be found in related literature sources [48,49].
3.2. Indicator diagrams
In case of indicator diagrams pure fuels and their blends have been investigated in order to analyse the effect of bio fuels on the parameters of combustion technology.Fig. 2presents the indicator diagrams at all torque-speed parameters used in frame of the test series. Thefirst operating point is at low speed and at mean load, where the speed is 1300 rpm and the load is 50%. The differences caused by the fuels are easy to observe in this engine running point.
The injection start is the same at every fuel: exactly 1 CA BTDC based on rail signal of the fuel distributor. The biodiesel dose increased by 13.3%, the TBK dose by 8.1%, which is a little (biodiesel) or, much (TBK) lower than the scale of decrease of the heating value (14% and 17%, respectively). Based on the assessment of 100 indi- cator diagrams the peak pressures are established as follows: for biodiesel 60.5 bar, for TBK 59.1 bar and for diesel 56.6 bar. InFig. 2it can also be noted, that the combustion is more intensive in thefirst section of the combustion in case of renewable fuels. Indicator di- agrams at 1900 rpm and 25% load are presented in the second row of the diagrams' array. As 1900 rpm is the rated speed therefore this point means a high speed and a low load. In this engine running point there are less differences between the fuels. The injection start is the same at every fuel exactly 10 CA BTDC based on rail signal of the fuel distributor. Biodiesel dose increased by 13.6%, TBK dose by 18.5%, which is in case of biodiesel a little lower, in case of Dilution air
Dilution air
Exhaust mainfold
AVL 415 FSN AVL 439
Opacity
Dilution air filter Air inlet
measurement
Inter-
cooler PDP
Schenck W400
Silencer Intake manifold
Full flow dilution tunnel RÁBA D10
engine
Ejector diluter
SMPS CPC
Particulate sampling
system
Fiber filter
Fig. 1.Experimental set-up.
Table 2
Used equipment, devices and their properties.
Equipment Description Accuracy Measurement range
1 Test bench Schenck W400 ±1 Nm;±1 min1 0-1500 Nm
2 Intake airflow measurement system Rosemount Annubar ANR-73 II. tube 0,5÷þ0,2%/FSO 100e550 m3/h
3 Exhaust dilution system RME 100 KTI 2,5%/FSO
4 Particulate sampling system MKS PR4000 0,23 Standard liter/min
5 Filter paper PALL Fiberfilmfilter, type of T60A20
6 Smoke meter AVL 415 0,1 mg/m3
0,3 mg/m3
0e60 mg/m3
>60 mg/m3
7 Opacity meter AVL 439 1.5%/FSO 0÷10 m1
8 Ejector diluter Palas GmbH VKL 10 18 - 45 l/min clean air
2 - 5 l/min intakeflow 9 Scanning Mobility Particle Sizer GRIMM Aerosol Technique
10 Long Differential Mobility Analyser Model#5.500 <2% for 100 nm 0,8÷1094 nm
11 Condensation Particle Counter Model#5.400 ±10%, for<3 particles/cm3 107#/cm3
Table 3
The main parameters of the tested engine.
Bore 120,5 mm
stroke 150 mm
number of cylinders 6
engine layout inline
compression ration 15,2
displacement 10350 cm3
injection direct injection
exhaust gas recirculation no
exhaust gas after treatment system no
boost Schwitzer S3
intake air intercooler yes
emission approval EURO II
rated power 160 kW/1900 rpm
rated torque 920 Nm/1300 rpm
TBK higher than scale of falling in heating value. Based on the assessment of 100 indicator diagrams it can be noted that the peak pressure at biodiesel is 51.8 bar, at TBK 51.6 bar, and at diesel 51.1 bar, which deviation is not competent. The third row's dia- grams of the array show the indicator diagrams at 1900 rpm rotating speed and 75% load. At this speed and load the differences between fuels are insignificant. Injection start is the same for all the fuels, based on the rail signal is 7 CA BTDC. Rise in dose is 13.9% in the case of biodiesel, and 19.4% in the case of TBK. It is a little lower by biodiesel, by TBK higher than the scale of dropping in heating value. Based on the assessment of 100 indicator diagrams it can be found out that the peak pressure is 65.8 bar in biodiesel, the highest: 66.4 bar in TBK, and 64.6 bar in diesel [8].
Rise in maximum pressure and pressure rising rate in case of renewable fuels may be due to the increased quantity of dose, which was adjusted to reach the same torque and may not be an effect of oxygen content of bio-derived materials. Oxygen might have an effect on emission formation. In-cylinder pressure mea- surements aiming to investigate the combustion process of a CI internal combustion engine have also been intensively studied. The results of some study [27e30] show not too much difference be- tween commercial diesel and biodiesels as it can be seen in our case too.
3.3. Heat release rates
Heat release rates have also been determined for pure fuels and for various blends at the three test points. Heat release rate is calculated from the in-cylinder pressure curves with the help of the first law of thermodynamics for which an own computational program was developed. Results are plotted inFig. 3. At 1900 rpm
and 75% load the two phases of diesel combustion can be clearly identified, which are the premixed phaseefirst peak of HRR curve e and the diffusion phase (secondeprotracted e peak of HRR curve). Regarding the maximum values, they rise with bio fuels compared to the fossil one, while the points of the maximum values are more or less the same. For this reason the rate gradients for bio fuels is higher than those of the petroleum diesel. It can also be seen that there are differences in the maximum values between the two biofuels and the direction of difference changes with operating points. The highest difference occurs at high speed and lower load.
In this point the maximum value of diesel and of TBK is by 7.6% and 4.3% lower compared to biodiesel's value. Probably the higher dose of bio fuels contributes to the higher value. In case of TBK compared to FAME, the poorer atomization caused by higher viscosity may have an effect resulting the lower value. In thefirst operating point the differences are 4.8% and 0.3%, if values of fossil diesel and TBK- diesel are compared to biodiesel. In the third pointehigh speed, high load - it is more or less the same of the two tested bio fuel, and the difference to fossil is quite low as well. It has to be mentioned that TBK has higher HRR maximum values compared to conven- tional biodiesel in this test point. It can be said that as for the point of maximum value there is not notable difference among tested fuels at any operating point [8]. Similar to the indicator's results the maximum value of HRR and the rising rate in case of renewable fuels may be due to the increased quantity of dose, which was adjusted to reach the same torque and may not be an effect of oxygen content of bio-derived materials. Poorer atomization of bio materials because of its higher density, kinematic viscosity, worse evaporation properties, lower heating values don't seem to be a notable effect on pressure indicator and heat release rate because may be the risen quantity of dose is the dominant in this process.
Fig. 2.Indicator diagrams [8].Numbering of diagrams:
1.a. 1300 rpm - 50% loade25% blends 1.b. 1300 rpm - 50% loade75% blends 1.c. 1300 rpm - 50% loadepure fuels 2.a. 1900 rpm - 25% load - 25% blends 2.b. 1900 rpm - 25% loade75% blends 2.c. 1900 rpm - 25% loadepure fuels 3.a. 1900 rpm - 75% load - 25% blends 3.b. 1900 rpm - 75% loade75% blends 3.c. 1900 rpm - 75% loadepure fuels
3.4. FSN and opacity
The results of FSN, opacity can be seen inFig. 4. Independently from engine operating point FSN and opacity show a falling ten- dency above the blending rate for both bio fuels. FSN values change an order of magnitude between the pure fossil and pure bio fuels. In thefirst engine operating point (1300 rpm/50% load) FSN drops from 11 to 4, at high engine speed and low load (1900 rpm/25%
load) it drops from 12 to 4, and in the last point (1900 rpm/75%
load) thefilter smoke number could be decreased from 21 to 5 in case of FAME and to 4 in case of TBK-Biodiesel. In the last case the smoke value of TBK is lower than that of FAME's, but the difference is more or less equal with the accuracy of the analyser. As for smoke opacity, infirst engine operating point k value declines with 44% for both bio fuel, in the second measured point with 50% for FAME and for TBK as well, and with 77% for FAME and with 81% for TBK- Biodiesel in the third operating point of the engine. A pretty high change can be declared for bio materials in case of thefirst two particulate relevant parameter (filter smoke number and smoke opacity), compared to diesel.
Tendencies of results of FSN and opacity parameters represented above are similar to the results in the literature (see Introduction part). In our opinion this situation may be rather due to difference in the construction structure of tested fuels than an effect of combustion process or the oxygen content of renewable fuels. The reason would be that these measurement principles are focussing on determination of soot content of the exhaust gas [43,44]. The soot is basically made of aromatics [45e47], which is contained by the conventional fossil diesel [31], but aromatics are not a part of biodiesels (FAME and TBK), because they are built up from
triglycerides.
3.5. Particulate mass
In the elaborated literature (see Introduction) particulate mass emitted by engine fed with renewable fuel is changeable compared to particulate mass derived from engine running on fossil diesel.
Therefore in our case the particulate emission of the engine measured by gravimetric principle is being investigated now from two technical parameters point of view against the bio blending rate. These parameters are the unit of engine work and dose quantity.
3.5.1. Particulate mass as a function of unit of engine work Results of particulate mass related to the unit of engine's work show an increasing tendency over bio blending rate, which can be seen inFig. 5. This direction of changing exists in every engine operating point and for both bio fuels. In case of TBK-Biodiesel which has worse physicochemical properties particulate masses are higher compared to conventional biodiesel. Specific particulate mass emission has been elaborated in a unit, which is a quotient of particulate mass and the engine work of unit (g/kWh). As for the exact values they can be found to be as follows: 1. point: 1,66 g/kWh for diesel, 1,84 g/kWh for 100% FAME, 2,06 g/kWh for 100% TBK; 2.
point: 3,39 g/kWh for diesel, 5,72 g/kWh for 100% FAME, 6,48 g/
kWh for 100% TBK; 3. point: 0,98 g/kWh for diesel, 1,45 g/kWh for 100% FAME, 1,87 g/kWh for 100% TBK. The increasing tendency in particulate mass of bio blends and pure biofuel may be due to the risen of quantity of injected fuel which is needed to be reached the same torque level for all tested fuel. Differences can be observed Fig. 3.Heat release rate diagrams [8].Numbering of diagrams:
1.a. 1300 rpm - 50% loade25% blends 1.b. 1300 rpm - 50% loade75% blends 1.c. 1300 rpm - 50% loadepure fuels 2.a. 1900 rpm - 25% load - 25% blends 2.b. 1900 rpm - 25% loade75% blends 2.c. 1900 rpm - 25% loadepure fuels 3.a. 1900 rpm - 75% load - 25% blends 3.b. 1900 rpm - 75% loade75% blends 3.c. 1900 rpm - 75% loadepure fuels
between the two biodiesel. The TBK-Biodiesel has lower heating value which caused greater amount of dose, which can result in higher level of particulate mass emission.
3.5.2. Particulate mass over the injected dose quantity
To investigate how much particlee measured as mass e is produced from unit of injected fuel a relationship was formed.
Results are presented inFig. 6for pure tested fuels. Results can be Fig. 4.Tendencies of FSN and opacity results in function of blending rate.Numbering of diagrams:
1.a. FSN - 1300 rpm - 50% load 1.b. FSN - 1900 rpm - 25% load 1.c. FSN - 1900 rpm - 75% load
2.a. k - 1300 rpm - 50% load 2.b. k - 1900 rpm - 25% load 2.c. k - 1900 rpm - 75% load
Fig. 5.Tendencies of engine's work specific particulate mass in function of blending rate.Numbering of diagrams:
a. PM [g/kWh] - 1300 rpm - 50% load b. PM [g/kWh] - 1900 rpm - 25% load c. PM [g/kWh] - 1900 rpm - 75% load
Fig. 6.Particulate mass related to unit of injected fuel.
seen for the three operating point of the engine. At all the operating points the same tendency can be read, which is exactly, that a unit of injected fuel results in higher level of particulate mass for bio- diesels. There are differences also between the two tested bio- derived fuels. TBK-biodiesel's results show the highest particulate mass. This situation can probably be traced back on the physico- chemical properties of fuels. TBK has the highest valueebetween the three tested fueleregarding density, kinematic viscosity, worst evaporation properties, which has a significant impact on dose related particulate mass.
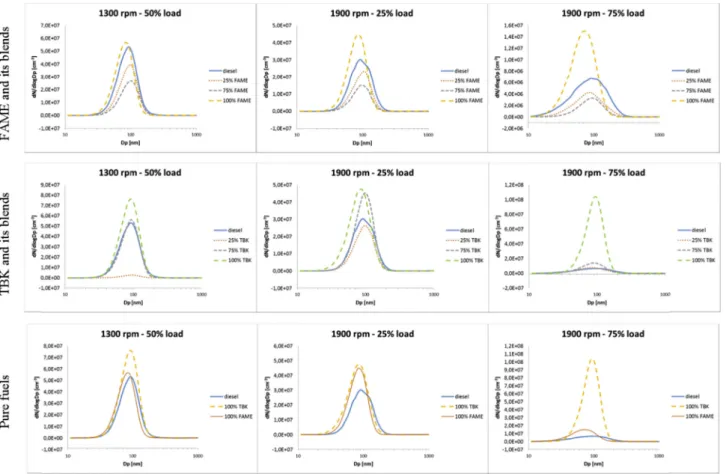
3.6. Effect of blending rate of bio fuels on characteristic parameters of size distribution
In this part of the study the size-number distribution of par- ticulates are analysed. Size number distribution has been recorded for all of engine operating points, for all of the fuel compositions defined in 2.1. section of this study. All relevant massflow, primary dilution and sampled volume values are listen inTable 4.
The calculated characteristic parameters of all the measured size-number distributions are shown inTable 5. The agglomerated particulate assembly has lognormal size distribution in the accu- mulation mode in all investigated cases, so regardless of the engine operating point and the tested fuel. Count median diameter seems to be relatively insensitive to the engine operational condition and the type of fuel. The geometric standard deviation shows higher values in engine operational condition no. 3. It is the case for both type of bio fuels and their blends. Difference can be observed be- tween the two bio materials as well. GSD values of TBK biodiesel and its blends are higher than those of conventional biodiesel's. All recorded size distribution diagrams are shown inFigs. 7 and 8. On the diagrams inFig. 7the effect of engine operating point on size distribution can be seen. InFig. 72 pieces of a 22 array of dia- grams are presented. First one is about the results of FAME, while the second is about the results with TBK-Biodiesel. On the basis of Fig. 8the effect of fuel on size distribution can be observed at every engine operating point. Thefirst row of the diagrams shows the results with FAME in its blends, while the second row the results with TBK and its blends. The distributions with pure fuels are plotted in the third row of diagrams.
The blending ratio of the fuels doesn't linearly affect the total number emission. As for conventional biodiesel, it has a minimum at 75% FAME content for all measured engine operating points. In case of TBK, aside from two points (1300 rpm-50% load, 25% TBK and 1900 rpm-75% load 100% TBK), which may be observed as measurement failure,figure shows clear tendencies, which have a minimum point at 25% TBK(Fig. 9). This behaviour of particulate total number over the bio blending rate can be explained probably with two reasons, which are the following: (i) First one would be
that the in biofuels bound oxygen causes a number-reducing effect for a certain blending rate (ii) while the worse physicochemical properties of biofuels take over the role at higher rates of blending and cause an increasing of number. The currently obtainable sources focus mainly on the inter comparison of diesel fuel with limited bio content. Detailed analysis of biodiesel blends with high mixing ratio is just in some sources [32,33]. On the basis of these results lower total number concentration is foreseen with pure biodiesel compared to pure fossil diesel if linear relation is taken into account between fuel blend and total number concentration.
Almost the same behaviour has been recorded in a related research but it has been conducted with different type of biofuel [34]. Earlier studies can be found, which have experimentally reinforced that the emission characteristics of different diesel engines can vary even if the same operational condition and fuel are applied Table 4
Massflow rates of the engine exhaust, primary dilution,filtered volume for particulate mass (Results partially from Ref. [40]).
Fuel 1300 rpm - 50% load 1900 rpm - 25% load 1900e75% load
Massflow of exhaust gas [kg/h]
Massflow of deluted exhaust gas [kg/h]
Dilution factor
Volume of sample through thefilter [Nliter]
Massflow of exhaust gas [kg/h]
Massflow of deluted exhaust gas [kg/h]
Dilution factor
Volume of sample through thefilter [Nliter]
Massflow of exhaust gas [kg/h]
Massflow of deluted exhaust gas [kg/h]
Dilution factor
Volume of sample through thefilter [Nliter]
Fossil diesel 470.3 5210.9 10.1 639 668.2 6165.5 8.2 630 946.4 7690.9 7.1 615
25% FAME 467.8 5208.7 10.1 630 674.3 6125.9 8.1 620 949.0 7686.9 7.1 603
75% FAME 469.3 5231.5 10.1 609 655.8 6129.7 8.3 608 936.9 7599.3 7.1 588
100% FAME 473.4 5216.3 10.0 606 665.4 6140.2 8.2 603 934.9 7682.3 7.2 597
Fossil diesel 470.3 5210.9 10.1 639 668.2 6165.5 8.2 630 946.4 7690.9 7.1 615
25% TBK 454.4 5214.0 10.5 629 677.3 6130.5 8.1 621 935.6 7688.4 7.2 605
75% TBK 470.6 5225.4 10.1 610 656.9 6152.6 8.4 609 937.7 7725.0 7.2 595
100% TBK 468.2 5225.4 10.2 608 665.4 6121.3 8.2 605 934.9 7652.6 7.2 597
Table 5
Calculated characteristic parameters of size distribution for both bio fuels (Results partially from Ref. [40]).
Fuel CMD [nm] Total number
concentration (*108)
Geometric standard deviation [nm]
1300 rpm - 50% load
Fossil diesel 95.3 4.51 70.8
25% FAME 98.9 3.09 69.3
75% FAME 103.1 2.17 73.1
100% FAME 85.8 4.68 61.7
1900 rpm - 25% load
Fossil diesel 103.5 2.81 86.8
25% FAME 104.0 1.84 72.6
75% FAME 102.1 1.21 70.7
100% FAME 88.6 3.64 62.9
1900 rpm - 75% load
Fossil diesel 114.5 1.04 135.7
25% FAME 97.1 0.53 100.4
75% FAME 101.2 0.34 89.6
100% FAME 78.6 1.72 74.2
1300 rpm - 50% load
Fossil diesel 95.3 4.51 70.8
25% TBK 98.8 0.22 67.3
75% TBK 96.3 4.37 66.6
100% TBK 95.1 6.16 68.1
1900 rpm - 25% load
Fossil diesel 103.5 2.81 86.8
25% TBK 102.8 2.16 74.7
75% TBK 102.6 3.48 69.8
100% TBK 89.6 4.32 69.7
1900 rpm - 75% load
Fossil diesel 114.5 1.04 135.7
25% TBK 93.2 0.94 95.2
75% TBK 95.1 1.45 81.5
100% TBK 97.3 7.78 63.8
[35e38]. It is not difficult to have, because the characteristic of a diesel engine's emission is influenced highly by many things. These things can be fuel injection system, shape of combustion chamber, there is or no exhaust gas recirculation system, there is or no charger, there is or no exhaust gas after treatment system, how much is the engine rated power, torque, which is the rated speed and so on. It was not an aim of the measurement but it is worth it to mention that this engine which has been approved for 25 years emits particulate in the scale (10e100 nm) which is in the scope of the current emission type approval regulation of heavy duty vehi- cle's engine regarding particulate number [41].
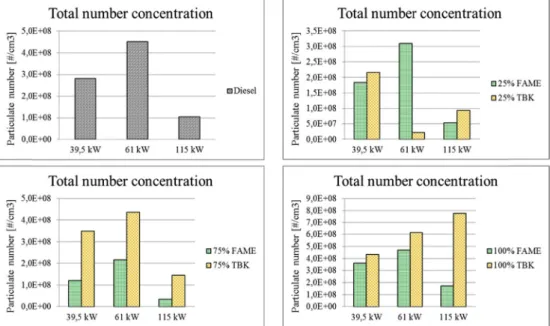
3.7. Total number concentration as a function of engine power and torque
The total number concentration emitted by the tested engine is changeable over the power of the engine and at a given speed (1900 rpm) it decreases with increasing engine torque as it can be seen inFigs. 10 and 11. Globally it can be said that there is no clear correlation between the total number and the power of the engine.
39,5 kW is the engine power in the second operating point at high speed and low load (1900 rpm/25% load). Total number belongs to this power is between the total number values of the two other Fig. 7.Effect of engine operating point on size distribution in case of all tested fuels (Results partialy from Ref. [40]).
operating points, concretely 3,03*107 #/cm3 for diesel, 4,49*107
#/cm3for 100% FAME and 4,32*108#/cm3for 100% TBK. In thefirst operating point of the engine which means low speed and medium load (1300 rpm/50% load) with 61 kW engine power the maximum particulate number can be found to be the highest with values 5,34*107#/cm3for diesel and 5,68*107#/cm3for pure FAME and 6,16*108 #/cm3 for 100% TBK. The peak power among the used operating points is 119 kW appears in the third operating point with high speed and load (1900 rpm/75% load). The total particu- late number is the lowest in this point, which means 6,76*106
#/cm3in case of fossil diesel and 1,49*107 #/cm3in case of pure FAME and 7,78*108 #/cm3 for pure TBK. The fact has to be mentioned, which has already mentioned above that because of the two points, exactly: 1.1300 rpm/50% load, 25% TBK and 2.1900 rpm/
75% load 100% TBK, which may be observed as measurement fail- ure, the recorded tendencies are not clear in case of TBK Biodiesel,
although the other numbers of TBK follows the trends of fossil diesel and conventional biodiesel. At 75% blending rate of bio fuels the tendencies are completely clear. The total particulate number shows a clear property of engine load which exactly means that the number decreases with increasing load. It is valid for every bio blends, aside from one point, which is 1900 rpm/75% load with 100% TBK. The effect of engine speed on the total number cannot be exactly evaluated on the bases of our currently results because there are no two same engine torques with different speed. Con- clusions of this section are as follows: emitted total number of particles is probably determined by the load of the engine throughout the engine's thermal state. The tendency seems to be clear namely with high load (high torque) where the engine's temperature is high the emission is low due to the better com- bustion condition. The total number of particles is the lowest at the highest load of the engine and vica versa with lowest load of the Fig. 8.Effect of fuel on size distribution at all engine operating points (Results partially from Ref. [40]).
Fig. 9.Total number concentration of two types of bio fuels (Results partially from Ref. [40]).
engine while the middle value of total particulate number in exhaust occurs with middle load. The represented trend is in line with described in Ref. [15], while other sources [4,7,10] observed other trends.
4. Comparison of tendencies the four measurement method in function of blending rate of bio fuels
Latest part of this work is about the tendencies of particulate relevant emission as a function of blending rate of biofuel. The four different measurement methods show three different tendencies.
Tendencies are valid for both tested bio fuels from which one is the standardized, conventional biodiesel, the other is a new type bio fuel which doesn't meet the requirements of the related standard [39]. FSN decreases continuously with growing bio blending rate.
Differences in smoke opacity values between fossil diesel and pure bio fuels are negative. Thesefirst two parameters have almost the same tendency. Although particulate mass is continuously larger, but rising is in a very small scale with higher bio rate in diesel. TBK- Biodiesel with worse physicochemical properties has larger par- ticulate mass values than those of the conventional biodiesel's. In case of the FAME biodiesel the particulate number drops to mini- mum at 75% bio blending rate and with pure FAME the number is the highest compared to diesel and 25 V/V%, 75 V/V% FAME blending rate. Total particulate number is the lowest at 25 V/V%
blending rate of TBK and the total number results show a growing tendency with increasing blending rate from 25 V/V% to 100 V/V%
TBK. The total particulate number of pure bio fuel is higher than that of fossil diesel in all investigated engine operating points.
Related diagrams can be found inFig. 12. Clarifications have already Fig. 10.Total number concentration versus engine power.
Fig. 11.Effect of engine torque on total number concentration.
been made in sections above as far as all the four used particulate relevant measurement methods are concerned. Differences are understandable. As for the optical base measurement methods the trend of values as a function of bio blending rate can be traced back to the construction structure of fuels. Continuous increase in par- ticulate mass in line with rise bio rate in the blend is likely because of the worse physicochemical properties of bio materials, worse mixing formation and less effective combustion and increased dose, which may partially be improved by bound oxygen content.
The changeable behaviour of particulate's total number over the bio blending rate can be explained probably with two main effect, which are the following: (i) First one would be that the oxygen content of bio-derived fuels have a combustion enhancing effect and causes a lower number until a certain blending rate (ii) while the worse physicochemical properties of biofuels take over the role at higher rates of blending and cause an increasing of number.
Particulates with“mass”effect causing the increase measured with gravimetric method may not be in the size range where the number has been determined.
5. Conclusion
The basic aim of our work was to investigate and to evaluate the
conventional biodiesel's (FAME) and the new type TBK-Biodiesel's effect on the particulate relevant emission of a compression igni- tion engine in comparison with the fossil diesel. Therefore pure bio fuel and their controlled blends (25 V/V% and 75 V/V%) have been investigated. Filter Smoke Number, smoke opacity, particulate mass, particulate size distribution measurements have been con- ducted, while engine operated in three different speed-load steady state points which were 1300 rpm/50 load, 1900 rpm/25% load and 1900 rpm/75% load. Based on the results, the most important findings can be established as follows:
1. With an increasing blending rate of the - in internal combustion engine useable - bio derived tested fuels (standardized biodiesel and non-standardized TBK-biodiesel) to fossil diesel the FSN and smoke opacity parameters decrease. As for the difference be- tween the two bio materials, they are slight. There are also differences in the degree of change between the two optical processes, but the trend is the same. The highest decrease in FSN is from 21 (fossil diesel) to 5 (pure bio), which occurs the operation point of high speed and high load. As for smoke opacity, in the third engine operating point k value declines with 77% for FAME and with 81% for TBK-Biodiesel in comparison to that of the diesel. The trend of values as a function of bio Fig. 12.Tendencies of four measurement methods in function of blending rate of FAME-biodiesel and TBK-Biodiesel.Numbering of diagrams:
1.a. FAME and its blending - 1300 rpm - 50% load 1.b. TBK and its blending - 1300 rpm - 50% load
2.a. FAME and its blending - 1900 rpm - 25% load 2.b. TBK and its blending - 1900 rpm - 25% load
3.a. FAME and its blending - 1900 rpm - 75% load 3.b. TBK and its blending - 1900 rpm - 75% load
blending rate may be traced back to the construction structure of fuels.
2. With a rising blending rate of the - in internal combustion en- gine useable - bio derived tested fuels (standardized biodiesel and non-standardized TBK-biodiesel) to fossil diesel the par- ticulate mass shows increasing tendency. The difference be- tween the particulate mass values is slight, but the change is a one direction tendency. Particulate mass values are higher for TBK than those of FAME. As for the exact results in the unit g/
kWh can be found to be as follows: 1. point: 1,66 for diesel, 1,84 for 100% FAME, 2,06 for 100% TBK; 2. point: 3,39 for diesel, 5,72 for 100% FAME, 6,48 for 100% TBK; 3. point: 0,98 for diesel, 1,45 for 100% FAME, 1,87 for 100% TBK. Continuous increase in par- ticulate mass in line with rise bio rate in the blend is likely because of the higher amoung of dose and also the worse physicochemical properties of bio materials.
3. With a rising blending rate of the - in internal combustion en- gine useable - bio derived tested fuels (standardized biodiesel and non-standardized TBK-biodiesel) to fossil diesel the total particulate number tendency is changeable, and there is differ- ence between the tendencies of the two bio fuels:
a. As for the tendencies compared to the fossil diesel: in case of 25 V/V% and 75 V/V% blending rates total particle numbers are lower, but with pure bio fuels the total number is higher in all investigated cases.
b. As for the tendencies between the bio fuels: there is a mini- mum point with 75 V/V% FAME blending rate, while the minimum total number concentration occurs at 25 V/V%
blending rate of TBK.
The changeable behaviour of particulate's total number of the exhaust gas against the bio blending rate can be explained probably with two effect as: (i) First one is likely that the oxygen content of bio-derived fuels have a combustion enhancing effect and causes a lower level of number until a certain blending rate (ii) while the worse physicochemical properties of biofuels take over the role at higher rates of blending and cause an increasing of number. For context between mass and number: Particulates, which cause the increase measured with gravimetric method may not be in the size range where the number has been determined.
4. On the basis of 1e3 can be stated that with an increasing blending rate of the - in internal combustion engine useable - bio derived fuels (standardized biodiesel and non-standardized TBK-biodiesel) to fossil diesel the particulate relevant emission of the engine changes significantly. Different tendencies occur among the measurement methods with going up blending rate.
Because of this situation biofuels cannot be evaluated clearly compared to fossil diesel in point of view of particulate relevant emission. From the aspect of lowest air pollution factor different fuels would be ideal, as follows:
a. From FSN and smoke opacity point of view pure FAME or pure TBK would be ideal.
b. As for particulate mass fossil diesel would be ideal.
c. If particulate total number is taken into consideration TBK biodiesel and FAME biodiesel would be ideal in a blending rate of 25% and 75% respectively.
4.1. It can mean that if a CI engine's particulate relevant emis- sion has to be evaluated in case of comparison of different fuels, at least these four kinds of measurement methods have to be used. If it is not the case then it may cause a failure in the evaluation.
4.2. A new method or new methods would have to be researched and developed, which is capable to evaluate the
particulate emission a CI engine clearly if it is about com- parison of different kind of fuels.
5. There is no a linear changing in total particulate number as a function of power of the engine. The highest total number value occurs at 61 kW engine power. This is thefirst operating points with parameters of 1300 rpm and 50% load. The total number of the emitted particles is less in case of 39,5 kW (2. engine oper- ating point: 1900 rpm and 25% load), while the total number is the lowest if the power is the highest, namely 115 kW occurs at 1900 rpm and 75% load. This statement has been proved true in case of every investigated fuel like fossil diesel, blends of bio fuels and pure bio fuels.
6. The torque of engine has a significant and clear effect on the particle number emission. In rising of torque at a permanent speed of engine lead to decrease of number of particulate emission. This statement has been proved true in case of every investigated fuel like fossil diesel, blends of bio fuels and pure bio fuels. By the engine emitted total number of particles is determined by the load of the engine throughout the engine's thermal state. The tendency seems to be clear namely with high load (high torque) where the engine's temperature is high the emission is low due to the better combustion condition.
7. According to related comprehensive studies diesel soot provides lognormal distribution under ambient relevant conditions with around 100 nm count median diameter, which is independent from the fuel types and engine operating conditions. This observation is further confirmed experimentally on the basis of our results.
8. It was not an aim of the measurement series but it is worth it to mention that this engine which has been approved for approx.
25 years emits particulate in the scale range of 10e100 nm which is in the scope of the current emission type approval regulation of heavy duty vehicle's engine regarding particulate number.
9. As for the air pollution especially particulate emission of an internal combustion compression ignition engine running on two kinds of biofuel, biofuels cannot be evaluated as an important part of the sustainability. It is the situation because the particulate mass increases and the particulate number can go up if the bio blending rate increases in the used fuel.
5.1. Further goal
There are many other particulate relevant properties, parame- ters which can be considered on thefield of our work. It is planned to continue this measurement series to determine the quantities of other important parameters like BC(EC), BrC, AAE, toxicity in order to make the work more complex from particulate relevant emission point of view. The measurements will be carried out on the same engine and with the same fuels to be able to investigate the changes of these parameters in the function of increasing bio blending rate.
In general terms it can be declared that in a comparison test series of different fuels regarding the particulate emission of a compression ignition internal combustion engine as much mea- surement methods as possible have to be used in order to be able to evaluate the changes in emission correctly. This can be a correct way to be able to decide about a fuel whether it can be a part of sustainability through air pollution.
Acknowledgement
We are especially thankful to Kristof LUKACS (Budapest Uni- versity of Technology and Economics, Department of Energy Engi- neering), to Janos JAKSA (KTI Institute for Transport Sciences Non
![Fig. 2. Indicator diagrams [8].Numbering of diagrams:](https://thumb-eu.123doks.com/thumbv2/9dokorg/1292681.103757/6.892.57.821.98.567/fig-indicator-diagrams-numbering-of-diagrams.webp)