*Corresponding author: Zsuzsanna Besenyi, Nuclear Medicine and Radiology Specialist, University of Szeged, Department of Nuclear Medicine, Szeged, Hungary, Tel: +36 20 406 7497; Fax: +36 62 544564; E-mail: zsuzsanna@besenyi.hu Received April 08, 2018; Accepted April 06, 2018; Published April 13, 2018 Citation: Besenyi Z, Hideghety K, Lengyel Z, Farkas SUI, Bakos A, et al. (2018) Comparison of 18F-FDG-PET/CT and CT Tumour Volume Delineation in Head and Neck Cancer Patients. J Nucl Med Radiat Ther 9: 362. doi: 10.4172/2155- 9619.1000362
Copyright: © 2018 Besenyi Z, et al. This is an open-access article distributed under the terms of the Creative Commons Attribution License, which permits unrestricted use, distribution, and reproduction in any medium, provided the original author and source are credited.
Keywords:
FDG-PET/CT; Computer tomography; Head and neck cancer; Tumour contouring; Radiation therapy planningIntroduction
Head and neck tumours are detected mostly in an advanced stage and have poor prognosis. Due to anatomic complexity of the region complete surgical resection is rarely possible [1]. These in most cases histologically squamous cell- tumours are sensitive to radiation therapy. Prospective and randomized clinical trials have confirmed the central role of radiation therapy in the treatment of disease [2].
Precise radiation therapy treatment planning of tumours in this region is especially important as several organs of vital importance are located close to each other in a small area [3].
There is a large amount of evidence proving the efficacy of fluorodeoxy-glucose positron emission tomography (18F-FDG PET) during detection of unknown primary, staging of disease, restaging after salvage surgery or neck block dissection as well as in assessment of response to therapy in head and neck cancer [4-7]. There is also growing interest in utilizing 18F-FDG PET in growth target volume delineation for radiation therapy planning in this sensitive region [8]. 18F-FDG PET offers delineation and precise contouring of the biologically active tumour -based on metabolic information- essential for effective treatment. It also allows for potential identification of lymph nodes missed by conventional computer tomography (CT) and magnetic resonance imaging (MRI) imaging [9]. Nevertheless the use of 18F-FDG PET in this regard is still under study, due to lack of good spatial and temporal resolution, questionable reproducibility [10].
According to current guidelines target volume delineation for radiation therapy planning is recommended by CT supplemented by MRI certain cases [10].
Comparison of
18F-FDG-PET/CT and CT Tumour Volume Delineation in Head and Neck Cancer Patients
Besenyi Z1*, Hideghety K2, Lengyel Z3, Farkas SUI1, Bakos A1, Sipka G1, Séra T1 and Pávics L1
1University of Szeged, Department of Nuclear Medicine, Szeged, Hungary
2University of Szeged, Department of Oncotherapy, Szeged, Hungary
3Positron Diagnostics Ltd., Budapest, Hungary
Abstract
Introduction: Aim of the current study was to compare gross tumour volume delineation for radiation therapy planning by PET/CT and CT scan in head and neck tumour patients.
Methods: 70 oncological patients with primary head and neck cancer were enrolled in the study. CT and 18F-FDG- PET/CT scans were performed within 3 weeks of enrolment in the planned irradiation position. For radiation therapy planning delineation of the target volumes was performed manually both in conventional topometric CT slides and in FDG-PET/CT images. Gross tumour target volume was calculated (GTVcm3) using both modalities. Numerical and geometrical (intersection divided union ratio) comparisons were assessed. Intraobserver, interobserver, and intermodality variation analyses were performed.
Results: Intra- and interobserver agreement (intraclass correlation coefficients: 0.99 and 0.97) of tumour volume delineation with 18F-FDG-PET/CT was excellent. Radiotherapy target volume as assessed by FDG-PET/
CT differed in 98% (69/70) from target volumes calculated by the CT scans. According to the metabolic information, the target volume was larger in 12 cases (18%) and smaller in 58 cases (82%). Significant differences were found between CT and PET/CT based tumour volume (paired t-test, p<0.0001). Intersection divided union ratio showed low overlap (0.32).
Conclusions: Tumour delineation for radiation therapy planning with PET/CT shows good reproducibility in patients with head and neck cancer. CT based morphologic information compared to PET/CT overestimates the tumour volume in larger lesions and may underestimate it in smaller target lesions. Differences are not only evident in tumour volume, but in geometry: Morphology of tumour volume and position.
Integrated 18F-FDG PET/CT imaging with combined morphological and metabolic information has the potential of improving radiotherapy planning, gross tumour volume (GTV) delineation. However there is currently no consensus on methods of delineation, volume definition or in regards to overall utility of 18F-FDG-PET/CT scans in radiotherapy planning of in head and neck cancer patients. This field remains an active area of research [11]. The present work aims to study the reproducibility of tumour volume determination by 18F-FDG-PET/
CT, and to compare it to the current standard contouring by CT scan in head and neck cancer patients.
Patients and Methods
We enrolled 70 patients undergoing radiation therapy planning for head and neck cancer (Group 1) in the current study. The average age of the patients was 58 ± 9 years (19-77 years). 20% of the studied patients (14/70) were women and 80% (56/70) were men. Histological distribution was the following: (94.3%; 66/70 patients) squamous
was completed by plain low-dose CT (130 kV and 70 mAs) mapping.
The PET scan was performed in three dimensional (3D) modes for 2 to 4 minutes per bed position, and the field of view was 21 cm with 25%
overlap. The 3D images were reconstructed by using an iterative process with resolution enhancement technology (point spread function correction) in a 336 × 336 pixel matrix. After imaging the head and neck region, and removing the mask, a routine whole-body mapping was performed extending from the skull base to the upper third of the thighs.
GTV was manually delineated in each patient with both modalities.
GTV selection for treatment planning was manually performed on both the conventional CT based topometric slides (GTVCT) and the PET/CT registered images (GTVPET) by a skilled radiologist and by a nuclear medicine specialist independently. XIO 3D planning system (Elekta Ltd, Crawly, UK) was used for evaluation. GTVCT contouring on the radiation planning CT was performed according to the guidelines of the Department of Oncotherapy. Available images of former contrast CT or MRI scans were reviewed under the supervision of a radiologist.
Tumour volumes were recorded and determined in units of cm3 (Figure 1).
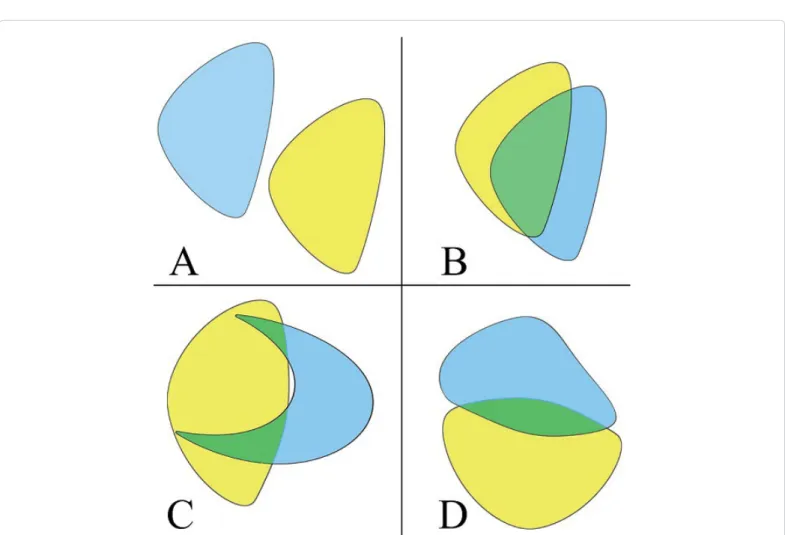
In each case, the GTV volume based on the performed 18F-FDG- PET/CT scan was compared to the GTV provided by the CT scan and their difference was described both in cm3 and in percentage. For the geometric comparison of each tumour volume of interest (VOI), the Intersection/Union (I/U) ratio was calculated. The I/U quotient is a ratio which ranges from 0 to 1. In case of full overlap, the I/U is 1, whereas in full diversity, the I/U is 0. For example, I/U=0.33 means a 50% overlap of two equal volumes (Figure 2). The total patient population (Group 1), was divided into subgroups based on differences in GTV of the two modalities (Group A: GTVPET-CT>GTVCT; Group B:
GTVPET-CT ≤ GTVCT). The before mentioned volumetric and geometrical comparisons were repeated in both subgroups.
cell carcinomas, 3 adenocarcinomas (4.2%), and 1 patient had neurofibrosarcoma (1.5%).
Interobserver and intraobserver variance analyses were performed on the 18F-FDG-PET/CT scans of 16 randomly selected patients (Group 2). In this group, the average age of patients was 58 years (44-73 years), and the male to female ratio was 16:0. Histology examination confirmed squamous cell carcinoma in all 16 patients. The locations of tumours are listed in Table 1.
Image acquisition protocol was the following. During patient preparation the head and neck region was positioned with four or five-point thermoplastic masks. Treatment planning CT (topo CT) was carried out according to standard protocols (Siemens Emotion 6 CT), 512*512 matrix, and 5-3 mm slice thickness. After CT imaging,
18F-FDG-PET/CT scan was performed within 3 weeks in the same patient position using thermoplastic fixation (SIEMENS Biograph 6 HD, Siemens Knoxville TN). After 6-hours fasting 3.7 MBq/kg 18F-FDG radiopharmaceutical was administrated intravenously. Blood glucose levels were checked beforehand (capillary blood via fingerstick, serum blood glucose <8 mmol/L). Imaging of the head and neck region was carried out 60 minutes after the administration of the radioisotope in the irradiation position, which was identical to the patient's topo CT positioning with thermoplastic mask fixation. PET scan data collection
Table 1: Primary localization of head and neck tumours. Patient Group 1: The total population; Patient Group 2: Subgroup of the total population randomly selected for intra- and interobserver analyses.
Tumor localization Patient Group 1 n=70 Patient Group 2 n=16
Oral cavity and larynx 25 6
Nasopharynx 6 4
Oropharynx, hypopharynx 33 6
Nasal cavity and nasal sinuses 3
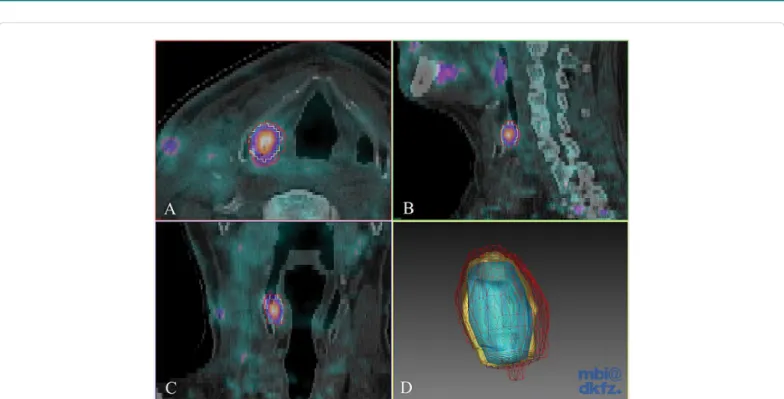
Figure 1: Interobserver analysis of 18F-FDG PET/CT gross tumour volume delineation. Axial (A), sagittal (B) and coronal slices (C) of fused 18F-FDG PET/CT images and 3D Gaussian filtered contours (D) of a head and neck cancer patient. Each observer delineated the primary tumour. Contours from the three observers are shown in different colors. Red: 2.08 cm3, yellow: 1.38 cm3, blue: 0.87 cm3; I/U ratio: 0.41.
Figure 2: Schematic illustration of geometric comparison using intersection union. (A) I/U=0 means no overlap, (B) partial overlap I/U=0.33. On both (C) and (D) pictures the I/U=0.20 highlighting the fact that both shape and position influence I/U values.
For 18F-FDG-PET/CT intraobserver and interobserver variation analyses of manual contouring 20 solid lesions with different size were evaluated in the scan images of 16 randomly selected patients (Group 2). Three experienced observers (A, B, C) determined the macroscopic tumour volume independently, with the use of the Medical Imaging Interaction Toolkit (MITK, German Cancer Research Centre) software.
Primary tumour contouring was performed in the axial slides of
18F-FDG PET scans. The contours were finalized with the help of CT images taking patient anatomy into consideration, and the GTV was also determined in cm3. Observer 'A' repeated the manual GTV delineation described above on two more occasions in random order within a week. Evaluating physicians were blinded to the patient’s clinical data and results of other imaging tests. To determine geometric interobserver and intraobserver differences, the I/U ratio was also calculated in both in the case of observers A, B and C (Figure 3), and in settings A1, A2 and A3.
Data analyses was performed with R Statistical Software version 343 (The R foundation for statistical computing, Vienna, Austria). Data were reported as mean ± standard deviation and range in parenthesis where appropriate. P<0.05 was considered to be statistically significant.
Values for I/U were interpreted in the following way: 0.8-1: excellent, 0.5-0.8: good, 0.33-0.50: moderate and 0.0-0.33: low. Applied statistical methods: Paired t-test and unpaired two-sample Wilcoxon Rank test
for comparisons of GTVCT and GTVPET-CT as applicable and intraclass correlation for inter and intraobserver differences.
The scheme of experiments complied with the ethics of research.
It agreed with the declaration of the Medical World Federation proclaimed in Helsinki in 1964, therefore, the Human Investigation review Board did not raise any objection to it from ethical point of view and supported it. Reference number: 3647, name of the ethics committee: Human Investigation Review Board, University of Szeged, Hungary.
Results
Comparison of radiation therapy target volumes delineated by 18F-FDG PET/CT and CT
Tumour volumes were identical in 1 out of 70 cases (1%), decreased in size in 57 cases (81%) of the cases, and increased in 12 cases (18%) of the cases, when the results acquired by the 18F-FDG-PET/CT scan were compared to the results defined by topo-CT scan. Tumour volumes defined by the two different imaging modalities were non-identical in 99% of the cases. In 11 out of 70 cases, the difference in the percentage of volumes was lower than 10%. The difference in the percentage of volumes was higher than 10% in 59 out of 70 patients (84% of all patients). Tumour volume defined by the 18F-FDG-PET/CT was significantly smaller (paired T test, p<0.0001) than tumour size defined
± 0.12 in overall comparison of the members in the three series. For intraobserver comparison difference in volumes (A1, A2, and A3) was 1.12 ± 1.1 cm3 that is 12.31 ± 7.4%. The intraclass correlation coefficient was 0.9903. The average I/U ratio concerning A1-A2-A3 combined was 0.76 ± 0.08.
Discussion
In the current study we report significant differences in tumour target volume and geometrical position as assessed by 18F-FDG- PET/CT and CT in patients with head and neck cancer undergoing radiation therapy planning. Defining the “real” volume of malignant tumours precisely in a standard, reproducible manner is still a challenge for diagnostic experts and radiotherapists. The variability in the defined tumour volume is particularly important in case of head and neck tumours, where there is a relatively large irradiation dose (70 Gray) applied in a small area. An inappropriately identified target volume results in an extensive marginal error of irradiation. Applying decreased irradiation to certain parts of the target volume, may lead to worsening prognosis of the disease (marginal recurrence). On the other hand inaccurate protection of tumour free areas, may lead to increasing severity of adverse effects [12]. Morphologic studies (CT and MRI scans) and functional imaging techniques (18F-FDG- PET) provide different information about the studied region, the tumour, and adjacent tissues. While computer tomography provides
Figure 3: Intermodality differences of gross tumour volume delineation. Axial (A), sagittal (B) and coronal slices (C) of fused 18F-FDG PET/CT images and 3D Gaussian filtered contours (D) of a head and neck cancer patient (hypopharynx). Contours of the two modalities are shown in different colors (red - GTVCT, yellow - GTVPET/CT).
Red: 12.2 cm3, yellow: 8.8 cm3; I/U ratio: 0.44.
by the topo-CT scan: GTVCT: 52.54 ± 51.11 cm3 (1.80-208.50 cm3), GTVPET-CT: 33.16 ± 39.78 cm3 (1.00-188.40 cm3). Difference in volume (independent of in which modality was higher or lower) was 22.33 ± 23.33 cm3 (0.40-116.00 cm3), which describes a difference of 53.77% ± 40.94% (0.55-213.25%). During geometrical analyses I/U were 0.32 ± 0.19 (0.03-0.77). Results of volumetric and geometrical comparisons of Group A (GTVPET-CT > GTVCT) and Group B (GTVPET-CT ≤ GTVCT) are presented in Table 2. To further examine the effects of tumour size on differences in radiation therapy target volumes delineated by 18F-FDG PET/CT and CT a cut-off value of 37 cm3 GTVCT was established. In all patients where GTVCT was higher than 37 cm3 (n=32) GTVCT was larger than GTVPET-CT (paired t test, p<0.05).
Interobserver and intraobserver variance analyses of
18F-FDG-PET/CT tumour delineation
Macroscopic tumour volume delineated in Group 2 during the 5 measurements (A1, A2, A3, B, and C) was 13.20 ± 13.43 cm3 (0.60-54.20 cm3). During interobserver comparison (A1, B, and C), the average difference in measured volume was 3.08± 2.36 cm3 (0.10-5.56 cm3), which described a difference of 29.49 ± 18.00% (5-78%). The intraclass correlation coefficient was 0.9724. Higher differences in percentage (46.75 ± 20.25% vs. 20.19 ± 9.17%, unpaired two-samples Wilcoxon Rank Sum test p<0.05) were characteristic mostly for tumours of smaller size (<5 cm3). The geometric intersection union ratio was 0.68
Group N GTVCT (cm3)* GTVPET/CT (cm3) NS Difference in (cm3)* Difference in percentage (%) NS I/U NS Group A
GTVPET/CT>GTVCT 12/70 13.42 ± 11.00 (1.80-36.8) 22.03 ±17.15 (3.30-54.20) 8.62 ± 9.49 (0.80-26.5) 81.26 ± 72.75 (6.29-213.25) 0.35 ± 0.20 (0.08- 0.77)
Group B
GTVPET/CT ≤ GTVCT 58/70 60.63 ± 52.44 (5.50-208.5) 35.46 ± 42.75 (0.20-188.4) 25.17 ± 24.48 (0.4-116.00) 48.08 ± 28.55 (0.55-99.37) 0.26 ± 0.15 (0-0.51) Table 2: Comparison of subgroups defined by differences found between18F-FDG PET/CT and CT gross tumour volume. Group A represents patients where GTVPET/CT was larger than GTVCT; Group B represents patients where GTVPET/CT was smaller than GTVCT. Data are presented as mean ± standard deviation with range in brackets.
*:(Wilcoxon Rank test, p<0.05); NS: not significant.
high morphological image resolution according the radioabsorption of tissues, the visualized contrast between the various soft tissues is relatively poor. On the contrary, 18F-FDG-PET scan provides prominent visualization in contrast of functional information of studied tissues, but the morphological image resolution is limited. The advantages of the two methods are combined by the hybrid PET/CT imaging modality.
Validation of tumour volumes by pathology specimens using several imaging modalities has been attempted [13]. compared CT, MRI and FDG-PET scan results of 29 patients with head and neck tumour to their surgical specimen. The size of GTVs delineated by CT scan ranged between 1.9 and 137.7 cm3, which was similar to our findings. However, in our study, slightly larger tumours were identified. According to Daisne results, the surgical specimens were significantly smaller in size compared to the results of all three imaging studies (CT=20.8 cm3, MRI=23.8 cm3, PET=16.3 cm3, and surgical specimen=12.6 cm3).
FDG-PET scan revealed significantly smaller volume than the other two modalities, and it showed the best correlation with pathology results. In terms of GTVCT and GTVPET, it was identical to our results [14]. compared CT and 18F-FDG-PET/CT scan images of 16 patients to tumour volume determined by the pathology. According to their study, both CT and 18F-FDG-PET/CT scan overestimated the tumour volume compared to the specimen; however, 18F-FDG-PET/CT scan results were closer to those of the specimens. In the meta-analysis of Huang et al. [15], data of 717 patients with head and neck tumour were processed;
both the irradiation target volume and the pathology tumour volume were determined for all patients by at least two imaging modalities (MRI, CT, or 18F-FDG-PET/CT). Their results showed that the CT- based GTV was larger than the MRI and PET scan-based volume, while GTVPET significantly correlated with the pathology tumour volume.
The role of 18F-FDG-PET/CT scan in head and neck tumour in the clinical setting of irradiation therapy has also been studied, albeit in smaller number of patients then in our study and with heterogeneous results [16-18]. Our results show significant differences in GTVs defined by functional and morphological methods, similarly to previous publications. We also report that heterogeneity of these differences is in part related to tumour size. In the current patient group larger PET/CT derived GTV-s as compared to CT were less common and only found in small lesions as defined by CT. Whereas larger CT derived GTV-s as compared to PET/CT were more common, larger, however also heterogeneous in size (Table 2). Further examining the effects of tumour size a cut-off point of 37 cm3 CT derived GTV could be established.
In all cases where tumour size was larger than the cut off volume, metabolic information of 18F-FDG-PET/CT reduced radiotherapy gross target volume. Possible cause behind this phenomenon may be inflammation and oedema surrounding larger tumours falsely included by CT in the primary tumour volume. Ciernik et al. also raised the question of tumour size effecting heterogeneous results but failed to show significant differences probably due to small sample size [16].
Paulino et al. analyzed 40 patients with head and neck cancer and found similarly to our results that the tumour size reduced in most cases as defined by 18F-FDG-PET/CT scan (in 30 out of 40 patients), whereas an increase in GTV compared to the results of the CT scan was identified only in 7 patients. In accordance with our experience, this study also found that in the case of relatively large tumours, 18F-FDG-PET/CT reduced the GTVCT in 75% of the cases [17].
Along with others our results support the view that morphological tumour volume delineation is significantly different from the metabolic tumour volume, and the difference is even more marked if volume geometry is also considered. The accuracy of tumour delineation by the
different imaging techniques is not only determined by tumour volume given in cm3. Two tumours of completely equal volume (e.g., two tumours of 2 cm3) may be different in shape and localization. During comparison measurements, not only the difference in the size (cm3) of the tumour should be considered, but also differences in localization and shape. We used, similarly to several other authors, the I/U ratio to compare the individual tumour volumes, and identified a great variety of the quotient [19-21]. Anderson et al. analyzed the manually delineated tumour volumes based on findings of CT, FDG-PET/CT and MRI (post contrast T1) scans performed for establishing the plain irradiation treatment plan in 14 patients with head and neck tumour [21]. Similarly to their work, we also examined the geometrical match between the results of the different modalities besides and found low overlap.
Contouring which may also influence results is complicated by several factors in case of both imaging technique. In CT scans, the consequences of the postoperative condition may leave asymmetry and scarring. In metabolic FDG-PET scans, the areas with physiological FDG uptake may also show diversity. In the head and neck region, there may be a physiological, moderate increase in glucose metabolism in the adenoid and lymphoid tissues, in the nasopharynx, soft palate, and tonsils (lingual and palatine), and in the salivary glands. An increased uptake of the radiopharmaceuticals in the vocal cords bilaterally and in the tongue might refer to speaking (muscle activity) during tracer accumulation time, and symmetrical uptake in the eye muscles may refer to eye movements, which are both considered being normal. For these reasons, the assessment of 18F-FDG-PET and CT scans, and the recognition of abnormalities in the head and neck region require skills and practice in hybrid imaging. Riegel et al. found tumour contouring based on 18F-FDG-PET/CT scan to be more reproducible, as opposed to the target volume defined solely by CT scan [22]. Several further studies have shown in case of head and neck tumours co-registered anatomic and metabolic images provide significantly more accurate tissue contouring than CT scan alone [23]. This is also true for imaging of specified organs at risk [24]. Vinod et al. processed the data of 56 studies in their met
a-analysis, and found that observer-dependent differences can be reduced by learning, teaching, and using uniform standards [20].
Semiautomatic contouring based on various techniques seems also to reduce the differences [25]. Our intraobserver variance analysis showed that 18F-FDG-PET/CT manual contouring was well-reproducible if the assessment was performed by the same person. Similarly to data in literature, interobserver analyses reproducibility was somewhat lower but still excellent [18,20]. Furthermore, intra and interobserver comparisons were also made taking into account not only volumetric but geometric results (tumour overlap) as well. Intra and interobserver agreement remained good by 18F-FDG-PET/CT manual contouring even when geometric differences were considered.
The current study shares all the inherent limitations of retrospective studies. This study was aimed at the determination of the primary tumour volume. The effect of the PET/CT scan was not evaluated separately on the changes in staging, and whether previously undetected potential lymph node metastases were revealed. Due to the heterogeneity of tumour stages in the relative low number of patients the study was underpowered for clinical follow-up. Although several steps were taken to ensure uniform patient preparation and image acquisition, small differences caused by patient movement/position alternation cannot be ruled out.
In conclusion manual tumour contouring of 18FDG-PET/CT images provides excellent intra- and interobserver reliability in head and neck cancer patients. CT based morphologic information compared to PET/CT overestimates the tumour volume in larger lesions and may underestimate it in smaller target lesions during radiation therapy planning. The differences in the results of functional imaging studies and the CT scans are not merely due to the differences in the size, but to the geometrical differences in the morphology of tumour volume and position. Prospective randomized large studies are needed to evaluate if these imaging modality based differences in radiation therapy planning influence clinical outcomes in head and neck cancer patients.
Declarations
The Authors declare that they have no conflicts of interest.
References
1. Argiris A, Karamouzis MV, Raben D, Ferris RL (2008) Head and neck cancer. Lancet 371: 1695-1709.
2. Gregoire V, Lefebvre JL, Licitra L, Felip E (2010) Squamous cell carcinoma of the head and neck: EHNS-ESMO-ESTRO Clinical Practice Guidelines for diagnosis, treatment and follow-up. Ann Oncol 21: 184-186.
3. Grégoire V, Chiti A (2011) Molecular imaging in radiotherapy planning for head and neck tumors. J Nucl Med 52:331-334.
4. Dong MJ, Zhao K, Lin XT, Zhao J, Ruan LX, et al. (2008) Role of fluorodeoxyglucose-PET versus fluorodeoxyglucose-PET/computed tomography in detection of unknown primary tumor: A meta-analysis of the literature. Nucl Med Commun 29: 791-802.
5. Rodrigues RS, Bozza FA, Christian PE, Hoffman JM, Butterfield RI, et al. (2009) Comparison of whole-body PET/CT, dedicated high-resolution head and neck PET/
CT, and contrast-enhanced CT in preoperative staging of clinically M0 squamous cell carcinoma of the head and neck. Nucl Med 50(8):1205-1213.
6. Abgral R, Querellou S, Potard G, Le Roux PY, Le Duc-Pennec A, et al. (2009) Does 18F-FDG PET/CT improve the detection of posttreatment recurrence of head and neck squamous cell carcinoma in patients negative for disease on clinical follow-up? J Nucl Med 50: 24-29.
7. Nelissen C, Sherriff J, Jones T, Guest P, Colley S, et al. (2017) The role of positron emission tomography/computed tomography imaging in head and neck cancer after radical chemoradiotherapy: A Single Institution Experience.
Clin Oncol (R Coll Radiol) 29: 753-759.
8. Chen YJ, Rath T, Mohan S (2018) PET-computed tomography in head and neck cancer: Current evidence and future directions. Magn Reson Imaging Clin N Am 26: 37-49.
9. Scott AM, Gunawardana DH, Bartholomeusz D, Ramshaw JE, Lin P (2008) PET changes management and improves prognostic stratification in patients with head and neck cancer: Results of a multicenter prospective study. J Nucl Med 49: 1593-1600.
10. Grégoire V, Langendijk JA, Nuyts SJ (2015) Advances in radiotherapy for head and neck cancer. Clin Oncol 33: 3277-3284.
11. Awan MJ, Siddiqui F, Schwartz D, Yuan J, Machtay M, et al. (2015) Application
of positron emission tomography/computed tomography in radiation treatment planning for head and neck cancers. World J Radiol 28: 382-393.
12. 12. Yang J, Beadle BM, Garden AS, Schwartz DL, Aristophanous M (2015) A multimodality segmentation framework for automatic target delineation in head and neck radiotherapy. Med Phys 42: 5310-5320.
13. Daisne JF, T Duprez, B Weynand, Lonneux M, Hamoir M, et al. (2004) Tumor volume in pharyngolaryngeal squamous cell carcinoma: Comparison at CT, MR imaging, and FDG PET and validation with surgical specimen. Radiology 233:
93-100.
14. Magalhaes JC, Ksperts N, Kooij N, van den Berg C, Terhaard C, et al. (2011) Validation of imaging with pathology in laryngeal cancer: Accuracy of the registration methodology. Int J Radiat Oncol Biol Phys 81: S29.
15. Huang Z, Feng Y, Lo S, Ju AW, Yuh K, et al. (2014) Tumor volume delineation in head and neck cancer with Imaging Modalities: CT, PET, MRI, compared with pathological tumor volume. Int J Radiat Oncol Biol Phys 90 Supplement: S533.
16. Paulino Ac, Koshy M, Howell R, Schuster D, Davis LW (2005) Comparison of CT- and FDG-PET-defined gross tumor volume in intensity-modulated radiotherapy for head-and- neck cancer. Int J Radiat Oncol Biol Phys 61: 1385-1392.
17. Ciernik IF, Dizendorf E, Baumert BG, Reiner B, Burger C, et al. (2003) Radiation treatment planning with an integrated positron emission and computer tomography (PET/CT): A feasibility study. Int J Radiat Oncol Biol Phys 57: 853-863.
18. Yang SN, Chiou YR, Zhang GG, Chou KT, Huang TC (2017) The clinical outcome correlations between radiation dose and pretreatment metabolic tumor volume for radiotherapy in head and neck cancer: A retrospective analysis. Medicine (Baltimore) 96: e7186.
19. Murakami R, Uozumi H, Hirai T, Nishimura R, Katsuragawa S, et al. (2008) Impact of FDG-PET/CT fused imaging on tumor volume assessment of head- and-neck squamous cell carcinoma: Intermethod and interobserver variations.
Acta radiol 49: 693-699.
20. Vinod SK, Min M, Jameson MG, Holloway LC (2016) A review of interventions to reduce inter-observer variability in volume delineation in radiation oncology.
J Med Imaging Radiat Oncol 60: 393-406.
21. Anderson CM, Sun W, Buatti JM, Maley JE, Policeni B, et al. (2014) Interobserver and intermodality variability in GTV delineation on simulation CT, FDG-PET, and MR images of head and neck cancer. Jacobs J Radiat Oncol 1: 006.
22. Riegel AC, Berson AM, Destian S, Ng T, Tena LB, et al. (2006) Variability of gross tumor volume delineation in head-and-neck cancer using CT and PET/
CT fusion. Int J Radiat Oncol Biol Phys 65:726-732.
23. Heron DE, Andrade RS, Flickinger J, Johnson J, Agarwala SS, et al. (2004) Hybrid PET-CT simulation for radiation treatment planning in head-and-neck cancers: A brief technical report. Int J Radiat Oncol Biol Phys 60:1419-1424.
24. Shivakumar G, Sarbani GL, Jai P, Suresh C, Venkatesh, et al. (2017) Interobserver Variability in the delineation of gross tumour volume and specified organs-at-risk during IMRT for head and neck cancers and the impact of FDG- PET/CT on such variability at the primary site. J of Med Imaging and Radiat Scienc 48: 184-192.
25. Lee JA (2010) Segmentation of positron emission tomography images: Some recommendations for target delineation in radiation oncology. Radiother Oncol 96: 302-307.