Working paper 248.
November 2018
Tamás Gerőcs
INDIAN COMPANIES’ TECHNOLOGICAL INVESTMENTS IN THE EU WITH A SPECIAL FOCUS ON
CENTRAL AND EASTERN EUROPE
Indian companies’ technological investments
in the EU with a special focus on Central and Eastern Europe
Author:
Tamás Gerőcs
junior research fellow
Institute of World Economics
Centre for Economic and Regional Studies Hungarian Academy of Sciences email: gerocs.tamas@krtk.mta.hu
The contents of this paper are the sole responsibility of the author and do not necessarily reflect the views of other members of the research staff of the Institute of World Economics, Centre for Economic and Regional Studies HAS
ISSN 1215-5241 ISBN 978-963-301-677-0
Indian companies’ technological investments in the EU with a special focus on Central and Eastern Europe
1Tamás Gerőcs
2Abstract
India is one of the fastest growing economies in the world whose global share in “outward foreign direct investment” (OFDI) among the developing countries increased from a low level to second only to China. It has not only been a spectacular rise in Indian overseas investment activity, but the nature and the structure of Indian OFDI have also changed in the last decades.
In the following paper we will examine the reasons and driving forces behind this spectacular rise, concentrating mostly on those host country characteristics that are the pull factors in attracting Indian investments. We follow the most recent literature on global value-chain specialization as much of Indian outward foreign investment is following a technology-seeking strategy currently. We choose Central and Eastern Europe as our case study because the region combines attributions of both advanced and developing countries in attracting Indian investment.
JEL: F14, F23, F63, H63, L22
Keywords:India, OFDI, internationalization, Central and Eastern Europe, technology-seeking investment, global value chains, production system, global contender, absorptive capacity, medium-tech manufacturing, level of productivity, R&D
Introduction
Because of the emerging mega-regional trade and investment blocks in the world economy, developing countries’ share in global investment and trade has been steadily rising since the 2000s. Multinational companies from the BRICS countries are the key drivers of this increase, accounting for 62% of total developing country outward foreign direct investment (OFDI) stock in 2016—with China alone accounting for 36% (Perea
1 This paper was written in the framework of the research project "Non-European emerging-market multinational enterprises in East Central Europe" (K-120053), supported by the National Research, Development and Innovation Office (NKFIH).
2 junior researcher, Centre for Economic and Regional Studies of the Hungarian Academy of Sciences Institute of World Economics, Tóth Kálmán u. 4, H-1097 Budapest, Hungary Email:
gerocs.tamas@krtk.mta.hu
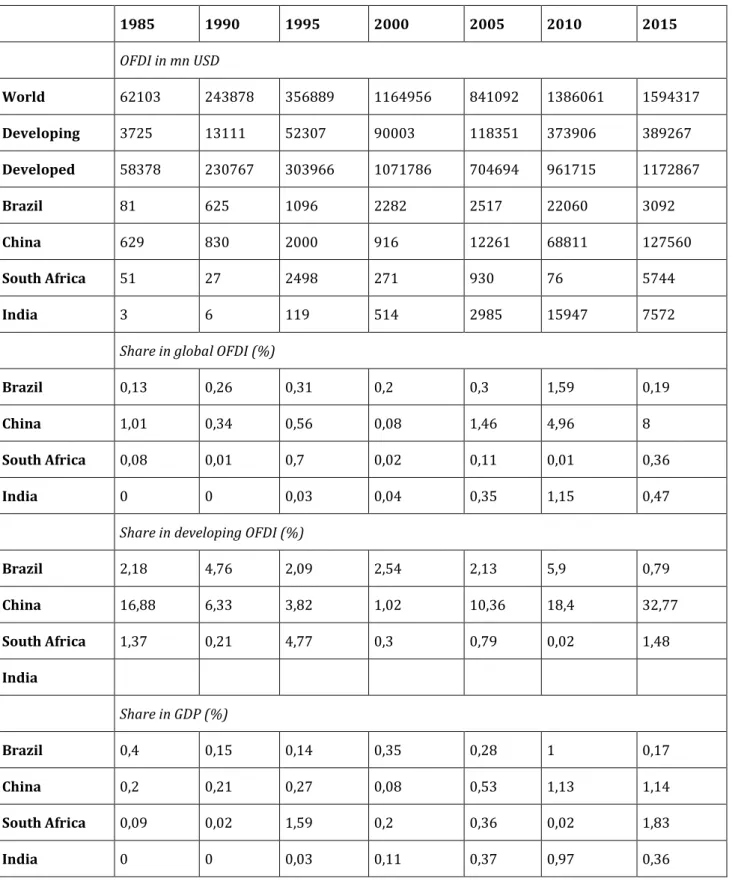
and Stephenson, 2018:114). Between 2000 and 2015, developing countries quadrupled their share in total global FDI stocks, increasing from 4% to over 15%, equal to ca. USD 3000 billion by 2015 (Figure 1). One reason for the spectacular rise is that OFDI can boost their companies’ innovation capacities.
Indian companies used to be laggards among large BRICS investors. In the 1980s the dominant proportion of Indian investment (OFDI) still concentrated in other developing countries, but since the 2000s we see a spectacular catch-up in the number of transactions in advanced western as well as Central and Eastern European (CEE) countries (Pradhan, 2017). This phenomenon mirrors the gradual evolution of Indian
“global contender” multinationals, whose history have been characterized by the elimination of economic restrictions and concomitant reforms in the Indian economy (Athukorala and Chandra 2009). Given the fact that Indian firms contributed to overseas investments since the late 1960s and have witnessed a number of key structural amendments3 in the country’s industrial policy agenda that have considerably influenced their investment behaviour, Indian companies’ experience offers one of the most insightful case studies to assess the push and pull factors in the global OFDI environment.
3 The three pillars of economic reforms in 1991 have been the cornerstone of economic policy and foreign exchange regulations, e.g. the central bank’s liberalization in relation to balance of payment activities. As a result of the liberalization, Indian firms have been seeking joint venture partnership with foreign companies. The transformation for overseas investment was further supported by administrative relaxation of the foreign exchange control, particularly as the FERA was replaced by the FEMA in 2000.
Figure 1: Share of Indian OFDI among BRICS countries 1985-2015
1985 1990 1995 2000 2005 2010 2015
OFDI in mn USD
World 62103 243878 356889 1164956 841092 1386061 1594317
Developing 3725 13111 52307 90003 118351 373906 389267
Developed 58378 230767 303966 1071786 704694 961715 1172867
Brazil 81 625 1096 2282 2517 22060 3092
China 629 830 2000 916 12261 68811 127560
South Africa 51 27 2498 271 930 76 5744
India 3 6 119 514 2985 15947 7572
Share in global OFDI (%)
Brazil 0,13 0,26 0,31 0,2 0,3 1,59 0,19
China 1,01 0,34 0,56 0,08 1,46 4,96 8
South Africa 0,08 0,01 0,7 0,02 0,11 0,01 0,36
India 0 0 0,03 0,04 0,35 1,15 0,47
Share in developing OFDI (%)
Brazil 2,18 4,76 2,09 2,54 2,13 5,9 0,79
China 16,88 6,33 3,82 1,02 10,36 18,4 32,77
South Africa 1,37 0,21 4,77 0,3 0,79 0,02 1,48
India
Share in GDP (%)
Brazil 0,4 0,15 0,14 0,35 0,28 1 0,17
China 0,2 0,21 0,27 0,08 0,53 1,13 1,14
South Africa 0,09 0,02 1,59 0,2 0,36 0,02 1,83
India 0 0 0,03 0,11 0,37 0,97 0,36
Source: Chaudhry et al. (2018:6)
Although the share of Indian OFDI used to be relatively small in comparison to other developing countries (0,4% in 1981), its share surpassed South African and Brazilian OFDI by 2005 and it is now only second to China with a share of 4,6% in 2015 (ibid).
However, India’s OFDI activity temporarily declined in 2011 because of the effects of the global economic crises. The global financial crises eroded the risk appetite of Indian companies and reduced their overseas activities in many regions (Chaudhry et al., 2018:17-23). As it is tracked by Figure 2, the flow of Indian investments decreased from USD 16,8 billion in 2011 to just USD 10,9 billion in the following year and further dropped to USD 7,1 billion in 2012. Between 2013 and 2014, the actual level of OFDI from India showed some signs of recovery and was recorded at USD 13,4 billion. India’s OFDI begun to show recovery once again and by 2017 it was estimated to increase above USD 15 billion by the end of the year4. From the beginning of 2000s until the end of 2016, the total amount of India’s foreign direct investment was roughly estimated at USD 255,4 billion (Gerőcs, 2017b). While the magnitude of OFDI has risen remarkably over the last decade, a thorough analysis in the change of the character of investments, including the transformation of the sectoral composition and the geographical characteristics, including host country attributions – which we call the pull factors - is still needed for understanding the full picture behind Indian multinationals’ global strategy.
4 Official RBI statistics on 2017 full year OFDI was not yet available by the finalization of this paper.
Figure 2: Indian OFDI flows, cumulative 5-year periods 1980-2015 (mn USD)
Source: Pradhan (2017:44)
As many of the scholars on the subject of Indian multinationals agree, the comparative advantage of the largest Indian companies has dramatically shifted from low-level of technological capabilities and labour-intensive production to middle-ranked knowledge-based, technologically-driven investments targeting advanced economies (Nölke et al., 2018). The shift has been largely driven by sectors, such as IT, pharmaceuticals, steel production and automotive industries. ’Global contenders’5 require sophisticated management practices and high level of technical expertise which they can acquire through foreign direct investments in host countries which exhibit high quality technological assets or whose economies are embedded and connected to large production systems where state of the art technology is accessible and transferable to other locations.
The general trend since the 2000s indicates that Indian multinationals expanded their global presence in advanced economies through mergers and acquisitions (M&A). While greenfield investments have been the preferred mode of entry into other developing and transition economies, including Central and Eastern Europe (Nayyar, 2008). Indian
5 Global contender: see description in Boston Consulting Group’s (2018) „Global Challengers Report”
companies started investing in CEE after the liberalization process in the 2000s6. The case study of CEE discussed in this paper hinges upon the investment experience of Indian companies in transition economies which occupy a bridge position – both in terms of their geographical proximity to western markets but also of the nature of investments in concern - between developed and developing countries. The bulk of these investments have largely been concentrated in automotive and IT but very recent economic trends suggest that CEE holds tremendous potential in tourism, pharmaceuticals, water management, alternative energy and telecom markets as well (Milelli, 2007). It is interesting to note that such investments have a peculiar profile when we compare them with Indian OFDI in western economies in the UK, US or Germany, or when we compare them to other developing markets e.g. in Africa or in Asia. Such comparative analysis is still largely missing, and this paper’s focus is neither on that, but we will give a short overview about the specific characteristics of Indian overseas investments in Central and Eastern Europe, with a particular focus on Hungary.
Theoretical discussion
Business scholars use classical modernization theories when they deal with overseas investments (cf. Vernon, 1966). Modernization theories, such as the concept of upgrading embrace companies’ foreign investment as a successful attribution of getting access to new markets and to improve technical knowledge and capacity (Gereffi et al., 2005; Gereffi, 2014).
Not much attention has been paid to those global pull factors which are restructuring the world economy. If we look at internationalization from this global perspective not all the stories of emerging companies become immediate success stories of upgrading.
These are often part of a more global restructuring in which competitive and complementary market forces simultaneously play their roles. When we take these economic forces into account, the picture becomes more complex. It is not only the decision of the particular company or the industrial policy initiated by the state that
6 The enactment of Foreign Exchange Management Act (FEMA) in 2000 liberalized the political framework by systematically raising per annum upper limits for overseas investments.
matters the most for internationalization, but many other aspects of the world economy can influence the decision of the investor company in concern (Venkata, 2006). In order to study the complex structural effects of the internationalization of Indian companies we have to gain a more thorough insight into the structure of the world economy from this global perspective.
In the following paper I overview the investment strategy of Indian companies in this complex environment in order to analyse the long-term effects of internationalization on both the host and home economies. I will pay attention not only to domestic economic factors (the so called: “push factors” behind internationalization) as I have already analysed them elsewhere (Gerőcs, 2017b). In this paper the focus is more on the host country’s characteristics which are integral parts of the world economy alike and which trigger key ‘pull factors’ in attracting investments. In order to gain insight into the host country’s characteristics (pull factors), I will show examples of Central and Eastern Europe which serves as a gateway for Indian multinationals seeking entrance to much larger and more developed global production systems in the European Union. This paper also provides an overview about where Indian multinationals tend to specialize in the newly emerging production systems and value chains and we will assess what role CEE economies might play in their global strategy in the future.
This paper is structured as follows: first, we give a global overview of Indian investment in the 2000s. Then we analyse the most important firm-specific characteristics of Indian multinationals, including imported-technology, export intensity, average size and age of the companies and the relationship between parent and subsidiary in relation to R&D activity. In the third chapter we give a summary of the most important Indian global contenders before turning to the most important host country characteristics that attract Indian investments into a particular location. The final chapter is an overview of host country characteristics in Central and Eastern Europe. We empirically show the most important selected host country specific characteristics that are attributed to the transition economies in attracting Indian investors. This empirical chapter is followed by a short conclusion.
Indian investment in global outlook
India’s share of global OFDI jumped from 0,01% in 1990 – before liberalization started – to 0,41% by 2010. And by 2015 India’s OFDI stock was equivalent to 51% of the inward FDI stock and 6,5% of the Indian GDP, 17% of gross capital formation (GFCF) (Pradhan, 2017:44). Some of these indicators showed that India’s openness exceeded the level of China (Gerőcs, 2017a).
Intensified competition in their home market – due to this liberalization process – meant that Indian firms needed to adjust to global forces in the short run and to integrate into international production systems in the long run, resulting in growing outflow of capital. Narayanan and Bhat (2017) has provided empirical evidence that there is a strong correlation between the level of productivity and degree of internationalization among Indian companies. Their model comprises of a three-scale productivity scheme in which high productivity companies – having both foreign and home-based R&D activities – have the most incentives to invest abroad. Companies in the middle-ranked productivity range tend to prefer exporting over investment into foreign locations, whereas low productivity firms still depend on domestic sales and in many cases, rely on state subsidies or protectionist market policies (cf. Topalova and Khandelwal, 2011; Thomas and Narayanan, 2017).
Thomas and Narayanan (2017:18) demonstrated that the more productive a given firm appears to be, the higher its probability to take international investment activity especially in advanced economies. Only the most productive firms have the capacity to foster foreign investment, because the financial barriers in overseas activities are usually too high for less lucrative or smaller companies. Enterprises choose OFDI over trade due to high transportation costs, or other administrative trade barriers (e.g.
discriminative tariffs or non-tariff administrative obstacles) which they have been facing lately in the two most important advanced markets: the United States (USA) and the European Union (EU). Both entities have raised barriers or deployed protective means to withhold and select out investors from outside areas, most notably from BRICS countries.
Therefore, the majority of Indian companies investing in these affluent but protected markets are usually clustered “highly productive” and strong enough to circumvent the administrative obstacles. Plus, these companies usually depend less on their home markets. The main difference between pre- and post-liberalization investment strategies in India is that motivation in the former era was still dominated by the need of the home economy, such as access to foreign currency. In the case of post-liberalization, focus is on strategic assets, for example technology-seeking and trade-supporting FDI in advanced markets which are driven more by firm-specific strategies.
The main advantage of OFDI is to reap the benefits from the proximity to large and developed, but relatively closed markets, e.g. in the EU or in the North American Free Trade Agreement (NAFTA). As Thomas and Narayanan (2017) underlines, export experience is still important before any investment decision is made. Indian companies usually start with developing trade relations; not only because of their actual level of productivity, but because they lack adequate information about the market where they want to locate their operation.
Feenstra (1998) has underlined in his seminal work that more foreign output implies more trade and not necessarily the other way around. As a consequence, it is not always previous trade activity that is followed by an incentive to invest, but the result of foreign investment is more trade. This is the reason why Indian contenders differ from those old state-owned companies that sought internationalization prior to the liberalization process. However, the model applies differently in final goods and intermediary products. In terms of the latter, empirical evidence shows a stronger substitutive effect (De Beule and Somers, 2017). In the case of final goods, we find stronger complementary effects between trade and investment, since their production is vertically linked, integrating Indian companies into global production systems. Brainard (1997) arrived at a similar conclusion, according to which there is mixed evidence regarding complementary or substitutive effects between investment and exports. The above- mentioned model showed a clear complementary relationship in India, but the picture is more nuanced if we take different firm-characteristics into account. More recent studies show that the primary drivers of internationalization are not industry-related
characteristics, such as transportation costs, trade barriers, or intangible asset-seeking, but firm specific variables. The most important characteristic in this regard is Indian companies’ access and usage of modern technology (Ramamurti, 2012). The main driver for Indian multinationals to specialize in global value chains is to get access to state of the art technology which can help them develop capacity in their home base. Therefore, we need to analyse the form such specialization take and the way companies access and transfer acquired technologies along the value chain.
Major pull factors in value-chain specialization
Researches focusing on Indian companies’ specialization in different global value chains (GVCs) show that these investments tend to follow technology-seeking strategies in advanced economies (Ramamurti, 2012). Three industries in particular dominate global contenders’ specialization: IT, automotive manufacturing and pharmaceuticals (Pradhan, 2004; Thomas and Narayanan, 2017). The vertical specialization of Indian companies in the above-mentioned industries generally occur in competitive market environment and at the middle or lower-end of the value chain hierarchy where other emerging companies also seek to take position. At the top of the chain where hierarchy plays out, the accompanying market structure is becoming oligopolistic; therefore, the balance in the specialization makes more complementary links between new entrants and incumbent firms.
The value chain hierarchy has another global dimension. The whole process of geographical relocation, the fragmentation of production and the subsequent technological transformation have been induced by immanent profitability crises peculiar to industrial production in advanced economies. The most exposed sectors are the automotive, electronics and chemical industries (Feenstra, 1998, Pradhan and Singh, 2011). The crises gave space for new entrants with new corporate techniques. For these new-entrants, however, their technology-seeking investment strategy does not translate into competition with western companies or the desire to overtaking those (Mathews, 2002). The specialization in the value chains does not automatically lead to technological upgrading. Functional upgrading depends on many home and host country
factors simultaneously. For instance, technology-seeking FDI can play two types of roles:
first, adaptation into well established and highly sophisticated western production- systems for which complex absorptive capacity is needed. Secondly, it can boost a globally competitive technology for the entire company for which transferring knowledge from the host economy back to the home country is a necessary and crucial factor (Narula, 2004). Complementary vertical specialization happens when new entrants take the position in the production system from which incumbent companies withdraw or re-specialize usually at higher ranks inside the value chain hierarchy. As researches highlight this is often the case with companies from developing economies, including India that target those positions in the value chains where incumbent western firms are squeezed by some forms of profitability crises (Gereffi, 2014). In certain industries, especially in manufacturing, standardized production has already been relocated to other developing economies, like China or India. Indian contender firms tend to specialize in manufacturing in which they become supplier to western firms (Gerőcs, Pinkasz 2019 forthcoming). Simultaneously, western partners can re-specialize in non-tangible service activities, such as design, branding, R&D and marketing activities (Gereffi, 2014; Pradhan and Das, 2013; Fleury and Fleury, 2011). In the complementary specialization western companies tend to remain the brand owners with much higher brand recognition both in their home markets as well as in emerging markets, occupying top positions in the world economy. These brand owners take buyer-driven positions in global value chains and as a result of that they successfully liberate themselves from most parts of the manufacturing process. Instead they focus on branding, R&D and marketing, as Apple’s iPhone is an indicative example in the electronic industry (Humphrey and Memedovic, 2003).
As a consequence of world economic restructuring, there is a newly emerging functional division of labour between western and developing economies as companies from the former region are leaving their traditional value chain position, especially in manufacturing. Whereas the newly rising companies from developing economies are entering into manufacturing value chains where they occupy positions that had been left vacant by their western counterparts due to the profitability crises and the subsequent
technological transformation. Any structural rigidity in the newly forming international division of labour, however, might have serious consequences for countries that specialize themselves as manufacturing suppliers at the middle and lower-end of the value chain hierarchy. Upgrading in the technological ladder is a static process in which improvements are measured by changes in the technological endowments of a given production process. The theory of upgrading does not necessarily apply to all the aspects of the international division of labour that have been mentioned before. The concept of functional upgrading presupposes improvement in the relative position of a given company in the division of labour when there is a technological modification in the production system, e.g. during the introduction of a new model. Or when new functions are added to the production process which changes the vertical specialization of the company in concern within the value chain. In other words, functional upgrading can bring benefit for companies to improve their relative position in the internal structure of the value chain (Gereffi et al., 2005; Gereffi, 2014). When we analyse Indian companies’
technology-seeking investment strategies we have to take these global forces - emanating from value chain restructuring - into account. Therefore, various aspects of the value chain governance need to be analysed in order to understand what factors create space for Indian companies’ specialization. In the following section we analyse those factors which Pradhan (2017) emphasized as the crucial firm-specific determinants for Indian companies when they enter foreign, mostly advanced markets to specialize in the local production system. These are imported technology, export- intensity, size and age of the value-chain participants, and the sectoral composition of global contenders. And finally, the thorough analysis of the value chain governance of intra-firm relationship between the foreign subsidiary and the home-based parent company in relation to their ownership structure and the division in the company’s R&D-intensive activities.
I. Technology-import
We can get a better insight into the structural transformation that has been characterizing global contenders from India, when focusing on their productivity
improvements, the evolution of which is one of the strongest determinants for global FDI activity. In terms of OFDI’s firm-specific objectives, Indian enterprises do not only intend to increase market share by acquiring intangible assets, but specific asset- or efficiency seeking FDI target technologically intensive production systems with new technologies, skills and marketing networks. These acquisitions concentrate in Europe from where technology-import usually comes. Technology import is an important determinant, it is also related to the capacity of the foreign subsidiary to transfer acquired or embedded technology back to the parent company. We distinguish between two technology import types in relation to Indian companies’ experiences. One is
‘embedded technology’ in the form of capital goods, where we find a very strong correlation and complementary effect between Indian companies’ trade and investment activities (Katrak, 1990). Capital goods can be both the product of foreign investments – especially if the production is part of an integrated value chain system – or it can be subject to trade. The other form of technology import is when the company purchases know-how-related services. This usually requires that the firm pays fees and royalties.
However, to avoid these costs Indian enterprises prefer access to new technologies through trade and investment.
II. Export intensity
Export intensity is another important determinant for Indian companies’ overseas investment. Trade experience for example does matter for companies’ foreign investment decisions because this experience provides information about the location where trade relations had been previously developed. Export experience from the past typically helps to learn about local distributional networks, consumer preferences or any institutional mechanism important for trade, production and distribution. The common denominators for Indian companies investing in a foreign location are the following: an advantageous and stable (at least predictable) fiscal regime, favourable treaties with India covering bilateral trade and investment agreements as well as a
comprehensive economic partnership with the Indian government7. In addition to these, low tax rates, including the avoidance of double-taxation constitutes a major factor. As a more recent prerequisite global contenders prefer to have access to international financial markets (Pradhan, 2017:54). We will more thoroughly analyse these factors in our case study on CEE countries, particularly investment relationship between India and Hungary.
III. Firms’ size and age
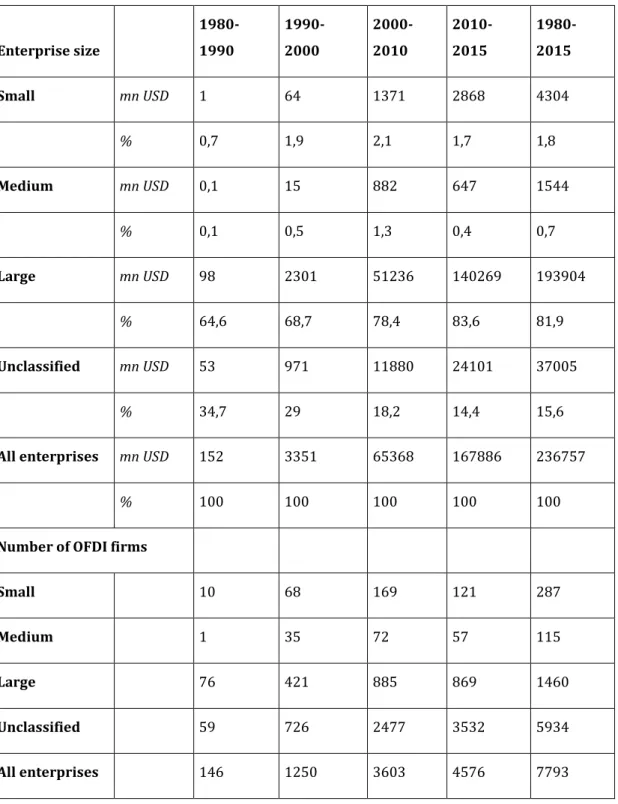
The average size and age of firms concerned with internationalization is another widely studied phenomenon (Chaudhry, 2018; Pradhan, 2017:62). It seems obvious that the bigger the given company is, the higher its probability for international engagement (Figure 3). Similarly, the older and more experienced the firm is, the more likely that it can take the risk for overseas operations, because of the previously gained experience in trade, amongst others.
7 India has bilateral investment treaties with Mauritius, Singapore, Netherlands, Switzerland, Cyprus that care for double-taxation avoidance and offer low tax rates and access to international financial markets to overseas investors.
Figure 3: Enterprise size of Indian OFDI 1980-2015
Enterprise size
1980- 1990
1990- 2000
2000- 2010
2010- 2015
1980- 2015
Small mn USD 1 64 1371 2868 4304
% 0,7 1,9 2,1 1,7 1,8
Medium mn USD 0,1 15 882 647 1544
% 0,1 0,5 1,3 0,4 0,7
Large mn USD 98 2301 51236 140269 193904
% 64,6 68,7 78,4 83,6 81,9
Unclassified mn USD 53 971 11880 24101 37005
% 34,7 29 18,2 14,4 15,6
All enterprises mn USD 152 3351 65368 167886 236757
% 100 100 100 100 100
Number of OFDI firms
Small 10 68 169 121 287
Medium 1 35 72 57 115
Large 76 421 885 869 1460
Unclassified 59 726 2477 3532 5934
All enterprises 146 1250 3603 4576 7793
Source: Pradhan (2017:64)
The latter presumption might apply in India to the period before the 2000s, but more recent studies show a rather mixed picture, which does not contradict to the hypothesis above, but provides a more nuanced understanding of the working of these
determinants (Ramamurti, 2012). As for the size of Indian companies in concern, it is valid to say that large Indian firms are the biggest foreign investors. In fact, their share among investor groups rose from 64,4% in 1989 to 83,6% by 2015 (Pradhan, 2017).
Simultaneously, the role of small and medium sized enterprises (SMEs) in this realm is climbing. Their number has increased recently especially in areas, such as IT and BPO service providers (ibid). The net worth of their projects are, however, much smaller on average, therefore their share among the investor groups is still at around 2%. They are usually small suppliers of large Indian companies, following their larger partners in internationalization. When their larger partner decides to bring operation abroad they also have to follow suit otherwise they risk losing out from the partnership. On the other hand, following their partner is regarded as a potential path to upgrade technological capacity (Narayan and Bhat, 2011).
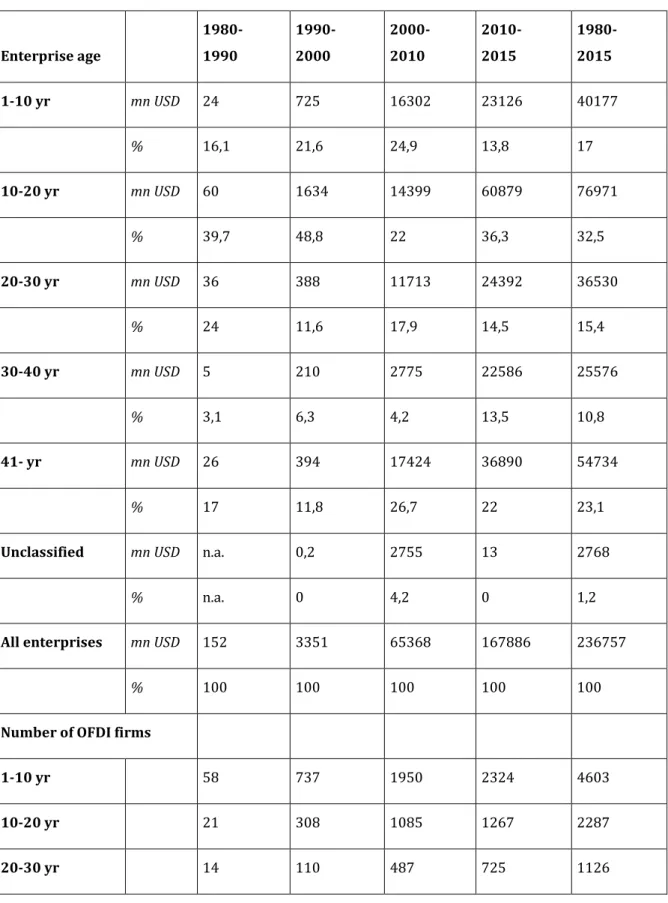
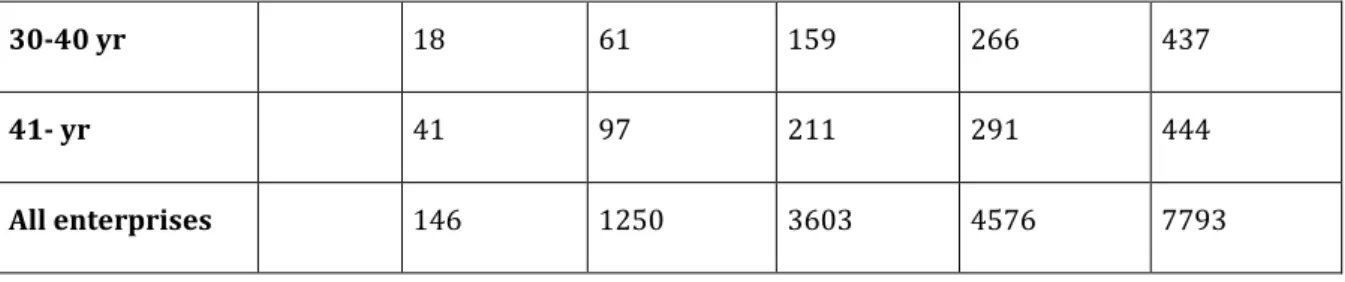
The age of the company is another variable indicating Indian companies’
internationalization strategy. Figure 4 shows a detailed statistical break-down according to which approximately 50% of new foreign investments have been made by Indian companies operating for 20 years or less (Chaudhry, 2018; Pradhan, 2017).
Furthermore, 15,4% of the investment has been made by companies in the range of 20 to 30-years, while 10,8% of investments have been made by 30 to 40-year-old investor firms. Pradhan (2017) shows that past experience in investment or in trade is a strong factor for further internationalization, because international experience is cumulative and transferable. However, recent statistics show that the average age for companies before foreign market entry has also dramatically decreased in the last few years (ibid).
An increasing number of Indian enterprises internationalize quicker than their ancestors would have in the past. The decrease of the average age for internationalization is mostly attributable to the increasing number of IT companies and other service sector participants. Many of these companies have the first experience with foreign investment while they are still in their start-up phase. This is especially typical of Indian IT start-ups active in Silicon Valley, or in other western logistic centres (e.g. in the UK or in the Netherlands).
Figure 4: Enterprise age of Indian OFDI 1980-2017
Enterprise age
1980- 1990
1990- 2000
2000- 2010
2010- 2015
1980- 2015
1-10 yr mn USD 24 725 16302 23126 40177
% 16,1 21,6 24,9 13,8 17
10-20 yr mn USD 60 1634 14399 60879 76971
% 39,7 48,8 22 36,3 32,5
20-30 yr mn USD 36 388 11713 24392 36530
% 24 11,6 17,9 14,5 15,4
30-40 yr mn USD 5 210 2775 22586 25576
% 3,1 6,3 4,2 13,5 10,8
41- yr mn USD 26 394 17424 36890 54734
% 17 11,8 26,7 22 23,1
Unclassified mn USD n.a. 0,2 2755 13 2768
% n.a. 0 4,2 0 1,2
All enterprises mn USD 152 3351 65368 167886 236757
% 100 100 100 100 100
Number of OFDI firms
1-10 yr 58 737 1950 2324 4603
10-20 yr 21 308 1085 1267 2287
20-30 yr 14 110 487 725 1126
30-40 yr 18 61 159 266 437
41- yr 41 97 211 291 444
All enterprises 146 1250 3603 4576 7793
Source: Pradhan (2017:67)
In a summary, Pradhan’s (2017:69) empirical findings show that exporting Indian firms have higher productivity than Indian companies specialized only in domestic market supply, but global contenders can achieve even higher productivity. Firms with foreign investments lead higher output, more capital-intensive production than simple export activity. Findings show that investment boosts trade and not the other way around. Investing firms are usually larger and offer better salaries to employees compared to counterparts which only interested in export. Despite the majority of Indian multinationals being older than domestic companies in average, their average age has been steadily decreasing as start-ups – especially in the IT sector – rapidly expand to overseas locations, given the nature of their activities.
IV. Ownership structure of subsidiaries
The ownership structure of Indian companies’ foreign affiliates has been shifting since the 1980s – a process reflecting broader changes in the economy. As Figure 5 demonstrates approximately 65% of the foreign subsidiaries of Indian companies comprised of joint ventures (JV) with minority stakes of the parent company in the 1980s (cf. Kumar, 2008). In 2010-2015, wholly-owned subsidiaries (WOS) of Indian companies accounted for 69% of the total OFDI approvals (Pradhan, 2017:58).
Figure 5: The ownership structure of Indian OFDI 1980-2015
Ownership type
1980- 1990
1990- 2000
2000- 2010
2010- 2015
1980- 2015
JV mn USD 95 1285 15243 52270 68894
% 62,7 38,4 23,3 31,1 29,1
WOS mn USD 49 2065 50118 115616 167849
% 32,6 61,6 76,7 68,9 70,9
Unclassified mn USD 7 0,2 7 n.a. 14
% 4,7 0 0 n.a. 0
Total mn USD 152 3351 65368 167886 236757
% 100 100 100 100 100
OFDI firms by number
JV 88 647 1285 1622 3123
WOS 34 714 2735 3395 5592
Unclassified 49 1 3 n.a. 53
Total 146 1250 3603 4576 7793
Amount of OFDI per firm (mn USD)
JV 1 2 12 32 22
WOS 1 3 18 34 30
Unclassified 0,1 0,2 2 n.a. 0,3
Total 1 3 18 37 30
Source: Pradhan (2017:58)
For the same period, 3,395 investing companies sought 100% ownership in foreign affiliates and only 1,622 sought to enter foreign markets through joint ventures (JVs) (Pradhan, 2017). The preference of Indian firms to acquire WOS in foreign affiliates could be attributed to the economic liberalization in India and to the protection of R&D centres. It is also worthwhile to mention that while Indian enterprises have increasingly
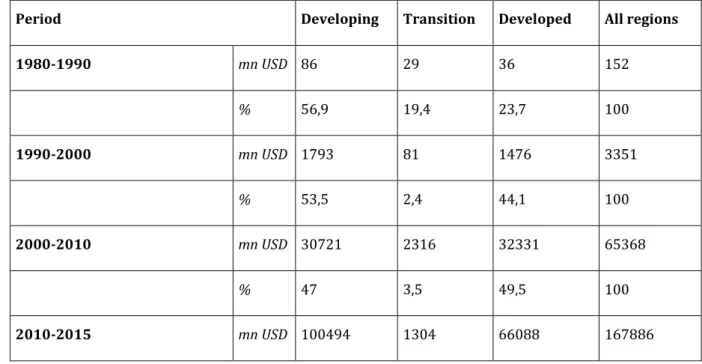
tried to enter to developed markets through mergers and acquisitions (M&As), greenfield investments are still the most popular mode of entry in key developing countries, mostly in South East Asia (Khan, 2012). This is probably due to the fact that markets in developed countries are well-established and usually do not encourage greenfield investments from outside investors. This massive shift in property relations reflects Indian multinationals’ broader structural changes. Parent companies’ decisions of ownership structures are influenced by the host country’s regulatory environment. As Figure 6 highlights, before the 1990s, the majority of Indian OFDI went into Eastern Africa and South-East Asia, where foreign investment was only permitted in the form of joint ventures – to the benefit of the host economy (Perea and Stephenson, 2018). Indian enterprises possessed modest technological advantage compared to western competitors and did not have enough experience in cross-border business operations;
therefore, JVs reduced risk in developing countries with unstable business environments8.
Figure 6: Geographical distribution of Indian OFDI 1980-2015
Period Developing Transition Developed All regions
1980-1990 mn USD 86 29 36 152
% 56,9 19,4 23,7 100
1990-2000 mn USD 1793 81 1476 3351
% 53,5 2,4 44,1 100
2000-2010 mn USD 30721 2316 32331 65368
% 47 3,5 49,5 100
2010-2015 mn USD 100494 1304 66088 167886
8 Governments in developing countries can still maintain capital account restrictions, requiring e.g.
technology transfer from foreign investors through joint ventures in order to help these investments get embedded in the local economy. Liu and Dicken (2006) call this type of embeddedness ‘obligated’.
% 59,9 0,8 39,4 100
1980-2015 mn USD 133095 3730 99931 236757
% 56,2 1,6 42,2 100
Memorandum 1980-2015
Number of investing firms 4752 144 3992 7793
OFDI/firm (mn USD) 28 26 25 30
Source: Pradhan (2017:53)
In recent years, however, investment policies in some developing countries have shifted gradually from restrictive to be little more open, although restrictions still persist overall in the country-group. In 2015, almost half of developing countries (77 out of 156) maintained OFDI restrictions (Perea and Stephenson, 2018:119). Restrictive investment regulation stem from the concern that capital outflows can cause balance of payment problems and capital is usually scarce in the home economy (Khan, 2012), as many of these countries, including India faced financial stresses and capital flight several times in the past9. Perea and Stephenson (2018) show that low-income developing countries are more likely to restrict OFDI than other middle-income countries.
According to their estimate, in 2015 60% of low-income developing countries had OFDI restrictions (36 of 60 countries); in contrast, only 43% of middle-income developing countries had any control (41 of 96). Among the large developing countries, such as the BRICS we find differences in terms of capital account openness. The most liberal country is Brazil, and China has also been rapidly opening up its capital account (Gao and Yu, 2011; Gerőcs, 2017a). India belongs to the more restrictive group together with South Africa10.
9 Measures to regulate OFDI can take the form of approval requirements, reporting requirements, foreign exchange controls, ceilings on investment amounts, or limits on destination sectors in the targeted economy (Kuzminska-Haberla, 2012).
10 India maintains a relatively restrictive framework, despite the economic liberalization of the 1990s.
OFDI in real estate is for example forbidden, it is also quite restricted in financial investments. In energy or other natural resources, manufacturing, education, and hospitals there is still an approval needed
Although restrictions on ownership have been gradually relaxed in many developing countries, a reverse process can be observed in the developed countries. Ownership requirements have been restricted in some developed countries, especially since the global economic crises in 2009. The latter is lamented by some commentators (see e.g.
Emmott and Gros and Jin and Roach, 201811) as the first steps in a potential trade war, between the likes of the US, EU and China. Despite restrictive tendencies, advanced countries still convey a liberal approach to foreign trade and investment. This has benefitted Indian companies since the 1990s, because they have been able to shift from JV in developing markets to a strongly-preferred WOS ownership structure in developed markets, such as the EU’s or the US’ due to improved competitiveness. WOS allows affected Indian companies to protect the modes of their productivity increases, underpinned by developed countries’ patent systems. Furthermore, parent firms can use the existing patent system to legally purchase and upgrade their existing technological capacity. Despite the opportunity, Indian firms still prefer to avoid this mode of acquiring technology, due to the high transaction costs involved (Charlie, 2012;
Ramamurti, 2012). Irrespective of their strategies, a secure and reliable patent system remains attractive for Indian companies when choosing a country to invest.
WOSs currently account for the dominant share of Indian foreign investments, highlighting differences between developing and developed economies in terms of transactions. In developed economies, over 80% of Indian investments were through WOSs before 2015, but slightly declining since then. The latest data from 2017 shows that the share dropped to 61%, which is largely due to some politically sensitive technological acquisitions in which the host country’s government insisted on technology-sharing in the form of joint venture to avoid technological espionage (Ramamurti, 2012). As we can see, property relations are double-edged swords, they can serve the interests of the investing company, but the host government can also enforce special regulation if it intends to protect domestic technological advancements.
from the Reserve Bank of India. RBI also monitors and regulates investments flowing into neighboring countries (for example, Bhutan, Nepal, and Pakistan). Quantitative restrictions are also set by the net worth of the Indian firm. After approval, the company must perform annual reports on each transaction.
11 Debate and forum on Project Syndicate about Trump’s trade war
The German and the US governments have been particularly active in this respect12. Germany’s reaction will be crucial in this respect because it can influence the trade regulation throughout the European Union. Political distresses in Europe, particularly in the southern member states and in the UK due to Brexit meant, however, that negotiation of a key bilateral agreement between India and the EU remained unsettled (Charlie, 2012; Perea and Stephenson, 2018).
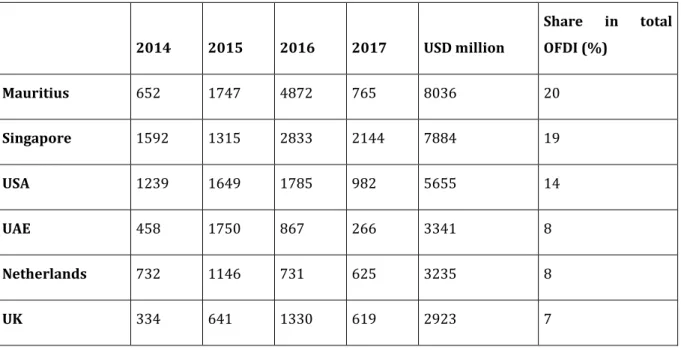
Despite the slowing down of the bilateral trade negotiation, or even because of that, Indian companies’ risk appetite to invest in European assets actually grew substantially, thanks to which the annual bilateral trade in goods and services amounted to over EUR 100 billion since 2012, and the EU became India’s second largest trading partner after the Gulf states. We see a distinct shift of Indian investments in favour of Europe at the expense of the US within developed countries (Figure 7). Europe had a share of 52% in 1989 but by 2015 over 76% of Indian foreign investments in developed countries targeted Europe.
Figure 7: Top destination for Indian OFDI 2014-2017
2014 2015 2016 2017 USD million
Share in total OFDI (%)
Mauritius 652 1747 4872 765 8036 20
Singapore 1592 1315 2833 2144 7884 19
USA 1239 1649 1785 982 5655 14
UAE 458 1750 867 266 3341 8
Netherlands 732 1146 731 625 3235 8
UK 334 641 1330 619 2923 7
12 Chinese firms are usually more exposed to governmental interventions, especially after China’s Geely managed to acquire 10% share in Daimler which the German government and Daimler’s management understood as a hostile takeover attempt. Following the acquisition, the German government initiated restrictions for investors from outside the EU (Werres, 2018).
Switzerland 361 678 492 193 1723 4
Russia 2 223 312 378 914 2
Jersey 211 99 95 80 485 1
British Virgin 107 127 102 123 459 1
Total OFDI in top 10
(mn USD) 5688 9376 13419 6175 34657
Total OFDI in top 10
(% of total) 84 88 91 84 88
Total OFDI 6803 10620 14795 7331 39549
Source: Chaudhry et al. (2018:23)
This spectacular geographical shift has been driven by Indian IT and ICT companies’
global spread. But pharmaceutical, automotive and steel companies also contributed to the dynamism. In a global comparison Europe accounted for 32% of India’s total investments between 2000 and 2015, while South-East Asia and Eastern-Africa appeared second and third with 21% and 19% respectively. In Europe, Netherlands accounted for 54% of India’s OFDI, becoming the most preferred destination in the EU due to its tax-heaven and logistical position (Pradhan 2017). In the following we take a more detailed look at the sectoral composition of this investment drive.
V. Sectoral advantages in advanced markets
After the economic liberalization of the 1990s the sectoral composition of Indian OFDI has dramatically changed (see Figure 8-9). As mentioned earlier, foreign investments were traditionally dominated by large manufacturing companies in energy and textile industries (Kumar, 2008). This was in line with the objectives of import substitutive industrial (ISI) back at the time. Large business conglomerates in
manufacturing and in extractive industries used low-level of technology and labour- intensive production when they followed their market-seeking FDI strategy. These investments were compelled to take minority stakes in joint- ventures by both of the recipient and sending regulatory authorities.
Figure 8: Sectoral composition of Indian OFDI 1980-2015 and 2000-2017
Source: Chaudhry et al. (2018:19)
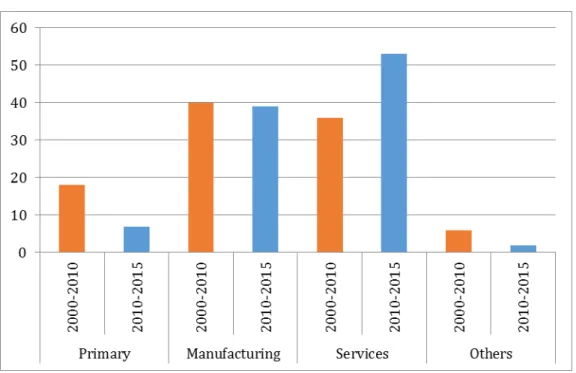
Since the 2000s, OFDI has become much more diversified as investments spread widely across economic sectors. The share of primary sector OFDI was estimated at 19%
and 6% of approved foreign investments in 2010 and 2015, respectively (Pradhan, 2017). Manufacturing captured 40% and 39% of India’s overall approved OFDI in between 2010 and 2015 respectively while the service sector accounted for 35% and 53
% in the same period. In 2010 service sector became leading force in OFDI, overtaking the position of manufacturing for the first time. Manufacturing still accounted for 40% of total Indian OFDI in 2009 because companies from the industry have also risen to take advantage of their global presence. Complex, technologically-advanced companies dealing with pharmaceuticals, medicinal chemicals and forestry products, metal and ore products, coke and refined petroleum products, etc. have emerged as important global
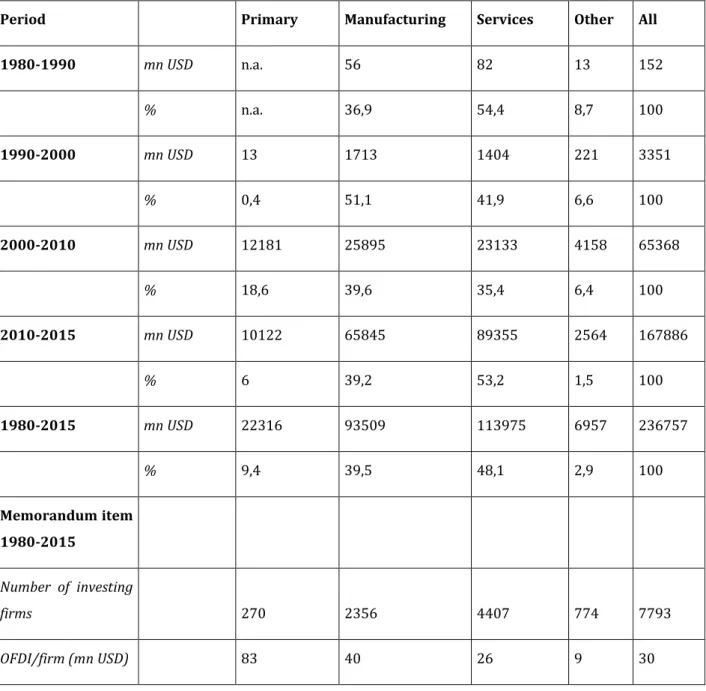
contenders between 2010 and 2015. Figure 9 demonstrates how sectoral composition of Indian OFDI changed between 2000 and 2015.
Figure 9: Composition (%) of India’s OFDI in manufacturing sector, 2000-2015
Period Primary Manufacturing Services Other All
1980-1990 mn USD n.a. 56 82 13 152
% n.a. 36,9 54,4 8,7 100
1990-2000 mn USD 13 1713 1404 221 3351
% 0,4 51,1 41,9 6,6 100
2000-2010 mn USD 12181 25895 23133 4158 65368
% 18,6 39,6 35,4 6,4 100
2010-2015 mn USD 10122 65845 89355 2564 167886
% 6 39,2 53,2 1,5 100
1980-2015 mn USD 22316 93509 113975 6957 236757
% 9,4 39,5 48,1 2,9 100
Memorandum item 1980-2015
Number of investing
firms 270 2356 4407 774 7793
OFDI/firm (mn USD) 83 40 26 9 30
Source: Pradhan (2017:47)
This new trend might also be attributed to improving economic conditions in India which helped the technologically intensive industries to strengthen competitiveness and also supported cross-border activities to boost their overseas export. Meanwhile manufacturing had overtaken services in terms of approved investments in 2000 and
2010, service sector rebounded to become the leading OFDI sector in 2010 and 2015. In contrast to manufacturing, service sector enjoys majority ownership and companies follow asset-seeking investment strategy and rely more on mergers and acquisitions (brownfield investments) in advanced economies. In the following we give a short description how foreign investment activities have changed in India in a detailed sectoral breakdown.
a. Primary sector
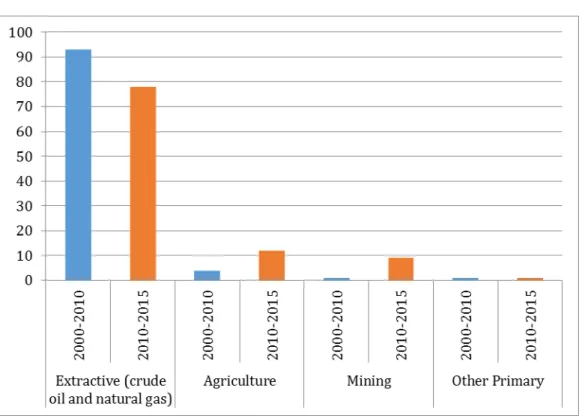
As the result of India’s latest industrialization drive the share of the primary sector has been on the rise due to growing demand for crude oil and natural gas (Figure 10).
State-owned enterprises are dominating the sector’s share in OFDI. The driving force behind the rise of the sector’s share in total OFDI has been the surge in oil prices, rapid industrialization and the subsequently growing fossil fuel demand in India (Exim Bank, 2014). In 2010 approximately 19% of total Indian OFDI comprised of primary sector investments conducted mostly by large state-owned enterprises (Pradhan, 2017). 87%
of these investments went to the energy sector (crude oil and natural gas), the rest included extractive industries in mining and a very minor share in agriculture. During the economic boom period growing demand for energy, and rising dependence on energy imports was characteristic and when domestic oil and gas market saturated, Indian firms reoriented themselves to overseas extractive industries through state- owned petroleum and natural gas enterprises. In addition, competition among emerging economies for oil products pushed Indian companies to the international stage13.
13 One of the largest state-owned company with global aspirations was ONGC Videsh Ltd. It has invested mostly in oil field exploration in Russia and in Mozambique (Pradhan, 2017).
Figure 10: Indian OFDI breakdown within primary sector
Source: Chaudhry et al. (2018:20)
b. Manufacturing
The composition of the manufacturing sector has also changed over time. It became less concentrated than it used to be before the 2000s. Chemical and textile industries accounted for over 50% of all manufacturing OFDI in the 1980s, in fact 80% of these investments were made by the top 4 companies of the time (Rajan and Yanamandra, 2015). By 2015 it has become much more diversified and the top companies accounted for less than 64% of manufacturing investments due to the broader range of industrial activities (ibid). The diversification has also affected other manufacturers with specialization in low-tech investments in basic chemical products, textiles and food processing (such as beverages and tobacco). The specialization shifted into technology- intensive investments in pharmaceuticals, motor vehicles, electronic and optical products. Although pharmaceutical, automotive companies and machinery and equipment producers seem to be the least beneficiaries of this drive in the last investment period between 2010-2015 (Figure 11).
Figure 11: Indian OFDI breakdown within manufacturing 2000-2015
2000-2010 2010-2015
Basic metals and fabricated metal 8,4 20,9
Chemicals and chemical 9,7 8,7
Coke and refined petroleum 5,1 20,7
Computer, electronic and optical products 5,1 3
Electrical equipment 1,8 3,9
Food products, beverages and tobacco 5,4 4,2
Gems and jewellery 1,4 1,7
Leather products 0,1 0,5
Machinery and equipment 14,4 7,3
Motor vehicles, and other transport equipment 21,5 3,7
Non-metallic minerals 0,9 2,4
Paper products 0,6 2,2
Pharmaceuticals, medicinal chemical 17 13,9
Printing and media 0,2 0
Rubber and plastics 3,6 2,2
Textiles and apparel 3,7 4,2
Wood products 0 0,1
Other Manufacturing 1,2 0,5
Total Manufacturing 100 100
Source: Chaudhry et al. (2018:21)
The common feature among large manufacturers was that they all grew out of a secured domestic market with generous state subsidies and a strong reliance on their home-developed innovations. These manufacturing investments still rely on home- based R&D to a large extent. As part of their technology-exploring strategy manufacturers’ subsidiaries seek technology-exploring investments. Indian manufacturing investments in middle or high-end technologies can be embedded in the production system of the targeted host economy. Therefore, the technological gap between the home and host economies matter a lot to them. These investments flow into those developing countries where advanced technologies are often exhibited and where geographical, functional or infrastructural proximity to the most advanced western markets are also available. In these locations, Indian companies can still gain adoptive capacities in research. As we will see in the last chapter of this paper, one of the most distinguished examples is automotive investments in Central and Eastern Europe.
Service sector
As mentioned earlier, the service sector has produced the largest number of Indian OFDI since 2010 partly as a result of India becoming a service dominated economy.
Improvements in the telecommunication infrastructure have been the most important driving force. The composition of the service sector indicates that ICT (Information and Communication Technology) and software developers have become major global contenders between 2000 and 2010 and between 2010 and 2015, accounting for 44% of the combined OFDI in service sector in the first period and 49% in the second period (Thomas and Narayanan 2017). High quality IT-related education combined with low- cost but highly skilled workers helps Indian IT companies’ global competitiveness. The most active companies are specializing in R&D related services. Banking and insurance occupy a significant share of OFDI in services too. Companies in this industry often follow market-seeking investment strategy as Indian service providers cannot provide effective and secure after-sale services without a close local presence. This has been a disadvantage of Indian service companies for a long time and it is anticipated that they