CORVINUS UNIVERSITY OF BUDAPEST
D
EPARTMENT OFM
ATHEMATICALE
CONOMICS ANDE
CONOMICA
NALYSIS Fövám tér 8., 1093 Budapest, Hungary Phone: (+36-1) 482-5541, 482-5155 Fax: (+36-1) 482-5029 Email of corresponding author: zsolt.darvas@uni-corvinus.huWebsite: http://web.uni-corvinus.hu/matkg
W ORKING P APER
2011 / 3
E XCHANGE R ATE P OLICY AND E CONOMIC G ROWTH AFTER THE F INANCIAL C RISIS
IN C ENTRAL AND E ASTERN E UROPE
Zsolt Darvas
January 2011
Exchange Rate Policy and Economic Growth after the Financial Crisis in Central and Eastern Europe
Zsolt Darvas January 2011
This paper was published in:
Eurasian Geography and Economics, Volume 52, Number 3 / May-June 2011, p. 390-408.
http://bellwether.metapress.com/content/wn720125j1x44477/?p=2f73f708a89f484ab6446aa400e08fc 5&pi=5
Copyright remains with Bellwether Publishing, Ltd. at all times
Abstract:
In a paper on the effects of the global financial crisis in Central and Eastern Europe (CEE), the author reacts to a paper of Åslund (2011) published in the same issue of Eurasian Geography and Economics on the influence of exchange rate policies on the region’s recovery. The author argues that post-crisis corrections in current account deficits in CEE countries do not in themselves signal a return to steady economic growth. Disagreeing with Åslund over the role of loose monetary policy in fostering the region’s economic problems, he outlines a number of competitiveness problems that remain to be addressed in the 10 new EU member states of CEE, along with improvements in framework conditions supporting future macroeconomic growth.
JEL codes: F300, F400, F500, P260.
Key words: Central and Eastern Europe, Baltic states, exchange rate policy, global financial crisis, floating exchange rate, fixed exchange rate, inflation, internal devaluation, credit boom, overheating economy, current account balance, negative output gap, euro area, unit labour costs, price competitiveness.
Zsolt Darvas is Research Fellow at Bruegel (Brussels-based think tank) and the Institute of Economics of the Hungarian Academy of Sciences, and Associate Professor at Corvinus University of Budapest (email: zsolt.darvas@uni-corvinus.hu). The financial support of the German Marshall Fund of the United States to Bruegel’s research underpinning this paper is gratefully acknowledged.
1. Introduction
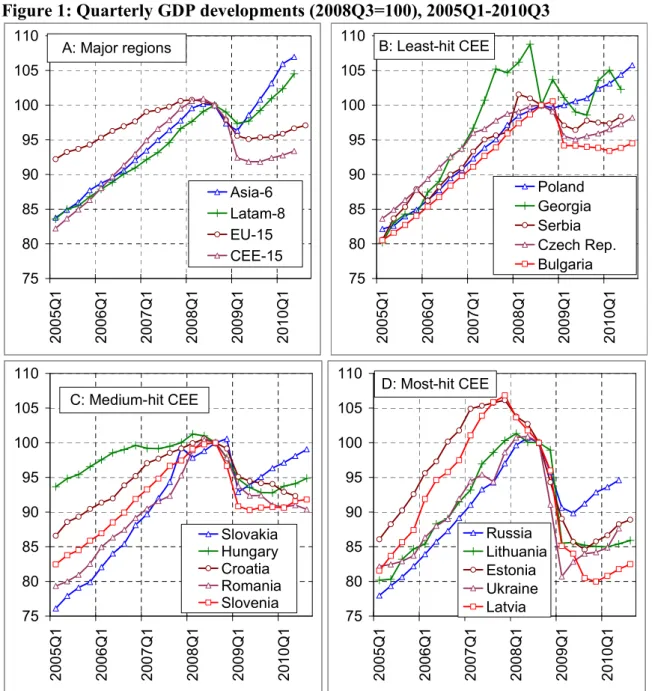
The global financial and economic crisis has damaged the economies of most Central and Eastern European (CEE) countries1 more severely than those elsewhere in the world. And the post-crisis recovery also has tended to be slower in CEE than in other emerging economies (Figure 1). In the smaller Asian and Latin American countries2, GDP rebounded as soon as global trade began to recover. Such a parallel recovery has not occurred in CEE. Both the deep impact of the crisis and the slow recovery raise questions pertaining to the unique pre-crisis development model of the region.
Similarly deep crises were experienced in several Asian and Latin American countries in the 1990s and early 2000s. These led to a major questioning of the pre-crisis development model in these countries and resulted in significant policy changes.
Before the global financial crisis, the CEE countries seemed to be catching up with their Western European counterparts rather rapidly and smoothly after the extraordinarily deep recession that followed the collapse of their communist regimes. Most had entirely regained their pre-transition income levels relative to the EU-15, whereas others were well on their way toward attaining that goal (Table 1). The main focus of the development model for CEE countries was integration with the EU.
The vision of EU integration and accession talks drove reform and still provides institutional, legal, and behavioural anchors for non-EU CEE countries that have realistic hopes of becoming EU members. As a result of this process, the financial and trade sectors of CEE countries’ economies have reached a high level of integration with those in the EU, prompting significant labour mobility from CEE to the EU-15 countries.
Not unexpectedly, however, there are substantial differences among the individual CEE countries within this common framework. In a few, catching-up was supported by strong manufacturing sectors, accompanied by macroeconomic stability. But many countries had become increasingly vulnerable prior to the onset of the crisis. In particular they experienced enormous credit, housing, and consumption booms, and thus high current account deficits and external debt levels.
Before the crisis, it was widely believed that these vulnerabilities would have to be corrected at some point, but the correction experienced during the crisis was much faster and deeper than expected.
Nonetheless, with the notable exception of Poland, even the countries in CEE that had maintained macroeconomic stability prior to the financial crisis sustained substantial output declines. Using cross-section and panel regression techniques, Darvas (2011) found that the crisis altered future growth prospects of CEE countries. Against this background, this paper highlights some of the key features of the region’s development model, with particular emphasis on the role of exchange rate policies on outcomes. Because I argue that competitiveness problems loom large in several fixed- exchange rate countries, I also evaluate some of the structural framework conditions for economic growth, which, in my view, may work as a bottleneck, impeding the future growth potential of several CEE countries.3
1 This paper focuses on the 10 CEE members of the EU (CEE-10), namely Bulgaria, Czech Republic, Estonia, Hungary, Latvia, Lithuania, Poland, Romania, Slovakia, and Slovenia. For comparison, some figures also include a broader set of CEE countries that were formally part of the Soviet bloc.
2 Figures 1 and 3 also compare CEE countries with Asian and Latin American ones of similar size that have reasonably liberalized and well-functioning market economies, as well as broadly similar income levels.
3 It should be emphasized that this paper does not discuss the chronology of the crisis in CEE and some of the broader implications of the crisis for the development model of the region. The reader is directed to Mitra et al. (2009), Åslund (2010), and Becker et al. (2010) for comprehensive overviews of the crisis in CEE and its implications. For a geographic perspective, see Smith and Swain (2010).
Figure 1: Quarterly GDP developments (2008Q3=100), 2005Q1-2010Q3
75 80 85 90 95 100 105 110
2005Q1 2006Q1 2007Q1 2008Q1 2009Q1 2010Q1
Asia-6 Latam-8 EU-15 CEE-15 A: Major regions
75 80 85 90 95 100 105 110
2005Q1 2006Q1 2007Q1 2008Q1 2009Q1 2010Q1
Poland Georgia Serbia Czech Rep.
Bulgaria B: Least-hit CEE
75 80 85 90 95 100 105 110
2005Q1 2006Q1 2007Q1 2008Q1 2009Q1 2010Q1
Slovakia Hungary Croatia Romania Slovenia C: Medium-hit CEE
75 80 85 90 95 100 105 110
2005Q1 2006Q1 2007Q1 2008Q1 2009Q1 2010Q1
Russia Lithuania Estonia Ukraine Latvia D: Most-hit CEE
Note: Seasonally adjusted real GDP series are shown. The Census X12 method was used to adjust series that were avail- able only in unadjusted form (Georgia, Croatia, Serbia, Malaysia, Philippines, Argentina, and Peru). Asia-6 = Indonesia, Korea, Malaysia, Philippines, Taiwan and Thailand; Latam-8 = Argentina, Brazil, Chile, Columbia, Ecuador, Mexico, Peru, and Uruguay; EU-15 = the 15 member states of the EU before 2004; CEE-15 = 15 Central and Eastern European countries shown in Figures 1B, 1C, and 1D. For the country groups, unweighted arithmetic averages are used. In Figures 1B–1D countries are ordered according to the magnitude of their GDP decline since Q3 2008.
Source: Compiled by the author from Eurostat (n.d.; EU countries and Croatia), OECD (Brazil, Chile, Korea, Mexico, and Russia), national statistical offices (Serbia, Ukraine, Indonesia, Malaysia, Taiwan, Thailand, Argentina, Colombia, Ecuador, Peru, Uruguay) and IMF (2010; the Philippines and Georgia).
Table 1. Per Capita GDP at Purchasing Power Parity (EU15 = 100), 1989–2010
1989
Minimum between 1989 and
2010 2010
Change from 1989
to 2010
Slovenia 75 57 83 7
Czech Republic 71 58 73 1
Slovakia 54 39 65 11
Hungary 54 43 55 1
Poland 38 31 55 17
Estonia 48 30 54 6
Croatia 58 37 52 -6
Lithuania 57 28 48 -9
Russia 56 27 46 -10
Latvia 43 24 41 -2
Belarus 29 16 39 10
Romania 35 24 36 0
Bulgaria 45 23 35 -10
Kazakhstan 30 18 35 5
Serbia 46 22 32 -14
Montenegro 47 23 30 -17
Azerbaijan 26 8 29 3
Macedonia 39 22 28 -11
Albania 17 10 22 4
Ukraine 34 13 20 -15
Turkmenistan 15 5 19 4
Armenia 14 5 15 1
Georgia 23 7 14 -8
Uzbekistan 8 5 9 1
Moldova 17 6 9 -9
Kyrgyzstan 10 5 7 -3
Tajikistan 16 3 6 -10
Note: Data for the pre-transition period are of questionable quality. Countries are ranked according to their 2010 per capita GDP level.
Source: Author’s calculations based on data from IMF, 2010b and EBRD, n.d.
2. The legacy of the pre-crisis boom
In terms of the main macroeconomic conditions that prevailed during their pre-crisis economic growth phase, most CEE countries differed from other emerging countries in Asia and Latin America. After the dramatic crises of the 1990s and around the turn of the millennium, Asian and Latin American countries fundamentally changed their economic models, from being net capital importers to becoming balanced, or even substantial capital exporters (especially the ones in Asia).4 The CEE region was different, however, with capital moving primarily “downhill”—mostly from affluent EU-15 countries to the poorer in CEE. The main supply-side factors for capital flows into CEE countries included, inter alia, the favourable prospects for economic growth and eventual EU integration and the related improvement in the business climate, the generally highly educated labour force combined with the low level of wages, as well as the low level of domestic credit, offering the
4 Capital exports from poorer to richer countries is sometimes referred to as capital moving “uphill” (e.g., see Abiad et al., 2009).
potential for substantial credit expansion. These flows took the form of foreign direct investment (including the purchasing of about 70 percent of CEE banking systems), portfolio investments, and loans.
There were demand-side factors as well, which were particularly strong in the countries with fixed exchange rates.5 As CEE countries were on an economic growth path to catch up with the main euro-area countries, their price levels were also set to increase relative to those in the euro area.
Price-level increases relative to a country’s main trading partners can occur through either higher inflation or nominal exchange-rate appreciation. Estonia had a fixed exchange rate against the euro (and previously the Deutsche mark) since its independence, and hence all price-level convergence toward euro-area price levels took the form of higher inflation. Bulgaria adopted a currency board against the Deutsche mark in 1998, which has continued in the form of a euro peg since 1999. On the other hand, Latvia had a peg against the SDR (Special Drawing Rights of the IMF) until 2004 and Lithuania against the U.S. dollar until 2002. As a result of the movements of the euro against the SDR and the dollar, Latvia and Lithuania experienced appreciation from 1999 to 2002 both against the euro and in nominal effective terms. Nominal appreciation was especially marked in Lithuania (about 50 percent), which contributed to that country having the lowest inflation rate among the CEE countries in the earliest years of the 2000s, and even experiencing deflation in 2003. However, once these countries pegged their currencies to the euro, price-level convergence with the euro area occurred through higher inflation.
The fixed-exchange-rate regime enjoyed high credibility in all countries in which it was applied. In the Baltics, this credibility was boosted by these economies’ survival during both the turbulent early transition years (first half of the 1990s) and the Russian crisis in 1998.6 The stability of the exchange rate created an incentive to borrow in foreign exchange, because the nominal interest rates of euro loans were somewhat below local-currency loan rates. As inflation started to pick up after 2004, people and corporations recognized that their wages and incomes, as well as prices, were rising much faster than the percentage cost of the loans—i.e., real interest rates became negative. The negative real rate pushed up demand for loans and amplified the boom, leading to excessive inflation and a vicious circle of high inflation, low real interest rate, credit boom, and overheating. Furthermore, rapid economic growth fuelled expectations that high growth would continue, encouraging people to borrow against their future income, as predicted by intertemporal optimization models.
Consequently, both supply and demand factors contributed to the emergence of substantial credit booms that fostered corresponding booms in construction, housing, and consumption.7 Budget policy also amplified the boom, especially in Latvia, but to a lesser extent in Lithuania.8 These factors
5 Among the CEE-10, Bulgaria, Latvia, and Lithuania currently have fixed exchange rates and the Czech Republic, Hungary, Poland, and Romania have floating exchange rates. Three of the CEE-10 are now members of the euro zone; of these Estonia had a currency board before joining and Slovenia a tightly managed exchange rate regime. They are thus considered as having fixed exchange rates before entering the euro zone. Slovakia (the third CEE-10 euro zone member) had a floating exchange rate starting in 1998. Even though it joined the ERM-II exchange rate mechanism in 2005, its currency continued to fluctuate and appreciate (as if responding to a floating exchange rate) until the final conversion rate was fixed in the summer of 2008.
6 Note, however, that the effect of the Russian crisis on these countries is dwarfed by the current crisis.
7 Ireland and Spain experienced similar developments after entry into the euro zone in 1999 (although to a much lesser extent than in the Baltics). This was due to their rapid economic growth and inflation rates exceeding the euro area average, in tandem with a low euro-area interest rate that boosted demand and contributed to housing and construction booms (see Ahearne et al., 2008).
8 Using structural vector autoregressions, Darvas (2010c) found that fiscal policy was pro-cyclical in most CEE countries—that is, expansionary during economic booms and contractionary during recessions—thereby amplifying
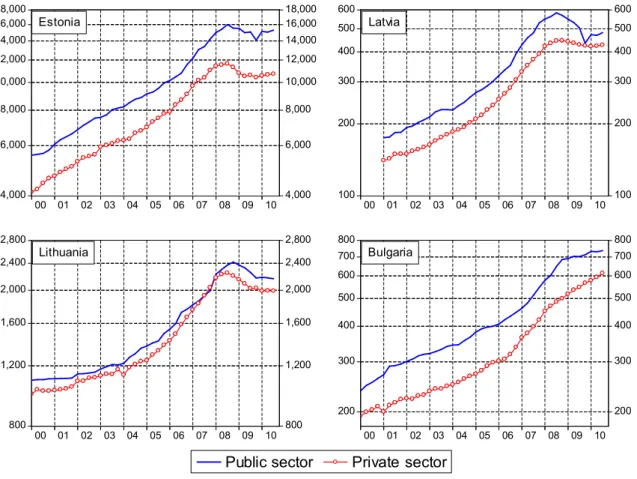
gradually overheated the economies and, in the years immediately preceding the crisis, led to a sharp rise in wages (Figure 2),9 inflation, and current account deficits (Figure 3).
Figure 2: Average monthly nominal wages in the three Baltic countries and Bulgaria (in local currency), 2000Q1-2010Q3
18,000 16,000 14,000 12,000 10,000 8,000
6,000
4,000
18,000 16,000 14,000 12,000 10,000 8,000
6,000
4,000 00 01 02 03 04 05 06 07 08 09 10
Estonia
600 500 400 300
200
100
600 500 400 300
200
100 00 01 02 03 04 05 06 07 08 09 10
Latvia
2,800 2,400 2,000 1,600
1,200
800
2,800 2,400 2,000 1,600
1,200
800 00 01 02 03 04 05 06 07 08 09 10
Lithuania
800 700 600 500 400
300
200
800 700 600 500 400
300
200 00 01 02 03 04 05 06 07 08 09 10
Public sector Private sector
Bulgaria
Note: Raw data were seasonally adjusted using the X-12 method.
Source: Compiled by the author from data obtained from the central statistical offices of the respective countries (Bulgaria, n.d.; Estonian, n.d.; Latvijas, n.d.; Statistikos, n.d.) and author’s calculations.
Although considerable foreign direct investment (FDI) flowed into the fixed exchange-rate countries, most of the current account deficit was financed by borrowing from abroad. As a consequence, massive external liabilities were accumulated (Figure 4), of which the bulk was private-sector external debt. As the examples of the Czech Republic and Poland indicate, that kind of a development was not inherently unavoidable. For this reason, I do not share Åslund’s view (2010, 2011) that the loose monetary policy of the U.S. Federal Reserve and the European Central Bank was the key factor contributing to the increasing vulnerability of the CEE countries. Certainly, excess global liquidity created an environment that paved the way for excessive capital inflows into emerging countries. And indeed, previous crises in the emerging markets were frequently preceded by loose U.S. monetary policy and were then triggered by U.S. tightening. But the diverse developments in CEE, and also the fact that this time emerging Asia and Latin America were barely
business-cycle fluctuations. There were only a few exceptions, such as Estonia, in which fiscal policy was counter- cyclical (i.e., cycle-stabilizing) before the crisis.
9 Migration to Western Europe and a shortage of qualified workers also have contributed to wage increases.
affected by the crisis, suggest that global liquidity conditions should not have played a pivotal role in the pre-crisis build-up of vulnerabilities in several CEE countries.
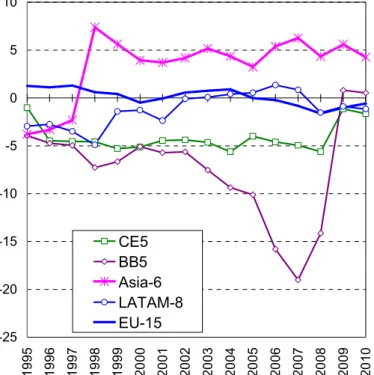
Figure 3: Current account balance (percent of GDP), 1995-2010
-25 -20 -15 -10 -5 0 5 10
1995 1996 1997 1998 1999 2000 2001 2002 2003 2004 2005 2006 2007 2008 2009 2010
CE5 BB5 Asia-6 LATAM-8 EU-15
Note: CE5 = Czech Republic, Hungary, Poland, Slovakia, and Slovenia; BB5 = Bulgaria, Estonia, Latvia, Lithuania, and Romania. Composition of Asia-6 and Latam-8 groups is specified in the caption of Figure 1.
Source: IMF (2010b) and author calculations.
Table 2 reveals differences among the CEE-10 in the allocation of foreign direct investment across different sectors of the economy. Floating-exchange-rate countries tended to have the highest share of total FDI in their manufacturing sector, whereas in most fixed exchange-rate countries FDI shares were particularly high in financial intermediation and real estate. There is hence a significant difference in the role of FDI in the two different groups of economies with respect to supporting the development of industrial capacities and a focus on tradable versus non-tradable sectors.
Table 2: FDI stock by activities (shares in percent), December 2007
A-C Agricult.,
Fishing, Mining
D Manufactu
ring
E Elect., gas and
water supply
F Constructi
on
G-H Wholesale
, Hotels
I Transport, communic
ation
J Financial intermedia
tion
K Real estate, renting &
business act.
Other
Czech Republic 3 37 8 1 10 8 16 15 1
Hungary 1 36 5 1 15 7 12 20 3
Poland 1 34 3 2 17 7 19 15 3
Romania 5 33 3 2 15 8 23 11 1
Slovakia 2 43 14 1 12 6 16 6 1
Average of floating exchange rate countries
2 37 7 1 14 7 17 13 2
Bulgaria 1 19 4 7 16 15 16 21 1
Estonia 1 15 3 2 14 4 33 27 1
Latvia 2 9 5 2 13 8 28 22 11
Lithuania 1 36 9 2 12 13 17 8 4
Slovenia 0 27 3 1 13 3 40 12 1
Average of fixed exchange rate countries
1 21 5 3 14 9 27 18 3
Source: Hunya, 2010 and other calculations.
Figure 4: Net foreign assets (percent of GDP), 2008
-150 -125 -100 -75 -50 -25 0 25 50
Bulgaria Hungary Latvia Estonia Slovakia Romania Lithuania Poland Czech Rep. Asia-5 Slovenia Latam-8 EU 15
Other investment Portfolio investment Direct investment
Note: Countries are ordered according to their overall net foreign assets position.
Source: IMF, 2010a.
Deceleration of credit growth (and even a contraction of GDP in Estonia and Latvia) had already started even before the global financial crisis. But the crisis greatly amplified the correction and led to very sharp drop in GDP, especially in the three Baltic countries, with all the associated consequences (Figure 1). Although the EU introduced measures to assist crisis-impacted CEE countries (Darvas, 2009b), crisis management in the euro zone has had the unintended consequence of putting non-euro-area new EU member states at a disadvantage (Darvas and Pisani-Ferry, 2008), which likely also has contributed to more serious repercussions emanating from the crisis.
As Åslund (2011) observes, the CEE-10, including the Baltics, did not change their exchange rate
systems during the crisis.10 While during the first wave of the crisis after the collapse of Lehman Brothers, even Czech and Polish policymakers seemed to have revised their previous anti-euro stance, a few months later euro aspirations had returned to the pre-crisis position: countries with floating exchange rates were in no rush to adopt the euro, while countries with fixed exchange rates remained committed.11
Countries with fixed exchange rates opted for a so-called “internal devaluation,”—i.e., domestic price and wage cuts. While public-sector wages indeed have started to fall considerably in the Baltic countries, private-sector wages have hardly followed suit (Figure 2). At the same time, current accounts have turned to surpluses, which has been widely interpreted to mean that no further improvement in price competitiveness is necessary. However, the sudden current account adjustment may be explained in at least three different ways, with each explanation having different implications for the need for competitiveness adjustment. The following section of the paper explores this issue in somewhat greater detail.
3. Evaluation of recent current account surpluses
Figure 3 illustrates that previously high current account deficits had already been adjusted by 2009.
The three Baltic countries are expected to report current account surpluses in the coming years as well. One may argue that these surpluses remove the need for further relative price adjustment (i.e., either formal devaluation of the currency or “internal devaluation”). However, this claim fully depends on the fundamental forces driving this adjustment and as well as on its sustainability. We now explore three possible explanations.
Financing Constraints. One possible explanation for the current account adjustment is the sudden termination of capital inflows (i.e., the lack of financing). In this case, domestic agents have no choice but to reduce imports, and the adjustment does not invalidate the need for a significant relative price adaptation: the economy might be uncompetitive, and the change in relative prices would still be required for economic recovery and for sustaining the adjustment in the current account. A continued lack of financing of the current account imbalance coupled with insufficient adjustment in relative prices might not allow the economy to turn to a robust growth path, even after the correction of negative output gaps.
Negative Output Gap. A negative output gap12 (e.g., idle capacity and unemployment) induces domestic agents to voluntarily postpone imports due to uncertainty about economic prospects. Again, such a situation would not eliminate the need for relative price adjustment. Whenever the output gap moves toward zero, a current account imbalance will emerge, provided there is a source of financing.
10 Note, however, that Ukraine did abandon the exchange rate peg and introduced a floating exchange rate in late 2008 (see Åslund, 2009).
11 One argument among many against devaluation in Latvia during the IMF/EU negotiations for a financing program was the desire to fulfil the exchange rate criterion for eurozone entry. However, Darvas (2010b) notes the exchange rate criterion requires “observance of the normal fluctuation margins provided for by the exchange-rate mechanism of the European Monetary System, for at least two years, without severe tensions, and in particular, without devaluing against the euro”. Even though Latvia has not devalued its currency, it was also assessed to have violated this criterion, even if the exchange rate has not depreciated, because the international balance-of-payments support was the reflection of
“severe tensions” and have likely contributed to the avoidance of exchange rate depreciation.
12 A negative output gap can also be of course the consequence of financing constraints.
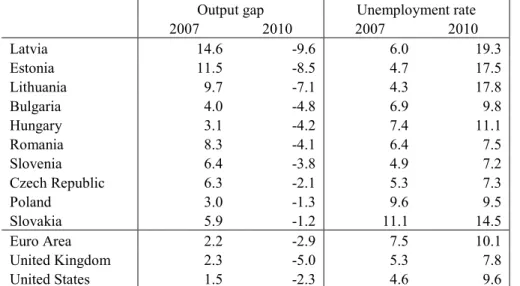
Table 3 shows that the four fixed-exchange-rate countries are estimated to have the highest negative output gaps in 2010.
Disappearance of Unsustainable Consumption and Investment Booms. A third possible explanation is that fixed-exchange-rate countries did not have a competitiveness problem, even in the boom years before the crisis, and their huge current account deficits were merely the consequence of an unsustainable consumption boom, fuelled also by intertemporal optimization (i.e., agents borrowing in the present against anticipated higher future income). Unsustainable investment booms (e.g., in the real estate sector) also may have contributed to the build-up of pre-crisis current account deficits. With the onset of serious recession, consumption was adjusted downward partly because of less positive future growth expectations. The unsustainable component of investment has also been adjusted because of the emergence of overcapacity in the construction sector, property price declines, and a lowered future outlook for prices. Under these circumstances the adjustment achieved thus far in the current account is broadly sustainable and a return to more normal growth without excessive consumption and investment booms will lead to the emergence of “reasonable” current account balances.
The three explanations13 have different implications for the need for further adjustment. If the competitiveness problem is serious, then a significant adjustment in relative prices is needed, despite the recently achieved current account surplus. If competitiveness problems are minor, then relative price adjustment may not be needed.
The recent export performance of the fixed-exchange-rate countries is at least no worse than that in the other EU member states, which is to some extent encouraging. The broadly similar export performance was accompanied by much sharper output declines in the Baltic countries. This implies that the sharp output contraction in the Baltic countries was attributable mostly to sectors producing for domestic sales, and export capacity may have not been affected any more than in other countries.
Looking at imports, all three Baltic countries have reported a sharper decrease than the other CEE-10 countries under consideration. The fall in imports is consistent with all three possible explanations of the recent current account surpluses described above. However, while all three explanations may have played a role (to different degrees in the different countries), there are at least three reasons that suggest that regaining competitiveness is crucial, even if the third explanation is the main reason for the previous high current account deficits and recent surpluses.
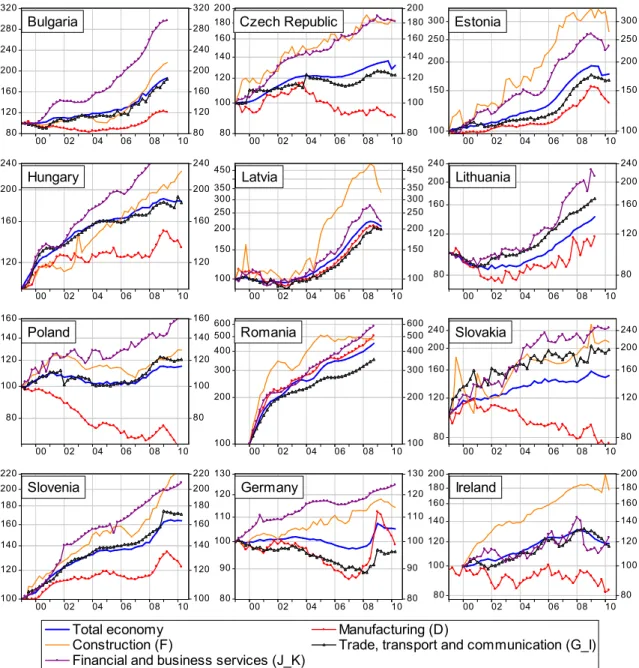
First, during the pre-crisis boom, inflation differentials and wage increases far outstripped productivity growth in a number of CEE economies. Not surprisingly, this problem was greatest among the countries with fixed exchange rates, because in floating-exchange-rate countries real appreciation can also be accommodated by nominal exchange rate appreciation. Unit labour costs (ULC) have thus increased significantly in fixed-exchange-rate regime countries, with the construction sectors in Estonia and Latvia having witnessed tripling and quadrupling, respectively, of ULC in less than a decade14 (Figure 5), but ULC has also increased sharply in the manufacturing sector in Estonia and Latvia. However, a floating exchange rate is not a panacea, inasmuch as ULC has also increased rapidly in Romania.15 But floaters on average performed better. Manufacturing
13 A small part of the improvement in the current account balance is due to lessened transfer of profit.
14 Kuodis and Ramanauskas (2009) document the same phenomenon for Lithuania. Unfortunately, construction ULC for Lithuania is not available in the OECD dataset used to compile Figure 5.
15 Note that exchange rate depreciation can compensate for the rise in unit labour costs, as happened, for example, in Romania. But in countries with a fixed exchange rate, a change in the nominal unit labour cost indicates a change in competitiveness.
ULC declined in Poland and Slovakia and was relatively steady in the Czech Republic. Figure 5 also depicts ULC developments in Germany, the main trading partner of CEE countries, and in Ireland, a country that also experienced a housing boom before the crisis. The German “internal devaluation” is clearly visible. In Ireland, while total economy ULC has increased considerably, ULC in its manufacturing sector has fallen somewhat (Darvas, 2010a). Consequently, unlike the Irish economy, many CEE countries also suffered from a loss of competitiveness in this sector.
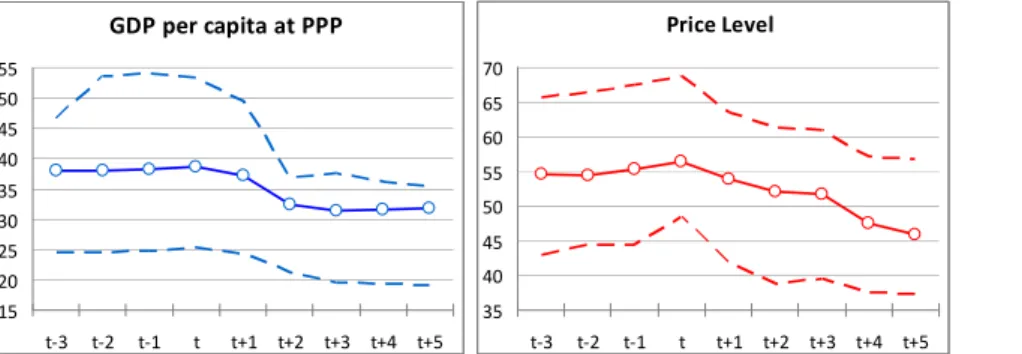
Second, the non-tradable sector developed especially rapidly during the boom years in fixed- exchange-rate countries. Without restoring competitiveness it would be difficult to direct capacities from this sector toward the tradable sector. Third, in fixed-exchange-rate countries a wide gap has opened (relative to the euro area) between GDP per capita and price levels (Darvas, 2009a). In other words, the actual exchange rate compared to the purchasing power parity exchange rate, adjusted by the Balassa-Samuelson effect, has become highly overvalued. In order to provide a historical, cross- country overview of the behaviour of the price level after large drops in GDP, I have examined all episodes among 182 countries of the world between 1950 and 2007 in which per capita GDP has fallen by at least 10 percent within a two-year period compared to the weighted average of 22 industrialized countries. I have selected countries with relative GDP per capita levels between 20 and 100 percent in the starting year and excluded transition economies and oil-exporting countries.
Figure 6 indicates that such episodes tend to be followed by price-level drops. On average, price levels fell somewhat sluggishly, but five years after the onset of the depression, the price level decline (19 percent) almost equalled the decline in GDP per capita (18 percent).16 In most cases, price level declines relative to the industrialized countries was the consequence of nominal exchange rate depreciation, because prices and wages tend to be rigid downward.
Table 3: Output gap and unemployment rate (percent), 2007 and 2010
Output gap Unemployment rate
2007 2010 2007 2010
Latvia 14.6 -9.6 6.0 19.3
Estonia 11.5 -8.5 4.7 17.5
Lithuania 9.7 -7.1 4.3 17.8
Bulgaria 4.0 -4.8 6.9 9.8
Hungary 3.1 -4.2 7.4 11.1
Romania 8.3 -4.1 6.4 7.5
Slovenia 6.4 -3.8 4.9 7.2
Czech Republic 6.3 -2.1 5.3 7.3
Poland 3.0 -1.3 9.6 9.5
Slovakia 5.9 -1.2 11.1 14.5
Euro Area 2.2 -2.9 7.5 10.1
United Kingdom 2.3 -5.0 5.3 7.8
United States 1.5 -2.3 4.6 9.6
Note: Countries are ordered according to their 2010 output gap. The output gap measures the difference between actual and potential GDP. The unemployment rate measures the ratio of people seeking jobs to the labour force.
Source: European Commission, 2010 and author calculations.
I therefore argue that price and wage competitiveness needs to be improved in fixed exchange rate countries. Recently, unit labour costs have stated to fall in some of these countries, such as Estonia (Figure 5). However, most of the recent correction is due to layoffs that have resulted in very high
16 Both figures are relative to the weighted average of 22 industrialized countries.
unemployment, with significant social consequences, including emigration. It would have been much preferable to have a larger adjustment in nominal wages and a smaller adjustment in employment.
But because fixed-exchange-rate countries decided to maintain their exchange rate peg, non-price competitiveness factors will have a large role in the future. The section that follows assesses some of these factors.
Figure 5: Unit labour costs (2000Q1=100), 2000Q1-2010Q2
80 120 160 200 240 280 320
80 120 160 200 240 280 320
00 02 04 06 08 10
Bulgaria
200 180 160 140 120 100 80
200 180 160 140 120 100 00 02 04 06 08 1080
Czech Republic 300
250 200 150
100
300 250 200 150
100
00 02 04 06 08 10
Estonia
240 200
160
120
240 200
160
120
00 02 04 06 08 10
Hungary 450
350 300 250 200 150 100
450 350 300 250 200 150 100
00 02 04 06 08 10
Latvia
240 200 160 120
80
240 200 160 120
80
00 02 04 06 08 10
Lithuania
160 140 120 100
80
160 140 120 100
80
00 02 04 06 08 10
Poland 600500
400 300 200
100
600 500 400 300 200
100
00 02 04 06 08 10
Romania 240
200 160 120
80
240 200 160 120
80
00 02 04 06 08 10
Total economy Manufacturing (D)
Construction (F) Trade, transport and communication (G_I) Financial and business services (J_K)
Slovakia
220 200 180 160 140 120 100
220 200 180 160 140 120 00 02 04 06 08 10100
Slovenia
130 120 110 100 90 80
130 120 110 100 90 00 02 04 06 08 1080
Germany
200 180 160 140 120 100 80
200 180 160 140 120 100 80
00 02 04 06 08 10
Ireland
Source: OECD, n.d.
Figure 6: GDP per capita and price levels after big drops in GDP (compared to the weighted average 22 industrialized countries)
GDP per capita at PPP
15 20 25 30 35 40 45 50 55
t-3 t-2 t-1 t t+1 t+2 t+3 t+4 t+5
Price Level
35 40 45 50 55 60 65 70
t-3 t-2 t-1 t t+1 t+2 t+3 t+4 t+5
Note: The data encompass 43 episodes in 35 countries between 1950 and 2007 in which GDP per capita at PPP declined by at least 10 percent over a two-year period compared to the weighted average of 22 industrialized countries. Country- specific weights were derived from Bayoumi et al. (2006). The solid line with circular symbols shows the mean of the 43 episodes, while the two dashed lines indicate the interquartile range (i.e., the middle 50 percent of the distribution). Time
“t” is the year that precedes the drop in GDP.
Source: Author’s calculations based on data reported in IMF (2010b) and World Bank (2010).
4. Framework conditions for growth
Table 4 presents some selected structural indicators that have a bearing on non-price competitiveness and are important in assessing medium-term growth prospects. The first three columns include indicators that are relevant measures of the business climate. Estonia ranks the highest among new EU member states considering all three indicators, and the gap relative to the EU-15 average is reasonable. Slovenia, Latvia, and Lithuania do well in at least one indicator, but have more significant gaps in at least another one. All other CEE-10 countries still have a long way to go to improve their business climate, yet their peers in Asia and Latin America, on average, do not have much better scores.
Table 4: Some structural indicators of CEE-10 countries
(1) (2) (3) (4) (5) (6) (7) (8) (9) (10)
Quality of institutions (scale: from 1 to 7)
Corruption perception (scale: from
1 to 10)
Ease of doing business rank 2009, (out of 183)
Infrastructur e (scale:
from 1 to 7)
Markets (scale: from
1 to 7)
Employment rate (above
age 15), 2009 (percent)
Quality of the educational
system (scale: from
1 to 7)
Technology access (scale: from
1 to 7)
Absorptive capacity (scale: from
1 to 7)
Creative capacity (scale: from
1 to 7)
Bulgaria 3.3 3.8 44.0 2.8 4.5 49.4 3.3 3.8 3.3 3.2
Czech Republic 3.9 4.9 74.0 4.1 5.3 54.8 4.7 4.9 4.3 4.1
Estonia 4.9 6.6 24.0 4.4 5.1 52.5 4.5 5.4 4.5 4.4
Hungary 3.9 5.1 47.0 3.9 5.1 45.1 3.2 4.7 3.9 4.1
Latvia 4.1 4.5 27.0 3.8 4.9 50.4 3.7 4.3 4.2 3.6
Lithuania 4.2 4.9 26.0 4.2 4.8 49.8 3.7 4.7 4.2 4.0
Poland 3.6 5.0 72.0 2.8 4.8 50.4 3.8 4.4 4.1 3.7
Romania 3.6 3.8 55.0 2.6 4.7 50.7 3.6 4.1 3.8 3.5
Slovakia 3.9 4.5 42.0 3.6 5.3 51.8 3.4 4.9 3.8 3.7
Slovenia 4.4 6.6 53.0 4.5 4.9 56.0 4.4 4.7 4.7 4.4
CEE-10 4.0 5.0 46.4 3.7 4.9 51.1 3.8 4.6 4.1 3.9
Asia-6 4.3 4.0 61.0 4.5 5.0 51.2 4.4 4.6 4.3 4.3
Latam-8 3.7 4.1 86.5 3.2 4.5 55.2 3.0 3.9 3.5 3.3
EU-15 5.3 7.3 36.6 5.4 5.4 55.5 4.8 5.4 4.8 4.8
USA 4.9 7.5 4.0 6.1 5.9 59.3 5.0 5.7 5.4 5.8
Note: The higher the better for all indicators except the Ease of doing business rank, for which the lower the better.
Source: Updated from Darvas (2010b).
Other important framework conditions for growth are macroeconomic stability, the quality of
infrastructure, and the functioning of markets. The crucial importance of macroeconomic stability has been demonstrated, both in the pre-crisis period and during the crisis: those countries generally suffering the most during the crisis had pre-crisis imbalances, such as higher inflation and large current account deficits.
The fourth data column of Table 4 contains an indicator for the quality of infrastructure. The gap relative to the EU-15 and United States is apparent for all EU-10 countries, which also lag behind the Asian countries. The three best CEE-10 countries are Slovenia, Estonia, and Lithuania, whereas those with the lowest relative scores are Romania, Poland, and Bulgaria. Better absorption of EU structural funds can improve, inter alia, the quality of infrastructure.17
The fifth data column of Table 4 presents an indicator summarizing the functioning of markets for goods, services, labour, and money, suggesting that the gap between the CEE-10 and the EU-15 is not as wide as is the case of institutions or infrastructure. The Czech Republic, Slovakia, Estonia, and Hungary are the frontrunners within the CEE-10. Yet there is still room for improvement, especially relative to the United States and the best performers within the EU-15.
The sixth and seventh data columns provide a quantity and quality measures related to the labour force: the employment rate and a quality index of the educational system. The Czech Republic, Estonia, and Slovenia score reasonably well on both indicators, as their gap relative to the EU-15 average is fairly small. However, in other CEE-10 countries both labour utilization and the quality of education require strong improvement, which would provide obvious ways to increase potential output. Because the population of the CEE-10 countries is rapidly aging, proper migration policies should also be developed in due course. Latin America records worse scores than the CEE-10, but Asia is well ahead.
Finally, because total factor productivity (TFP) growth should be the key component of the CEE-10 drive to “catch-up” economically, and innovation has been a key driver of TFP growth in the past, we briefly examine whether innovation can be expected to drive growth in the CEE-10 in the future (based on Veugelers, 2011). The main conclusion is that this role is unlikely. Innovation plays different roles in countries with different levels of development: in less developed countries technology adoption is more important than innovation activity. The indexes of technology access, absorptive capacity, and creative capacity are included in the final three columns of Table 4. On technology access, Estonia outperforms the EU-15 average, and the Czech Republic and Slovakia also score reasonably well. The scores are generally lower for absorptive capacity for all CEE-10 countries, although Slovenia and Estonia perform well. Lack of proper absorptive capacity may limit the effectiveness of a growth strategy based on technology purchases (followed by many CEE-10 countries), and indeed improving this capacity will be crucial for growth. The creative capacity prerequisite represents the biggest gap for CEE-10 to bridge, but this is commensurate with their position relative to the technology frontier; improvement of absorptive capacities would thus be more important
17 For an assessment of EU funds absorption, see Holda (2010). See Varga and in’t Veld (2010) for a model-based assessment of the macroeconomic impact of structural funds spending, which indicates long-term output gains due to productivity improvements.
5. Concluding remarks
The global financial and economic crisis hit most Central and Eastern European countries harder than other countries in the world, and post-crisis recovery has also been generally slower than in other emerging economies. In this paper, I have assessed the pre-crisis development model of the region and discussed exchange rate policy issues and some structural features of the CEE countries.
While the region’s development model had many unique features compared to other emerging countries in Asia and Latin America, the CEE region itself can broadly be divided into two distinct pre-crisis trajectories. In one group of countries, the collapse of the communist system was followed by rapid reindustrialization and consequently superb export performance and reasonable macroeconomic stability. In the second group, the tradable sector could not strengthen sufficiently, and economic “catch-up” was accompanied by unsustainable growth bubbles. These countries’
economies had become highly vulnerable by the onset of the global financial and economic crisis.
What factors are responsible for these diverging developments? Fiscal policy was less of a cause, even though most countries followed pro-cyclical policies before the crisis. In many countries, expenditures grew very rapidly, driven by a demand boom–fuelled revenue surge (Darvas, 2010a).
Domestic financial regulation and supervision may not have been sufficiently cautious before the crisis, but in any event there is little room for domestic regulatory measures in a financially integrated environment such as the EU (Becker et al., 2010). However, exchange rate policy was of crucial importance, and therefore its role was analysed in greater detail.
Clearly, the exchange-rate regime choice in itself is not a panacea, because one can find both positive and negative examples in both the fixed- and flexible-exchange-rate groups. But both the pre-crisis period and the crisis have shown that it is more difficult to catch up economically when the exchange rate is fixed.
Cross-border financial flows resulted in an accumulation of vulnerabilities that greatly influenced the cost of the crisis in countries with all kinds of exchange rate regimes. But these flows and associated imbalances were more pronounced in countries with fixed exchange rates. On average, fixed- exchange-rate countries tended to experience higher current account imbalances and external debt, the share of loans was larger and the share of FDI lower in total capital inflows, the composition of FDI inflows was biased in favour of finance- and real estate-related activities, credit growth was more rapid, inflation was higher, unit labour costs rose faster, and real interest rates were lower than in floating-exchange-rate countries. These characteristics and vulnerabilities have contributed to sharper contractions in real growth and a larger rise in unemployment during the crisis in fixed- exchange-rate countries.
The key reason underlying these divergent developments between fixed- and floating exchange-rate countries is most likely related to the price level catch-up process, which accompanies economic catch-up. When price level catch-up translates into higher inflation because of the fixity of the exchange rate,18 such higher inflation can lead to lower real interest rates, which can fuel unsustainable credit booms and distort the allocation of capital and labour. This can lead to a vicious circle, leading to excess inflation. The importance of low inflation is underscored by the fact that the three floating-exchange-rate countries in CEE that had higher inflation rates before the crisis than other floaters (Hungary, Romania, and Serbia) had to rely on IMF/EU emergency financing during
18 As opposed to the case in floating-exchange-rate countries, where price level catch-up can potentially be accom- modated by nominal exchange-rate appreciation as well.
the crisis.
Current-account deficits, especially in the Baltic and Balkan countries, have suddenly corrected and inflation has decreased everywhere in response to the crisis, as capital inflows have stopped or even reversed. But the large stock of private debt and the weak competitive position of several fixed- exchange-rate countries will act as a drag on economic growth. Fixed-exchange-rate countries in the region are trying to improve their competitiveness through an “internal devaluation” (i.e., thorough domestic price and wage cuts). While public-sector wages have been cut considerably in some countries, thus far the pace of adjustment in the private sector is considerably slower.
Because the improvement in price competitiveness has been slow, other aspects of competitiveness need to be improved. For this reason selected structural indicators of the CEE economies were noted in this paper. While Estonia, the Czech Republic, and Slovenia rank reasonably well in indicators related to the business environment, the quality of the educational system, and technology access and absorptive capacity, other CEE countries require significant improvements. Medium-term economic growth will largely depend on various dimensions of competitiveness, even though all CEE countries are expected to grow to some extent in the coming years due to the correction of negative output gaps.
The analysis offers some key lessons. First, fixing the exchange rate too early in the catch-up phase carries the risk that a country’s economy is stuck with an overvalued exchange rate and large stock of private debt risk, a combination that is difficult to manage.
Second, as initial conditions differ, a “one-size-fits-all” strategy is not viable, and there is certainly a case for a dual-track approach. Countries with a floating-exchange-rate regime with credible policy frameworks should not rush to peg to the euro. However, for countries already pegged to the euro, neither having the euro as a currency nor an independent monetary policy is often the worst of both worlds. Therefore, the EU should offer to all potential applicants better terms for euro membership, on the condition that: (a) their current exchange rate is not overvalued; (b) they have put in place supervisory arrangements that are conducive to financial stability; and (c) they are sufficiently flexible to thrive within the euro area. When this is not the case, the EU should initiate discussions with domestic policymakers on altering the exchange-rate regime.
Third, the euro area entry criteria need to be overhauled.19 A good solution would be to relate all numerical criteria to the average of the euro area and simultaneously extend the compliance period from the currently considered one year to two or three, which would also entail a better consideration of optimum currency area criteria. More emphasis should be placed on the assessment of current account sustainability as well, which in any event is required by the Treaty on the Functioning of the European Union to be part of the convergence assessment.
Fourth, a strong case can be made for EU surveillance. Experience both inside and outside the euro area suggests that governments are not able to recognize unsustainable private-sector bubbles, and after these bubbles burst, it is extremely difficult to regain competitiveness through structural reforms. Also, fiscal vulnerability often arises from implicit liabilities of the financial sector, and for this reason fiscal sustainability assessments should also consider private-sector fragility.
Fifth, the EU should equip itself with better crisis management tools. These include a recognition of the regional responsibilities of the European Central Bank (e.g., see Darvas and Pisani-Ferry, 2008;
19 For a detailed analysis of both the economic and legal aspects of the reform of entry criteria, see Darvas (2010b).
Darvas, 2009b).
Finally, the main emphasis of the reoriented growth model of the region should focus on the tradable sector (Becker et al., 2010; Darvas, 2010a) and improvements in structural framework conditions of growth. Even the best-performing countries, such as Poland, have serious structural weaknesses that should be addressed. Improvements in structural conditions are even more necessary in those fixed- exchange-rate countries that are stuck with overvalued exchange rates.
References
Abiad, Abdul, Daniel Leigh, and Ashoka Mody (2009), “Financial Integration, Capital Mobility, and Income Convergence,” Economic Policy, 241–305, April.
Ahearne, Alan, Juan Delgado, and Jakob von Weizsäcker (2008), A Tail of Two Countries.
Brussels, Belgium: Bruegel Policy Brief 2008/4, 2008.
Åslund, Anders (2009), “Ukraine’s Financial Crisis, 2009,” Eurasian Geography and Economics, 50, 4:371–386, 2009.
Åslund, Anders (2010), The Last Shall Be the First: The East European Financial Crisis.
Washington, DC: Peterson Institute for International Economics.
Åslund, Anders (2011), “Exchange Rate Policy and the East European Financial Crisis,” Eurasian Geography and Economics, 52, 3:375–389.
Bayoumi, Tamim, Jaewoo Lee, and Sarma Jayanthi (2006), “New Rates from New Weights,”
IMF Staff Papers, 53, 2:272–305.
Becker, Torbjörn, Daniel Daianu, Zsolt Darvas, Vladimir Gligorov, Michael A. Landesmann, Pavle Petrović, Jean Pisani-Ferry, Dariusz K. Rosati, André Sapir, and Beatrice Weder di Mauro (2010), Whither Growth in Central and Eastern Europe? Policy Lessons for an Integrated Europe. Brussels, Belgium: Bruegel Blueprint, Volume XI.
Bulgaria National Statistics, website, n.d. [http://www.nsi.bg/otrasalen.php?otr=51], last accessed February 3, 2011.
Darvas, Zsolt (2009a), The Baltic Challenge and Euro Area Entry. Brussels, Belgium: Bruegel Policy Contribution 2009/13.
Darvas, Zsolt (2009b), The EU’s Role in Supporting Crisis-Hit Countries in Central and Eastern Europe. Bruegel Policy Contribution 2009/17.
Darvas, Zsolt (2010a), “Global Financial Crisis and Growth Prospects,” in EU10 Regular Economic Report (World Bank), 35–48, July.
Darvas, Zsolt (2010b), ‘The Case for Reforming Euro Area Entry Criteria,” Society and Economy, 32, 2: 195– 219.
Darvas, Zsolt (2010c), “The Impact of the Crisis on Budget Policy in Central and Eastern Europe,”
OECD Journal on Budgeting, 10, 1:45–86.
Darvas, Zsolt (2011), “Beyond the Crisis: Prospects for Emerging Europe,” Comparative Economic Studies, 53:2, 261-290.
Darvas, Zsolt and Jean Pisani-Ferry (2008), Avoiding a New European Divide. Brussels, Belgium:
Bruegel Policy Brief 2008/10.