Complexes of pyridoxal thiosemicarbazones formed with vanadium(IV/V) and copper(II): solution equilibrium and structure
Tamás Jakuscha*, Károly Kozmaa, Éva A. Enyedya, Nóra V. Mayb, Alexander Rollerc, Christian R. Kowolc,d, Bernhard K. Kepplerc,d, Tamás Kissa,e*
a Department of Inorganic and Analytical Chemistry, University of Szeged, Dóm tér 7, H-6720 Szeged, Hungary
b Research Centre for Natural Sciences, Hungarian Academy of Sciences, Magyar Tudósok körútja 2., H-1117 Budapest, Hungary
c Institute of Inorganic Chemistry, Faculty of Chemistry, University of Vienna, Waehringer Str. 42, A-1090 Vienna, Austria
d Research Cluster “Translational Cancer Therapy Research” University of Vienna, Waehringer Str. 42, A-1090 Vienna, Austria
e MTA-SZTE Bioinorganic Chemistry Research Group, University of Szeged, Dóm tér 7, H-6720 Szeged, Hungary
Dedicated to Prof. Imre Sóvágó on the occasion of His 70th birthday
Keywords: Stability Constants; X-ray Crystal Structure; Thiosemicarbazone, Pyridoxal, Vanadium, Copper
* Corresponding authors: Fax: +36 62 420505
E-mail addresses: tkiss@chem.u-szeged.hu (T. Kiss), jakusch@chem.u-szeged.hu (T.
Jakusch)
ABSTRACT
The stoichiometry and thermodynamic stability of vanadiumIV/V and copperII complexes of pyridoxal thiosemicarbazone and pyridoxal-N3,N3-dimethylthiosemicarbazone have been determined by pH-potentiometry (VIVO), EPR (VIVO/CuII), UV-Vis (CuII, VIVO and VV) and
51V-NMR spectroscopy (VV) in 30% (w/w) dimethyl sulfoxide/water solvent mixture. In all cases, mono-ligand complexes are formed in different protonation states. In addition, the proton-dissociation constants of the ligands were also determined by pH-potentiometry, UV- Vis and 1H-NMR spectroscopy. The solid state structures of the monoprotonated forms (VVO2(L1H)×0.8H2O and VVO2(L2H)×0.8H2O) of the VV complexes were characterized by single-crystal X-ray diffraction analysis. The mono-ligand complexes of CuII and VV are dominant at physiological pH. With all investigated metal ions the pyridoxal moiety of the ligand causes an extra deprotonation step between pH 4 and 7 due to the non-coordinating pyridine-NH+. The pyridoxal-containing ligands form somewhat more stable complexes with both VIVO and CuII ions than the reference compound salicylaldehyde thiosemicarbazone.
Dimethylation of the terminal amino group resulted in the formation of VV and CuII complexes with even higher stability.
1. Introduction
Thiosemicarbazones (TSCs) and their metal complexes are highly interesting scaffolds as they exhibit a wide range of pharmacologically important properties like anticancer, antibacterial, antiparasitic, and antiviral effects [1]. TSCs are hydrazones obtained by condensation of a thiosemicarbazide with an aldehyde or a ketone. When a coordinating functional group is additionally present in the proper position of the aldehyde/ketone the TSCs are able to coordinate in a tridentate way. The most prominent representative of this family is the α(N)-heterocyclic Triapine (3-aminopyridine-2-carbaldehyde thiosemicarbazone) that has demonstrated promising activity mainly in hematological malignancies [2-4]. The stability of the metal complexes formed with the TSCs strongly depends on the character of the metal ion, the additional functional group and the position and type of the substituents at the TSC backbone [5,6]. The presence of a phenolic OH group at a chelatable position, like in salicylaldehyde thiosemicarbazone (STSC), might provide a different and more favourable coordination for harder metal ions preferring oxygen donor atoms like Fe(III), Ga(III) etc. Notably, numerous metal complexes of STSC and its
derivatives were prepared and tested in vitro on various cancer and tuberculosis cell lines, as well as parasites and pathogenic bacteria [7-9].
Scheme 1. Chemical structures of the thiosemicarbazones investigated in this study.
Interesting derivatives of STSC can be synthesized using the B6 vitamin related pyridoxal (3-hydroxy-5-(hydroxymethyl)-2-methylpyridine-4-carbaldehyde) instead of salicylaldehyde. Complexes of pyridoxal thiosemicarbazone (PxTSC, Scheme 1) or its derivatives were already prepared with a wide range of metal ions such as divalent and trivalent 3d metal ions, e.g. ZnII/CuII/NiII [10-12] or FeIII/CrIII [13,14], dioxido cations like UVIO2/MoVIO2/VVO2 [15-17], the platinum group metal ions PdII/RuII [18-19] and organometallic ions (e.g. dimethyl-SnIV) [20]. In these complexes the PxTSC or its derivatives coordinate in a tridentate mode (except a few cases e.g. AuIII [21] or dimethyl-TlIII [22] with bidentate coordination). The exact composition of the complexes depends on the coordination properties of the metal ion. Bis-ligand complexes are formed with e.g. FeIII [23], CoIII [24]
and NiII [25], when an octahedral coordination mode is preferred. In case of CuII mainly mono-ligand complexes were described [11,26,27] sometimes in dimerized form [13]. The PxTSC and derivatives are usually coordinated in these complexes in their zwitterionic (H2L with O–,N,S coordination) or in their anionic (HL– with O–,N,S– coordination) forms (Scheme 2). It means that the phenolate is always deprotonated and coordinated, the pyridoxal-N atom is protonated, but the protonation state of the hydrazinic N2H depends on the actual conditions. To our knowledge, there are only two exceptions: [Ni(LH)2]×2H2O [25] and [Cu(LH)MeOH]Cl [26] complexes (LH2 = PxTSC) in which the pyridoxal-N is deprotonated while the hydrazinic N2H is still protonated.
The biological activity of various PxTSC-based compounds including metal complexes was investigated [13,26-30], however, most of these studies are focused on the cytotoxic activity of CuII complexes. A recent study demonstrated the promising cytotoxic activity of CuII complexes of PxTSC and its two N-terminally methyl/phenyl monosubstituted derivatives against human cervical (HeLa), human breast (MCF-7) and human liver carcinoma (Hep G2) cancer cell lines without affecting the noncancerous NIH 3T3 mouse
N1
N2 N3H2 N4 OH S
OH
PxTSC = L1H2 PxTSCm = L2H2 H
N1
N2 N3 N4 OH S
OH
H
embryonic fibroblast cells [26]. These complexes were found to bind to DNA via partial intercalation or groove binding, and induced apoptosis which involved reactive oxygen species generation [26]. Belicchi Ferrari et al. reported on monomeric [Cu(LH2)(OH2)Cl]Cl and dinuclear [(Cu(LH)(OH2))2]Cl2×2H2O) complexes of PxTSC possessing inductive effect on erythroleukemia cell erythroid differentiation, although in both cases the monomeric forms were assumed to be the active species [27]. Also the dimeric CuII complex of the N-terminally dimethylated derivative of PxTSC (pyridoxal-N3,N3-dimethylthiosemicarbazone, PxTSCm = L2H2) were investigated and its behaviour was evaluated on U937, CEM and K562 human cancer cell lines exhibiting, however, only weak proliferation inhibition [13].
Furthermore, also the antiamoebic activity of VVO2 complexes of PxTSC and some derivatives was tested against HM1:1MSS strains of Entamoeba histolytica. The most promising compound could efficiently inhibit the growth of this parasitic amoebozoa (IC50 = 0.5 μM) [30]. Additionally, it should be noted that some of the metal complexes of PxTSC have interesting catalytic activity as well [18,19,31-33].
Notably, also the related compound class of pyridoxal isonicotinoyl hydrazones (PIH) show pronounced antitumor activity due to their efficient iron chelation ability and a series of thiosemicarbazone-based compounds related to PIH have been also described as potent antiproliferative agents [29].
Despite of the numerous reports on the synthesis, solid state characterization and biological activity tests of various pyridoxal thiosemicarbazone metal complexes, there is no information available on the species present in aqueous solution at physiological pH and their thermodynamic stability. Complex formation processes and solution stabilities of complexes of the reference compound salicylaldehyde thiosemicarbazone (STSC) with various metal ions ZnII, CuII, FeII,III, GaIII [34], VIVO and VV [35] have been already recently described in detail by our group. These data indicated that in some cases (e.g. VIVO) the stability of the STSC complexes was not high enough to hinder the complex decomposition at physiological pH. Consequently, herein we investigated the effect of the replacement of the salicylaldehyde moiety to pyridoxal on the solution speciation of the complexes formed with copper(II) and vanadium(IV/V) ions expecting an increased stability. For this reason detailed solution equilibrium studies were performed on the CuII, VIVO and VV complexes formed with PxTSC and its N3-terminally dimethylated derivative PxTSCm by means of pH-potentiometry and UV-Vis-, EPR- and 51V-NMR-spectroscopies.
2. Experimental
2.1. Chemicals
All solvents used for the synthesis were of analytical grade and used without further purification. Pyridoxal hydrochloride (Fluka), thiosemicarbazide (Fluka), 4,4-dimethyl-3- thiosemicarbazide (Fluka), NaVO3, VIVOSO4, KOH, D2O and DMSO-d6 were purchased from Sigma-Aldrich and CuCl2 from Reanal,KCl, HCl and DMSO from Molar Chemicals.
The VIVO stock solution was prepared as described [36] and standardized for the metal ion concentration by permanganate titration. Vanadate stock solution was prepared by dissolving V2O5 in KOH solution and its concentration was calculated based on its mass and the total volume. CuCl2 was dissolved in water in order to get the CuII stock solution and its concentration was determined by complexometry via the EDTA complex. Double distilled Milli-Q water was used for sample preparations. All the solutions were prepared that the DMSO content was 30% (w/w), except in the NMR samples, where DMSO 30% (v/v) H2O 60% (v/v) and D2O 10% (v/v) were applied.
The purity and aqueous phase stability of the studied ligands was verified and the exact concentration of their stock solutions together with the proton dissociation constants were determined by pH-potentiometric titrations with the aid of the computer program pHCali [37].
2.2. Synthesis of the ligands and their VV- complexes
The ligands (PxTSC, PxTSCm) were synthesized based on literature methods [38,28]
and slightly modified. In both cases the aldehyde group of the pyridoxal reacts with the hydrazine moiety of the given thiosemicarbazone. However, before the condensation reaction the hydrochloride form of the pyridoxal should be neutralized. In our case KOH was used for that process and the neutral form of the pyridoxal precipitated from the aqueous solution. This solid was filtered off, dried and used for further processes.
The PxTSC was synthesized based on Ref. [38]. 0.56 g of thiosemicarbazide (6.14 mmol) in 15 mL of ethanol was added to a solution of 1.00 g of neutral pyridoxal (5.98 mmol) in 75 mL of ethanol, and the mixture was refluxed for 2.5 h. After cooling, the obtained yellow powder was filtered, and recrystallized from hot water, and dried in vacuo.
1H-NMR in H2O/D2O 90-10% (v/v) [ppm]: 8.42 (s, 1H), 7.83 (s, 1H), 2.43 (s, 3H). (The signal of the pyridoxal –CH2-OH part could not be observed, because of the water signal saturation.)
The PxTSCm was synthesized based on Ref. [28]. 0.73 g of N3,N3-dimethyl-3- thiosemicarbazide (6.13 mmol) was added to a solution of 1.02 g of neutral pyridoxal (6.10 mmol) in 250 mL of methanol, and the mixture was let to stand at room temperature for 50 min. After evaporation of the solvent the residue was recrystallized from methanol, and dried in vacuo. 1H-NMR in H2O/D2O 90-10% (v/v) [ppm]: 8.64 (s, 1H), 7.90 (s, 1H), 3.26 (s, 6H), 2.47 (s, 3H). (The signal of the pyridoxal –CH2-OH part cannot be observed, because of the water signal saturation.)
X-ray diffraction quality single crystals of [VVO2(L1H)]×1.5H2O×0.15CH3OH (1) and [VVO2(L2H)]×0.8H2O (2) were obtained (PxTSC = L1H2 and PxTSCm = L2H2) by slow evaporation of a mixture of the ligand (1 eq) and [VV2O4(acac)2] [39] (0.5 eq) in MeOH/H2O (2:1 for 1 and 1:1 for 2).
2.3. Crystallographic structure determination
X-ray diffraction measurements were performed on a Bruker X8 APPEXII CCD diffractometer. A single crystal of suitable size was coated with Paratone-N oil, mounted at room temperature on a cryo loop and cooled under a stream of cold N2 maintained by a KRYOFLEX low-temperature apparatus. The crystals of 1 and 2 were positioned at 40 mm from the detector, and 1986/1638 frames were measured, each for 20 s over 1° scan width.
The data were processed using SAINT software [40]. The structures were solved by direct methods and refined by full-matrix least-squares techniques. Non-hydrogen atoms were refined with anisotropic displacement parameters. H atoms were placed at calculated positions and refined as riding atoms in the subsequent least squares model refinements. For 1 a volume of 38.9 Å3 per asymmetric unit was masked. Two different types of disorder could be modeled: one with water, the other one with MeOH, both in the range of 15-20% occupancy.
Disorder was found in 2 for O4 and the protons on O4 and C11 with a distribution of 0.80:0.20. In order to stabilize the anisotropic displacements and the bond length, the bonds were restrained with SADI and DFIX instructions. The following software programs and computer were used: structure solution: SHELXS-97 [41]; refinement: SHELXL-97 [41];
OLEX2 [42], molecular diagrams: ORTEP [43]. Crystal data and structure refinement details for 1 and 2 are given in Table S1.
2.4. pH-potentiometric measurements
The pH-metric measurements for determination of the protonation constants of the ligands and the overall stability constants of the vanadiumIV complexes were carried out at
25.0°C in DMSO : water 30 : 70 (w/w) as solvent and at an ionic strength of 0.10 M (KCl) in order to keep the activity coefficients constant. The same solvent mixture was always used in our previous studies on various TSCs [5,6,34,35,44,45]. The titrations were performed with carbonate-free KOH solution of known concentration (0.10 M). The concentrations of the base and the HCl were determined by pH-potentiometric titrations. An Orion 710A pH-meter equipped with a Metrohm combined electrode (type 6.0234.100) and a Metrohm 665 Dosimat burette were used for the pH-metric measurements. The electrode system was calibrated to the pH = −log[H+] scale in the DMSO/water solvent mixture by means of blank titrations (strong acid vs. strong base; HCl vs. KOH), similarly to the method suggested by Irving et al. [46].
The average water ionization constant, pKw, is 14.52 ± 0.05 in the DMSO/water 30:70 (w/w) solvent at 25°C, which corresponds well to the literature data [47]. The reproducibility of the titration points included in the calculations was within 0.005 pH. The pH-metric titrations were performed in the pH range 2.0 − 12.5. The initial volume of the samples was 25.0 mL.
The ligand concentration was 2 or 1 mM and metal ion-to-ligand ratios of 1:1 − 1:4 were used. The accepted fitting of the titration curves was always less than 0.01 mL (the average difference between the experimental and the calculated titration curves expressed in the volume of the titrant). Samples were deoxygenated by bubbling purified argon through them for ca. 10 min prior to the measurements. In the case of VIVO-containing samples, argon overpressure was used when metal ion solution was added to the samples in tightly closed vessels, which were prior completely deoxygenated by bubbling a stream of purified argon through them for ca. 20 min. Argon was also passed over the solutions during the titrations.
The protonation constants of the ligands were determined with the computer program pHCali [37]. PSEQUAD [48,49] was utilized to establish the stoichiometry of the complexes and to calculate the stability constants (log(MpLqHr)) (MpLqHr) is defined for the general equilibrium pM + qL + rH MpLqHr as (MpLqHr) = [MpLqHr]/[M]p[L]q[H]r, where M denotes the metal ion and L the completely deprotonated form of the ligand. In all calculations exclusively titration data were used from experiments, in which no precipitate was visible in the reaction mixture.
In order to evaluate the solution equilibrium data hydrolysis constants of the studied metal ions are needed, however in such special conditions, as DMSO : water 30:70 (w/w), these constants are not available. In the case of Cu(II), where no free metal ion were observed in the whole pH-range the lack of hydrolysis constants does not mean a problem. In the 51V- NMR spectra only V1 was observed as free “metal ion” and no oligomers (V2/V4/V5/V10)
were detected. The pKa = 9.36 of the H2VO4– were determined from the 51V-NMR chemical shift data [35].
Unfortunately the VIVO ions most probable started to hydrolyse at pH > 4-5. Accurate determination of the stoichiometry and stability constants of VIVO complexes formed parallel with the hydrolysis is a rather hard task in water organic solvent mixtures due to the complicated processes such as slow, non-reversible oligomerisation and partial oxidation of VIVO. Accordingly, pH ranges, where such processes may take place were omitted from the evaluation.
2.5. UV–Vis spectrophotometric measurements
A Hewlett Packard 8452A diode array spectrophotometer was used to record the UV–
Vis spectra in the interval 250–820 nm. The pathlength was 1.0 cm or 2.0 mm. The spectrophotometric titrations were performed on samples of the TSCs alone or with VV, CuII; the concentration of ligand was 0.5 (TSCs alone and TSCs-VV) or 0.1 mM (TSCs alone and TSCs-CuII) and the metal-to-ligand ratios were 1:1, 1:1.5 and 1:2 over the pH range between 2 and 12 at an ionic strength of 0.10 M KCl in 30% (w/w) DMSO/H2O at 25.0 ± 0.1 oC. TSCs, at 2 mM, were titrated with VIVO at pH 4.40. Spectra were also recorded for the CuII – ligand systems at 1:1 metal-to-ligand ratio by preparing individual samples in which KCl was partially or completely replaced by HCl and pH values, varying in the range ca. 0.1–3.0, were calculated from the strong acid content.
Protonation and stability constants and the individual spectra of the species were calculated by the computer program PSEQUAD [48,49].
2.6. 1H- and 51V-NMR measurements
The pH-dependent 1H- and 51V-NMR studies were carried out on a Bruker Avance DRX500 instrument. For the 51V-NMR measurements a spectral window of 760 ppm, a 90◦ pulse angle and an acquisition time of 0.65 s with a relaxation delay of 0.5 s and a pulse width of 7 ms were applied. 4,4-dimethyl-4-silapentane-1-sulfonic acid was used as an internal 1H- NMR standard and VVOCl3 (90% in C6D6) was used as an external 51V-NMR reference.
The TSCs were dissolved in 30% (v/v) DMSO 60% H2O and 10% D2O at 25 oC in a concentration of 1.25 or 2 mM and the VVO2-to-ligand ratios were 1:1 or 1:2. Samples contained 0.10 M KCl. Overall stability or stepwise constants for the complex formation
equilibria were determined with the aid of the computer program PSEQUAD [48,49] on the basis of the integral values and chemical shifts.
2.7. EPR measurements and deconvolution of the spectra
X-band-EPR spectra were recorded with a BRUKER EleXsys E500 spectrometer (microwave frequency 9.5-9.8 GHz, microwave power 10-12 mW, modulation amplitude 5 G, modulation frequency 100 kHz). EPR spectra were recorded on a sample (I = 0.10 M KCl in 30% (w/w) DMSO/H2O) prepared by titration under nitrogen atmosphere. KOH solution was added to the solution to adjust the pH which was measured with a Radiometer PHM240 pH/ion Meter equipped with a Metrohm 6.0234.100 glass electrode. For CuII 1:1 CuII-to- ligand ratio at 0.1 mM ligand concentration were applied, the pH was varied between 2 and 6.
In the case of VIVO 1:1, 1:2 and 1:3 ratio have been measured, the applied ligand concentration were 3.0/2.0/1.33 mM, depending on the solubility properties of the system, the pH was varied from 2 to 8.
For VIVO–ligand systems the isotropic EPR spectra were recorded during a titration, at 25°C, in a circulating system. A Heidolph Pumpdrive 5101 peristaltic pump was used to circulate the solution from the titration pot through a capillary tube into the cavity of the instrument. These spectra were simulated by the ’two-dimensional’ method using the 2D EPR program [50]. The g0, and A0 V (I =7/2) oxovanadium(IV) hyperfine coupling parameters were taken into account to describe each component curve. The relaxation parameters, α, β, and γ, defined the line widths through the equation σMI=α+βMI+γMI2
, where MI denotes the magnetic quantum number of the paramagnetic metal ions.
For the frozen solution measurements (CuII/VIVO) 0.1 mL of sample was taken out of the solution at various pH values and was measured individually in a dewar containing liquid nitrogen (at 77 K). 0.02 mL of methanol was added to the samples to avoid water crystallization. The anisotropic spectra were analyzed individually with the EPR program [51], which gives for CuII the anisotropic EPR parameters gx, gy, gz (rhombic g-tensor), AxCu
, AyCu
, AzCu
(rhombic copper hyperfine tensor) and AxN
, AyN
, AzN
(rhombic nitrogen superhyperfine tensor) and the orientation dependent line width parameters. All tensors were supposed as coaxial. For the VIVO complexes gǀǀ, g axial g-tensor and Aǀǀ, A axial hyperfine tensor were taken into consideration. In the case of CuII only the complexes of PxTSC were studied due to solubility problems with the other ligand.
Since a natural CuCl2 was used for the measurements, the spectra were calculated as the sum of the spectra of 63Cu and 65Cu weighted by their natural abundances. The quality of fit was characterized by the noise-corrected regression parameter Rj as above. The details of the statistical analysis were published previously [51]. The copper, vanadium and nitrogen coupling constants and the relaxation parameters were obtained in field units (Gauss = 10−4 T), the first two were converted to energy related units (10−4 cm-1).
3. Results and discussion
3.1. X-ray structure of the vanadate complexes
The results of single crystal X-ray diffraction studies on complexes [VVO2(L1H)]×0.8H2O (1) and [VVO2(L2H)]×0.8H2O (2) are shown in Figs. 1 and 2 (selected bond distances and angles are quoted in the legends of the Figs). For both vanadium(V) complexes the coordination polyhedron around the metal ion is intermediate between square- pyramidal and trigonal-bipyramidal with τ = 0.26 for 1 and τ = 0.20 for 2, respectively (τ = 1 for an ideal trigonal bipyramid, τ = 0 for an ideal square pyramid) [52]. The vanadium atom is coordinated by one tridentate thiosemicarbazone ligand via the phenolate oxygen atom, the nitrogen and sulfur donors of the thiosemicarbazide moiety and two oxido ligands with bond lengths in the expected range for such type of complexes [53,54].
In both crystal structures the thioamide NH is deprotonated accompanied with a distinct elongation of the C7–S bond [1: 1.7352(17); 2: 1.747(2) Å] compared to the metal-free ligand (1.70(2) Å) [55] indicating an increased single-bond character. Concomitantly the C7–N2 bond in Å decreases from 1.35(1) to 1.321(2) in 1 and 1.327(3) in 2, respectively.
Fig. 1. ORTEP plot of [VVO2(L1H)]×0.8H2O (1) with thermal ellipsoids depicted at 50%
probability level (the solvent molecules are omitted). Selected bond distances (Å) and angles (deg): V–O1, 1.9053(12); V–O2, 1.6190(13); V–O3, 1.6432(12); V–S1, 2.3471(5); V–N1, 2.2148(14); S1–C7, 1.7352(17); C7–N2, 1.321(2); N2–N1, 1.3764(19); N1–C6, 1.296(2);
O1–V–S, 137.84(4); O2–V–O3, 108.59(7), O2–V–N1, 97.08(6); O3–V–N1, 153.23(6).
The pyridine nitrogen of the pyridoxal moiety is protonated in both X-ray crystal structures in accordance with the data of the metal-free ligand [55]. This leads to a zwitterionic ligand structure with one positively charged pyridinium nitrogen and the negatively charged deprotonated phenolic oxygen and thiolate sulfur atom, generating together with the vanadium(V) ion neutral metal complexes. In contrast, vanadium(V) complexes with the closely related STSC ligands in the thiolate form are usually positively charged [53,54].
Fig. 2. ORTEP plot of [VVO2(L2H)]×0.8H2O (2) with thermal ellipsoids depicted at 50%
probability level (the water molecule is omitted). Selected bond distances (Å) and angles (deg): V–O1, 1.8935(17); V–O2, 1.6125(17); V–O3, 1.6644(17); V–S1, 2.3429(7); V–N1, 2.204(2); S1–C7, 1.747(2); C7–N2, 1.327(3); N2–N1, 1.372(3); N1–C6, 1.304(3); O1–V–S, 142.12(6); O2–V–O3, 107.17(9), O2–V–N1, 97.80(8); O3–V–N1, 153.94(8).
3.2. Proton dissociation processes of the ligands
Proton dissociation processes of the ligands (Scheme 2) were followed by pH- potentiometry, UV–Vis spectrophotometry and 1H-NMR titrations (Fig. S2-S5).
Measurements were performed in a 30% (w/w) DMSO/H2O solvent mixture. The presence of DMSO was required by reason of the limited water solubility of the ligands and their metal complexes. Consecutive titrations of both ligands showed that no decomposition occurred in the pH range studied under argon atmosphere.
Scheme 2. Proton dissociation equilibria, pKa values and tautomerism of the ligands studied.
Three proton dissociation constants could be determined by various methods (Table S2) and constants obtained are in reasonably good agreement. pK1 and pK2 can likely be attributed to deprotonation of the pyridoxal moieties: ring nitrogen and phenolic OH. Their deprotonation processes are most probably overlapping, although microscopic proton dissociation constants determined for 3-hydroxypyridine suggest that pK2 is associated mainly with the pyridinium nitrogen [56]. pK3 can be related to the proton dissociation of the N2H group of the thiosemicarbazide moiety. The last deprotonation step results in a negative charge which is mainly localized on the S atom via the thione–thiol tautomeric equilibrium.
The calculated molar UV-Vis spectra of the individual species are depicted in Fig. S1.
A half order of magnitude higher pK1 and a slightly lower pK3 was obtained for the N- terminally dimethylated TSC, while pK2 was almost unchanged. It is noteworthy that also in the case of -N-pyridyl TSCs distinct effects of dimethylation on the proton dissociation constants were observed, namely the pKa of the pyridinium nitrogen is increased, while pKa of the azomethine nitrogen is diminished [5]. Comparing the pKa values of PxTSC to the
reference compound STSC it can be concluded that the presence of the pyridoxal nitrogen decreases the pKa values of the OH and N2H moieties [34].
The PxTSC and PxTSCm ligands show Z/E isomerism at basic pH values as a new set of peaks belonging to the aromatic ring protons appears (Fig. S3/S5). The same phenomenon can be observed with the salicylaldehyde semicarbazone ligand (SSC) [45], however does not appear in the case of STSC.
3.3. Solution equilibria of vanadiumV complexes
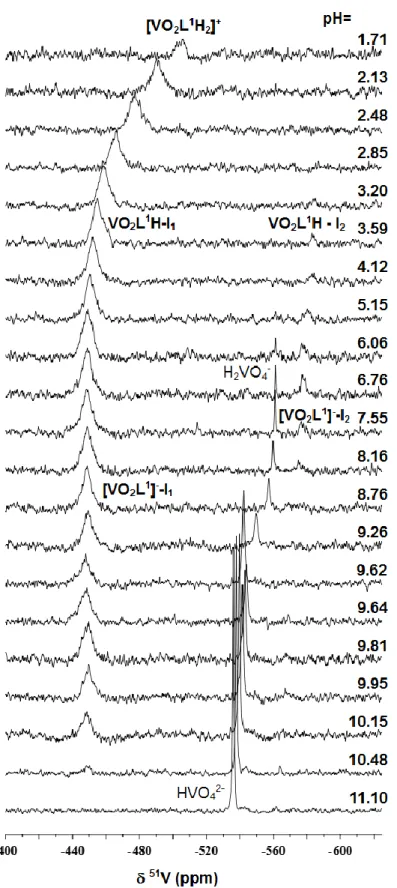
Only one major signal was observed in the 51V-NMR spectra measured for the VV-ligand systems at the pH range from 2 to 12 (Fig. 3 and Fig. S6) that belongs to a given type of complex, and this signal can be observed independently from the ligand excess. The chemical shift of the complex formed is changing in the pH range from 2 to 4 indicating a fast chemical equilibrium, most probable a deprotonation process. At basic pH, at pH ~9 this complex starts to decompose and the signal of the free vanadate (H2VO4–
/HVO42–
) becomes dominant at pH
> 10.
Table 1
51V-NMR chemical sifts (ppm) assigned to complexes formed in the VV–PxTSC and VV– PxTSCm system {T = 25.0°C, I = 0.10 M (KCl) in 30% (v/v) DMSO, 60% (v/v) H2O, 10%
(v/v) D2O} compared with data published earlier.
PxTSC PxTSCm STSC [35] SSC [45]
Composition I1a I2a I1a I2a I1a I2a I1a I2a
[VVO2LH2]+ -521 - -520 - -
VVO2LH -452 -584 -448 - -502
[VVO2L]– -449 -577 -446.5 - -449 -577 -552
[VVO2LH-1]2– -539 -539.5 -575.5
a Isomers
The difference between the two studied VV-ligand systems is marginal; however the complexes formed with the N-terminally dimethylated ligand PxTSCm are somewhat more stable.
Fig. 3. 51V-NMR spectra recorded for the VV–PxTSC system at the indicated pH values {cVV
= 1.0 mM; VV : L = 1 : 1; T = 25.0°C, I = 0.10 M (KCl) in 30% (v/v) DMSO, 60% (v/v) H2O, 10% (v/v) D2O}.
Fig. 4. Absorbance data at three different wavelengths measured in the VV–PxTSC system at various pH values {cVV = 0.48 mM; VV : L = 1 : 1.05; T = 25.0°C, I = 0.10 M (KCl) in 30%
(v/v) DMSO, 70% (v/v) H2O}. The symbols represent the experimental data points, the continuous lines are fitted curves.
Besides these two processes which are easily observable in the 51V-NMR spectra (namely, deprotonation at pH between 1 and 4, decomposition above pH 9) in the UV-Vis spectra one more equilibrium process could be detected at pH between 3 and 6 (Fig 4).
Presumably, this process can be assigned to the deprotonation of the pyridoxal-N, since it has most likely the smallest effect on the 51V-NMR chemical shift of the formed complexes. For both ligands the deprotonation of the N1H moiety of [VVO2LH2]+ results in a similar change ( = 69/72 ppm) in the 51V-NMR chemical shift as the deprotonation of the [VVO2LH]+ complex of STSC ( = 53 ppm, data in Table 1).
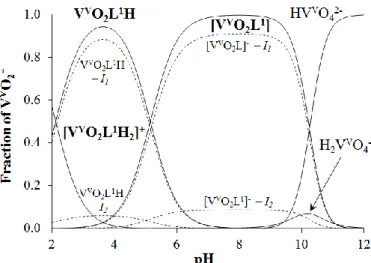
Fig. 5. Concentration distribution curves for the VV–PxTSC system {cVV = 1.0 mM; VV : L = 1 : 2; T = 25.0°C, I = 0.10 M (KCl) in 30% (w/w) DMSO, 70% (w/w) H2O}. (Dashed lines indicate the mole fraction of the isomeric species.)
The overall stability constants (Table 2) were calculated using both the 51V-NMR and UV-Vis titration data; the differences between the results of two methods are not significant (Table S3). As illustration the speciation of the systems studied are depicted in Fig. 5 and Fig.
S7.
Table 2
Overall stability (log) and proton dissociation (pKa) and conditional stability (log’) constants of the H+, VV, VIVO and CuII complexes formed with the ligands PxTSC and PxTSCm {T = 25.0°C, I = 0.10 M (KCl) in 30% (w/w) DMSO, 70% (w/w) H2O}.
PxTSC PxTSCm
log
LH3 23.79(3) 24.19(7)
LH2 19.71(3) 19.69(7)
LH 11.66(3) 11.56(6)
pKa
LH3 4.08(2) 4.50(2)
LH2 8.05(1) 8.13(3)
LH 11.66(3) 11.56(6)
log VVO2 a
VIVO CuII b VVO2a
VIVO CuII b
MLH2 32.93(5) /
25.93 24.03(4) >30.3 33.79(17) /
26.79 24.59(5) >30.3
MLH 30.81(4) /
23.81 21.06(3) >28.0 31.80(17) /
24.80 21.76(3) >27.7
ML 25.66(4)
/18.66 16.67(5) >21.7 26.47(17) /
19.47 16.96(5) >22.0
MLOH - 9.7(3) >10.4 - 9.7(3) >11.8
pKa
MLH2 2.12(6) 2.97(5) 2.35(9) 1.99(6) 2.83(6) 2.59(2)
MLH 5.15(6) 4.30(6) 6.22(9) 5.33(6) 4.80(6) 5.74(2)
ML 7.1(3) 11.32(9) 7.3(3) 10.17(2)
log ’ = pM c
(pH = 7.4) 13.7 12.2 >16.7 14.5 12.4 >17.1
a For VV H2VVO4– (=MH-2) were used as basic species (data before the slash character). For a comparison with the other metal ions the equilibrium constant of the process VO2+
+ 2H2O = H2VO4–
+ 2H+ should be necessary, which is, however, unknown under the applied conditions. An estimation (data after the slash character, M
=VVO2+ ) a value of 7.0 was used, it was measured in water (T = 25.0°C and I = 0.15 M NaCl) [57]
b Only threshold limits for the log value of CuII complexes could be estimated (vide supra)
c Conditional stability constants valid for pH = 7.4. In this case if cM : cL = 1:2, then log ’c = pM
The possible structures of the formed complexes (where M represents the metal ion) are depicted in Scheme 3. Due to the rigid structure of the TSCs only mer coordination is possible in a six coordinated octahedral geometry, which would result in hydroxido coordination trans to an oxido group. However, such a negatively charged donor group trans to the oxygens of VVO2 is energetically unfavoured (trans effect). Consequently complexes with ML(OH) composition were not observed in case of vanadate. The 51V-NMR chemical shifts for the complexes of PxTSC/PxTSCm (VVO2LH / [VVO2L]–) and STSC ([VVO2L]–) are fairly close to each other (–446 to –452 ppm, Table 1), showing very similar coordination environment around the VV centre.
Scheme 3 Possible structures of the complexes formed between M (VVO2 / VIVO / CuII) and PxTSC (R = H) or PxTSCm (R = Me) (in the case of VV the ML(OH) complex is not formed).
For PxTSC in the 51V-NMR spectra a minor species could be observed at pH between 3 and 8.5 attributed to the formation of isomers, existing both in forms of [VVO2LH] and [VVO2L]–. Based on the chemical shift data (Table 1) the minor isomer (in [VVO2L]– form) is identical with the previously detected minor species formed with STSC ([VVO2L]–) and SSC ([VVO2LH-1]–) having most probably a (O,N1,N3) binding mode [35,45]. In these isomers the chalcogen donor atoms (O– or S–) of the (thio)semicarbazone moiety are non-coordinated. The lack of this type of isomer in the case of PxTSCm-VV complexes confirms the suggested binding mode, as the N3 nitrogen due to the presence of the methyl groups is not able to coordinate (Scheme 3).
3.4. Solution equilibria of vanadiumIV complexes
In the presence of VIVO ions slow processes were observed, and the formation of hydroxido or ternary hydroxido complexes and their partial oxidation at pH > 5 hindered the
N N H N
S R R
HN O
OH M
N N N S
R R
HN O
OH M
N N N S
R R
N O
OH M MLH2
MLH
ML
N N N S
R R
N O
OH M
ML(OH) OH
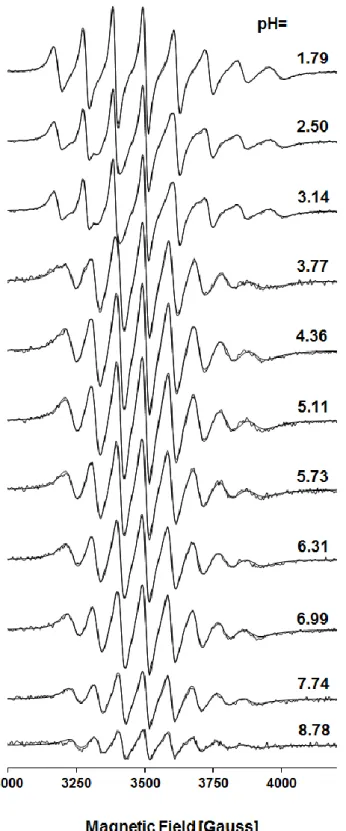
pH-potentiometric titrations or any other quantitative study. Both pH-metric and EPR measurements (Fig. 6, Fig. S8-9) suggest that at pH 2 the VIVO aqua ion dominates, although formation of the complex [VIVOLH2]2+ has already started (Fig. 7 and S10). Two deprotonation processes take place up to pH 5 overlapping somewhat to each other (in case of PxTSCm this overlap is not so strong). The evaluation of the pH-metric titration data suggested the formation of bis-ligand complexes, but detailed UV-Vis spectrophotometric measurements confirmed that it was only an artefact.
Fig. 6. Measured and simulated EPR spectra recorded for the VIVO–PxTSC system at various pH values {cVIVO = 2.8 mM; VIV : L = 1 : 1.1; RT, I = 0.10 M (KCl) in 30% (w/w) DMSO, 70% (w/w) H2O}.
Table 3
EPR parameters of the complexes formed in the VIVO - PxTSC and VIVO- PxTSCm systems {I = 0.10 M (KCl) in 30% (w/w) DMSO, 70% (w/w) H2O}. Unit of the coupling constants (A) is 10-4 cm-1. (See g and A in Table S4.)
PxTSC PxTSCm
goa
Aoa
gb Ab goa
Aoa
gb Ab
[VIVOLH2]2+ 1.965(1) 93.9(1.3) 1.945(1) 165.7(0.2) 1.966(1) 93.2(1.0) 1.945(1) 165.3(0.1) [VIVOLH]+ 1.969(1) 88.8(0.7) c c 1.971(1) 87.2(0.7) c c
[VIVOL] 1.971(1) 87.6(0.7) 1.956(1) 157.9(0.2) 1.972(1) 86.4(1.1) 1.957(1) 157.8(0.5) [VIVOLOH]- 1.972(1) 83.4(1.6) - 1.972(3) 83.1(4) -
a Room temperature.
b In frozen solution.
c Non assignable (see text)
The two consecutive deprotonation processes result in only one main change in the EPR spectra, similarly as in the case of VV (51V-NMR spectra, vide supra). Theoretically, deprotonation of the thiosemicarbazide moiety of the ligand would result in a major change in the spectrum, while that of the pyridoxal part would cause only a minor effect. Thus the spectral change cannot be assigned purely to the first or to the second deprotonation processes: microequilibrium processes have to be assumed. The pKa values calculated for [VIVOLH2]2+ from the room temperature (RT) EPR spectra are not in good agreement with data derived from the pH-potentiometric titrations (Table S5). Due to the overlapping processes and the small spectral difference between the RT EPR spectra of [VIVOLH]+ and [VIVOL] the pKa value of [VIVOLH]+ determined by EPR is unreliable. Furthermore, the assignment of the [VIVOLH]+ complex in the liquid nitrogen temperature (LNT) EPR spectra was not possible.
Fig. 7. Concentration distribution curves for the VIVO–PxTSC system {cVIVO = 1.0 mM; VIV : L = 1 : 2; T = 25.0°C, I = 0.10 M (KCl) in 30% (v/v) DMSO, 70% (v/v) H2O}. At pH > 5 the curves are only tentative due to the slow processes (dashed lines).
As in case of the (51V) values the EPR parameters are similar for the [VIVOL]
complexes of PxTSC/ PxTSCm (Table 3) and STSC (go= 1.972, Ao= 87.6 [35]). Notably, the effect of the N-terminal dimethylation is more significant than the exchange of salicylaldehyde to pyridoxal.
At pH > 5 slow processes start, most likely due to the oxidation of the ternary hydroxido species which results in a decrease of the EPR signal intensities especially at pH >7. The [VIVOL(OH)–] species were assigned, but they probably exist at lower proportion than the speciation suggests at Fig. 7 (recalculation of the speciation curve using the hydrolysis constants of VIVO determined in pure water did not affect the speciation at pH below 8).
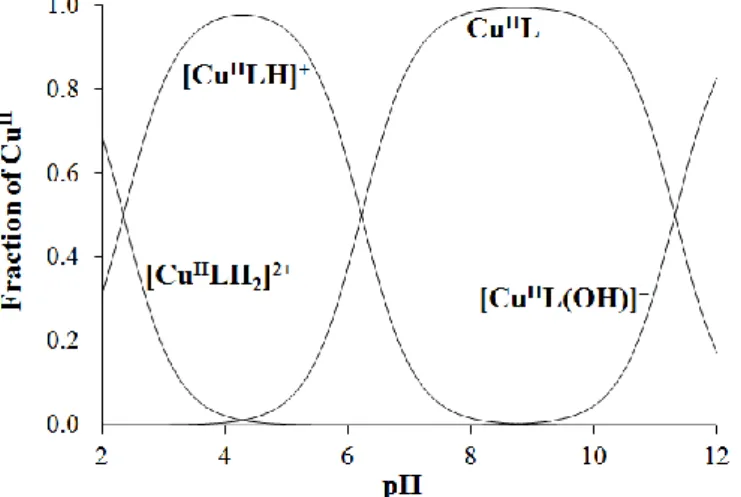
3.5. Solution equilibria of copperII complexes
Formation of precipitates at pH > 6 in the presence of CuII ions in the mM concentration range (most likely neutral CuL complexes) hindered the pH-potentimetric titrations, thus complexation was studied only by UV–Vis spectrophotometric and EPR titrations at lower concentrations (cL = 100 M). In these UV–Vis spectra it could be observed that the ligand bands are strongly overlapped by the CuII–S charge transfer bands (Fig. S11).
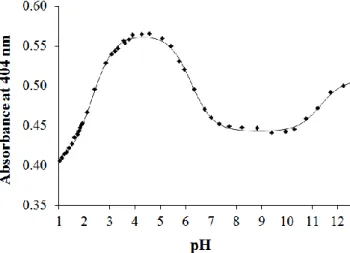
Fig. 8. Absorbance values measured at 404 nm for the CuII – PxTSC (1:1) system at pH between 1.0 and 12.5 together with the fitted curve (solid line). {cCu = cL = 0.1 mM; T = 25˚C; I = 0.10 M (KCl); 30% (w/w) DMSO/H2O}.
Comparison of the spectra recorded at pH 2 (which is the starting pH of the titrations) at various metal-to-ligand ratios with the spectra of the ligands (Fig. S11 for PxTSC) showed that they are significantly different. This indicates that complex formation processes with both
ligands start already at low pH. Therefore the pH was decreased down to pH 1.0 using individual samples in which KCl was partially or completely replaced by HCl to maintain the ionic strength constant. The spectrum recorded at pH 1 is still different from that of the metal- free ligand (Fig. S12 for PxTSC), which means that most likely the complex does not decompose by decreasing the pH. Therefore, only a threshold limit for the log value of the [CuLH2]2+ complexes could be estimated on the basis of the spectral changes (Table 4).
Fig. 9. Concentration distribution curves for the CuII–PxTSC system system {cCuII = 1.0 mM;
CuII : L = 1 : 2; T = 25.0°C, I = 0.10 M (KCl) in 30% (v/v) DMSO, 70% (v/v) H2O}.
Nevertheless, equilibrium constants for the deprotonation of the CuII complexes (pKa
values) could be calculated with appropriate accuracy by the deconvolution of the recorded spectra (Table 2). The fits between the measured and calculated absorbance values are shown for the CuII – PxTSC system in Fig. 8 along with the corresponding concentration distribution curves (Fig. 9). On the basis of the estimated overall stability constants the relative CuII binding abilities of PxTSC and its N-terminally dimethylated derivative cannot be compared directly since the complex formation equilibrium is superimposed by other accompanying equilibria, such as (de)protonation of the ligands. However, it can be concluded that both ligands are fairly efficient chelators for CuII in the whole pH range studied. In order to compare the stabilities, conditional stability constants (’) and pM values were calculated (pM stands for the negative logarithm of the equilibrium concentrations of the free metal ion under certain conditions). A higher value of log ’ and pM indicates stronger chelating ability. The conditional stability constants log ’ at pH = 7.4 (log ’ = pM in these cases if cM
: cL = 1 : 2) estimated for the CuII – ligand systems (>16.9 and >17.1 for PxTSC and PxTSCm respectively, see also Table 2) are considerably higher than those of STSC (log ’ = 12.3
calculated based on data in [34]) or one of its derivatives (L-Pro-STSC, 2-hydroxy-3-methyl- (S)-pyrrolidine-2-carboxylate-5-methylbenzaldehyde thiosemicarbazone, log ’ = 12.4 [44]).
In addition, based on the literature data a lower conditional stability constant could be calculated for the most prominent -N-pyridyl TSC Triapine (log ’ = 10.6) [6]). Taken together, the pyridoxal derivatization results in the formation of CuII complexes with higher stability in the physiological pH range compared to the reference compound STSC.
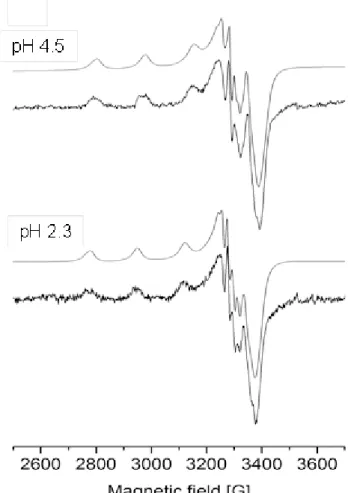
Fig. 10. Representative experimental (thick) and simulated (thin) EPR spectra for the CuII − PxTSC (1:1) system. {cCu = cL = 0.1 mM; T = 77 K; I = 0.10 M (KCl); 30% (w/w) DMSO/H2O}.
In order to gain information about the coordination modes of the CuII complexes of the pyridoxal TSCs and their deprotonation processes (characterized by the pKa values, vide infra) frozen EPR spectra were recorded at various pH values for the CuII – PxTSC system.
The latter system was chosen for the measurements owing to the much better solubility of the complexes compared to those of the dimethylated ligand. The fits between the experimental and the simulated spectra at two chosen pH values are depicted in Fig. 10. EPR spectra suggest that the presence of free CuII ions is negligible at pH ~2 and the metal ion mostly exists as complex [CuLH ]2+ and [CuLH]+ in good accordance with the findings of the UV–
Vis titrations. Although the crystal structure of the dimeric [(Cu(HL)(OH2))2]Cl2 complex was published [27], based on our EPR spectra formation of monomer [CuLH]+ is suggested in solution. The latter becomes predominant between pH ~3.5 and ~5.5. However, formation of the neutral species [CuL] is accompanied by the loss of the EPR signal at pH > ~7 under the applied condition most probably as a result of aggregation processes in the frozen sample or due to the formation of dimeric species (UV–Vis titration data were not appropriate to distinguish between the formation of monomeric and dimeric species with the same metal-to- ligand ratio.) Therefore anisotropic EPR parameters were calculated merely for the complexes [CuLH2]2+ and [CuLH]+ (Table 4). The obtained parameters (g and A values) indicate a tridentate coordination of the ligand PxTSC and a nearly square-planar geometry.
Table 4
Anisotropic EPR parameters obtained for CuII – PxTSC system from the simulation of EPR spectra with comparison of earlier published data
gx gy gz Ax a Ay a Az a aNx /G aNy /G aNz /G PxTSC
pH 2.3 2.035 2.053 2.226 21.2 16.7 175.7 17.7 15.9 8 pH 3.8–5.0 2.030 2.052 2.205 20.1 20.8 177.7 20.6 15.5 8 [CuL*H]b 2.033 2.051 2.224 22.5 24.3 176.5 17.1 6.1 6 [CuL*]- b 2.025 2.050 2.204 24.3 15.6 181.6 19.5 15.3 6 [CuL**H]+ c 2.035 2.054 2.228 22.2 22.4 174.7 5.7 17.2 6
a Unit of the coupling constans (A) is 10-4 cm-1
b L* is L-Pro-STSC data taken from [44]
c L** is STSC data taken from [34]
EPR parameter values of [CuLH2]2+ (Table 4) which is the dominant species at pH 2.3 are rather similar to those of [CuLH]+ complexes of STSC [34] and L-Pro-STSC [44]
suggesting similar coordination modes in solution. In these complexes the ligand binds through the deprotonated phenol O–,N1 and the thione S atoms (see MLH2 in Scheme 3), since the hydrazine N2H moiety is still protonated [44,58] in agreement with the X-ray crystal structure of the CuII complex of PxTSC [27]. [CuLH]+ (L = PxTSC) is formed most probably by deprotonation of the non-coordinating N2H moiety resulting in an (O–,N1,S–) coordination mode (see MLH in Scheme 3). Due to the higher negative charge, the increased ligand field
“strength” the gz is decreased and the Az is increased after the deprotonation of the hydrazinic N2H moiety. The EPR parameters changed similarly in the case of L-Pro-STSC [44].
Comparing the deprotonation processes (Table 2) of the complexes formed with CuII, VV andVIVO it can be concluded that the first deprotonation (MLH2 → MLH), which belongs to the TSC part of the ligand, takes place at the most acidic pH in the case of VV. This can be explained by the higher electron deficiency around the metal ion due to the lack of d electrons in case of VV. The deprotonation of the pyridoxal nitrogen moiety takes place most probably in the subsequent [CuLH] → [CuL] step, which however, does not affect the coordination mode of PxTSC/PxTSCm (see ML in Scheme 3). At neutral pH the [CuL] species predominates. At higher pH the deprotonation of the water molecule in the fourth position results in the formation of [CuLH-1]−, which is regarded as a ternary hydroxido complex, [CuL(OH)]− (see ML(OH) in Scheme 3).
4. Conclusions
Complexation of pyridoxal thiosemicarbazone (PxTSC) and its N-terminally dimethylated derivative (PxTSCm) with vanadium(IV/V) and copper(II) was studied in solution by the combined use of spectroscopic (51V-NMR, EPR, UV–Vis) techniques and pH- potentiometry. Structures of the [VVO2(LH)] complexes of both ligands were characterized by single crystal X-ray diffraction studies. It was found that with VIVO and VV metal ions only mono-ligand complexes were formed similarly to other thiosemicarbazones [34,35], or semicarbazones [45]. In contrast to Triapine, which in case of CuII forms bis-ligand complexes and a dinuclear Cu2L3 species [6], PxTSC and PxTSCm form merely mono complexes similarly to the reference compound STSC [34]. The pyridoxal moiety of the studied ligands results in an extra deprotonation step due to the non-coordinating pyridine-N compared to the behaviour of STSC. The experimental data (EPR, 51V-NMR) clearly show that this process takes place followed by the deprotonation of the non-coordinated N2H. The ring-N is quite far from the metal center and consequently its deprotonation does not significantly change the spectral behaviour of the complexes. However, deprotonation of the thiosemicarbazide moiety causes an electron rearrangement, resulting in a negatively charged coordinated sulphur atom, and the observed spectral changes become more pronounced.
The extra positive charge of the protonated pyridoxal moiety makes the non-coordinated hydrazinic N2H moiety of PxTSC complexes more acidic (pKa is between 2–3) compared to a pKa of 3.5–4 in case of STSC complexes with the same metal ions [34,35]. However, these
deprotonation processes are completed at physiological pH and the complexes become neutral (or negatively charged in case of VV) similarly to STSC.
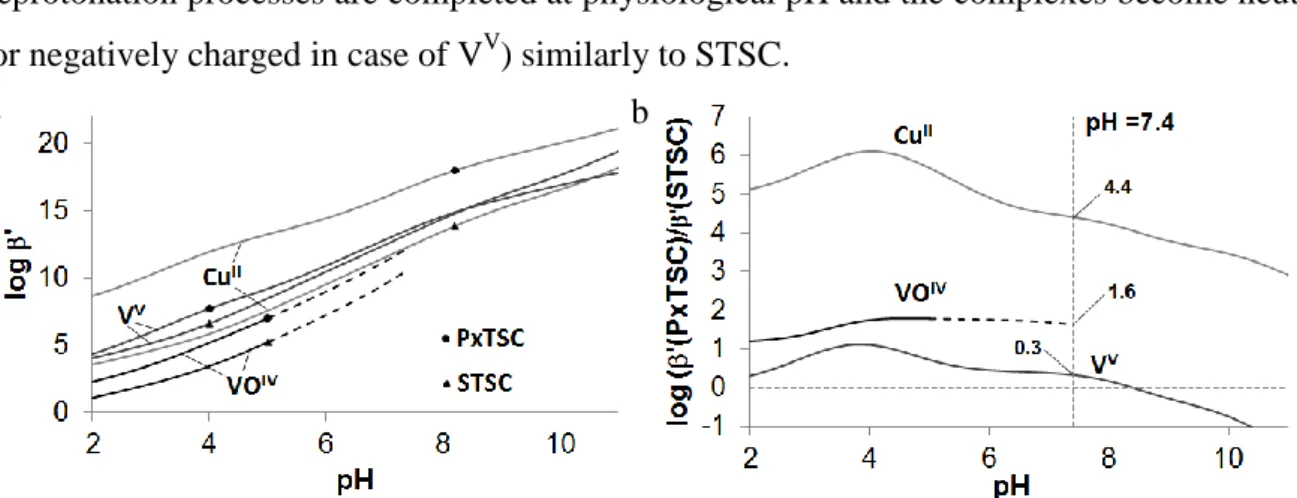
Fig. 11. Comparison of the metal ion binding capability of PxTSC and STSC as a function of pH. (a) Conditional stability constant (log ’) of the ML complexes, M = CuII, VV and VIVO, L = PxTSC and STSC. (b) The difference between the conditional stability constants, log ’
of ML complexes of the two ligands: log ’(M(PxTSC))- log ’(M(STSC)) = log(’(M(PxTSC)/’(M(STSC)) The metal ion hydrolysis was not considered. The dashed lines in the case of VIVO represent higher uncertainty. {I = 0.10 M (KCl); 30% (w/w) DMSO/H2O}.
The conditional stability constants at pH 7.4 (Table 2, Fig 11) are higher for all investigated metal ions compared to STSC, however there are significant differences in the increment: e.g. in case of VV the difference is just above the detection limit (0.3 log unit), whereas in case of CuII a strong increase could be observed. The order of the increase of the conditional stability constants (Fig 11b) follows the decreasing Lewis acid hardness of the metal ions: VV < VIVO < CuII. In Fig 11b a clear maximum can be observed at around pH 4 in the case of CuII and VV (not significant in case of VIVO). This can be explained by the fact that the pyridoxal moiety is deprotonated at a much higher pH in the CuII complex (pKa = 6.22) than in the VV (pKa = 5.15) and especially in the VIVO (pKa = 4.30) complexes. In comparison STSC loose a proton with these metal ions with a pKa between pH 3.5 and 4.
Most probable this extra stability increment between PxTSC/PxTSCm and STSC at mild acidic condition can be related to the salicylaldehyde/pyridoxal replacement and the increment would have been even higher if there were no other deprotonation processes of the complexes. So the final conclusions are that the salicylaldehyde/pyridoxal replacement has the strongest effect under mild acidic conditions, however, in case of CuII also at physiological pH a distinctly increased stability could be observed. Unfortunately the VIVO complexes are not stable enough to avoid hydrolysis completely at neutral pH.
a b
5. Abbreviations
TSC thiosemicarbazone
PxTSC pyridoxal thiosemicarbazone
PxTSCm pyridoxal-N3,N3-dimethylthiosemicarbazone STSC salicylaldehyde thiosemicarbazone
SSC salicylaldehyde semicarbazone
L-Pro-STSC 2-hydroxy-3-methyl-(S)-pyrrolidine-2-carboxylate-5-methylbenzaldehyde thiosemicarbazone
DMSO dimethyl sulfoxide
Acknowledgments
This work was supported by the National Research, Development and Innovation Office-NKFI through project GINOP-2.3.2-15-2016-00038 and Austrian-Hungarian Scientific
& Technological Cooperation TÉT_15-1-2016-0024.
Appendix. Supplementary data
Supplementary data related to this article can be found online at doi:10.1016/j.ica.2017.XX.YYY.
References
[1] J.R. Dilworth, R. Hueting, Inorg. Chim. Acta 389 (2012) 3.
[2] C. M. Nutting, C. M. L van Herpen, A. B. Miah, S. A. Bhide, J. P. Machiels, J. Buter, C. Kelly, D. de Raucourt, K. J.Harrington, Ann. Oncol. 20 (2009) 1275.
[3] J. Kolesar, R. C. Brundage, M. Pomplum, D. Alberti, K. Holen, A. Traynor, P. Ivy, G.
Wilding, Cancer Chemother. Pharmacol. 67 (2011) 393.
[4] A.B. Miah, K.J. Harrington, C.M. Nutting, Eur. J. Clin. Med. Oncol. 2 (2010) 87.
[5] E.A. Enyedy, M.F. Primik, C.R. Kowol, V.B. Arion, T. Kiss, B.K. Keppler, Dalton Trans. 40 (2011) 5895.
[6] E.A. Enyedy, N.V. Nagy, E. Zsigó, C.R. Kowol, V.B. Arion, B.K. Keppler, T. Kiss, Eur. J. Inorg. Chem. 11 (2010) 1717.
[7] P. Chellan, T. Stringer, A. Shokar, P.J. Dornbush, G. Vasquez-Anaya, K.M. Land, K.
Chibale, G.S. Smith, J. Inorg. Biochem. 105 (2011) 1562.
![Fig. 1. ORTEP plot of [V V O 2 (L 1 H)]×0.8H 2 O (1) with thermal ellipsoids depicted at 50%](https://thumb-eu.123doks.com/thumbv2/9dokorg/1338331.108633/11.892.117.477.470.712/fig-ortep-plot-v-v-thermal-ellipsoids-depicted.webp)