Chemical modification and optical spectroscopy of single-walled carbon
nanotubes
Ph.D. Dissertation
Katalin N´ emeth
Doctoral School of Molecular- and Nanotechnologies University of Pannonia
Head of School: Dr. Ferenc Vonderviszt
Supervisor: Prof. Katalin Kamar´ as
Research Professor, Corresponding Member of the Hungarian Academy of Sciences
Institute for Solid State Physics and Optics,
Wigner Research Centre for Physics, Hungarian Academy of Sciences
2015
DOI: 10.18136/PE.2015.597
Chemical modification and optical spectroscopy of single-walled carbon nanotubes
Ertekez´´ es doktori (PhD) fokozat elnyer´ese ´erdek´eben
´Irta:
N´emeth Katalin
K´esz¨ult a Pannon Egyetem Molekul´aris- ´es Nanotechnol´ogi´ak Doktori Iskol´aj´aban
T´emavezet˝o: Prof. Kamar´as Katalin
Az ´ertekez´est t´emavezet˝ok´ent elfogad´asra javaslom:
Prof. Kamar´as Katalin: igen/nem ...
(al´a´ır´as) A jel¨olt a doktori szigorlaton ...%-ot ´ert el.
Az ´ertekez´est b´ır´al´ok´ent elfogad´asra javaslom:
B´ır´al´o neve:... igen/nem
...
(al´a´ır´as) B´ır´al´o neve:... igen/nem
...
(al´a´ır´as) A jel¨olt az ´ertekez´es nyilv´anos vit´aj´an ...%-ot ´ert el.
Veszpr´em, 201...
A doktori (PhD) oklev´el min˝os´ıt´ese:...
...
a B´ır´al´o Bizotts´ag eln¨oke
...
az EDHT eln¨oke
Contents
Kivonat 6
Abstract 8
Auszug 9
Foreword 10
1 Introduction 11
1.1 Carbon nanotubes . . . 11
1.1.1 Allotropic forms of elemental carbon . . . 11
1.1.2 Basics of carbon nanotubes . . . 12
1.1.3 Growth of carbon nanotubes . . . 16
1.1.4 Electronic structure of single-walled carbon nanotubes . . . 18
1.1.5 Optical transitions of single-walled carbon nanotubes . . . 19
1.1.6 Vibrational properties and Raman spectrum of single-walled car- bon nanotubes . . . 22
1.2 Chemistry of single-walled carbon nanotubes . . . 24
1.2.1 Structure and reactivity . . . 24
1.2.2 Challenges in nanotube chemistry . . . 26
1.2.3 Reaction types and sites in nanotubes . . . 26
1.2.4 Classical and modified Birch reduction . . . 29
1.2.5 Alkali metal intercalation . . . 30
1.3 Optical spectroscopy of carbon nanotube thin films . . . 33
1.3.1 The Drude-Lorentz model . . . 33
1.3.2 Calculation of optical functions . . . 35
2 Experimental 38 2.1 Objectives . . . 38
2.2 Preparation . . . 40
2.2.1 Materials . . . 40
2.2.2 Synthetic routes . . . 40
2.3 Characterization . . . 43
2.3.1 Raman spectroscopy . . . 43
2.3.2 Thermogravimetry-mass spectrometry . . . 44
2.3.3 1H-NMR spectrometry . . . 44
2.3.4 Wide range transmission spectroscopy . . . 45
3 Results and discussion 52 3.1 Hydrogenation reactions on HiPco single-walled carbon nanotubes . . . 52
3.1.1 Raman spectroscopic and TG-MS results . . . 54
3.1.2 Optical spectroscopic results . . . 56
3.2 Hydrogenation and n-butylation of HiPco single-walled carbon nanotubes 61 3.3 Hydrogenation of nanotube bundles by alkali metal intercalation . . . . 62
3.3.1 van der Waals interactions in nanotube bundles . . . 72
3.4 Conclusions and summary . . . 78
Acknowledgement 81
Theses 83
T´ezispontok 85
List of publications 87
References 90
Kivonat
Egyfal´u sz´en nanocs¨ovek k´emiai m´odos´ıt´asa ´es optikai spektroszk´opi´as vizsg´alata
A disszert´aci´o t´em´aja egyfal´u sz´en nanocs¨ovek redukt´ıv add´ıci´os reakci´oinak vizs- g´alata els˝osorban termogravimetria-t¨omegspektrometria (TG-MS) ´es sz´eles tartom´any´u transzmisszi´os spektroszk´opia seg´ıts´eg´evel. Optikai spektroszk´opi´aval az add´ıci´os reak- ci´ok sor´an az elektronszerkezetben t¨ort´en˝o v´altoz´asok j´ol detekt´alhat´ok, melyekb˝ol a reakci´ok ´atm´er˝o-szelektivit´as´ara k¨ovetkeztethet¨unk.
Kereskedelmi forgalomban kaphat´o, nagy tisztas´ag´u egyfal´u sz´en nanocs¨oveket m´o- dos´ıtottam hidrog´en- ´es n-butil-csoportokkal m´odos´ıtott Birch redukci´oval ´es alk´alif´em- interkal´aci´oval. A m´odos´ıtott Birch redukci´o egy kv´azi-homog´en, oldatf´azis´u reakci´o- nak tekinthet˝o, melynek els˝odlesges kiindul´asi anyagai az egyedi nanocs¨ovek, m´ıg az interkal´aci´os mechanizmus egy szil´ard f´azis´u, a nanocs˝o k¨otegek belsej´eben v´egbemen˝o reakci´o, els˝odleges kiindul´asi anyagai teh´at a nanocs˝o k¨otegek.
HiPco nanocs¨ovek hidrog´enez´ese mindk´et reakci´o eset´en 2-4 H/100 C H-tartalm´u term´eket eredm´enyezett a TG-MS vizsg´alatok szerint. Azonban, a k´et reakci´o ´atm´er˝o- szelektivit´asa elt´er˝onek bizonyult a spektroszk´opiai m´er´esek szerint: a m´odos´ıtott Birch redukci´o eset´en norm´al (kisebb ´atm´er˝oj˝u cs¨ovek nagyobb reaktivit´asa), az interkal´aci´o eset´en ford´ıtott ´atm´er˝o-szelektivit´ast tapasztaltam. A k¨ul¨onbs´eget a reakci´ok elt´er˝o mechanizmus´aval magyar´aztam: az els˝o esetben a kis ´atm´er˝oj˝u cs¨ovek nagyobb reak- tivit´as´aval, a m´asodik esetben az interkal´aci´o energetik´aj´aval. Az alk´alif´emek interkal´a- ci´oja a nanocs˝o k¨otegek belsej´ebe a k¨oteg t´agul´as´at ig´enyli. Ennek energiaig´enye a sz¨uk- s´eges k¨otegt´agul´ast´ol f¨ugg, amely ar´anyos a kation m´eret´evel ´es f¨ugg a k¨oteget fel´ep´ıt˝o cs¨ovek ´atm´er˝oj´et˝ol.
H´arom k¨ul¨onb¨oz˝o ´atlagos ´atm´er˝oj˝u kiindul´asi nanocs¨ovet (P2, HiPco, CoMoCat)
´es k´et elt´er˝o ionsugar´u alk´alif´emet (K, Rb) alkalmazva, a nanocs˝o k¨otegek hidrog´enez´es´enek ´atm´er˝o-szelektivit´asa sz´eles ´atm´er˝o-tartom´anyban ´es h´arom k¨ul¨on- b¨oz˝o ionsug´ar/nanocs˝o-´atm´er˝o ar´anyn´al vizsg´alhat´o. Fentieknek megfelel˝oen h´arom k¨ul¨onb¨oz˝o ´atm´er˝o-szelektivit´ast mutattam ki optikai spektroszk´opia seg´ıts´eg´evel: K/P2 eset´en semmilyen, K/HiPco eset´en ford´ıtott, Rb/CoMoCat eset´en norm´al ´atm´er˝o- szelektivit´ast. A TG-MS m´er´esek szerint a hidrog´en-tartalom a K/P2 ´es K/HiPco mint´ak eset´en 2-4 H/100 C, a Rb/CoMoCat mint´ak eset´en meglep˝oen kicsi,<1 H/100 C volt.
Vizsg´altam HiPco nanocs¨ovek reaktivit´as´at n-Bu csoportokkal szemben is, mindk´et reakci´oval. Mell´ekreakci´ok´ent mindk´et esetben hidrog´enez´est v´artam. A v´arakoz´assal ellent´etben azonban a hidrog´enezett nanocs˝o volt a f˝o term´ek, a butiloz´as csak igen kis sz´azal´ekban j´atsz´odott le. Ebb˝ol arra k¨ovetkeztettem, hogy a hidrog´enez´es a butiloz´as- sal szemben kedvezm´enyezettebb ´es/vagy gyorsabb.
Minden esetben vizsg´altam azt is, hogy n¨ovelhet˝o-e a kitermel´es t¨obb (h´arom) egym´ast k¨ovet˝o l´ep´es alkalmaz´as´aval, amikor egy reakci´o kiindul´asi anyaga az el˝oz˝o azonos reakci´ot´ıpus term´eke. Azt tal´altam, hogy kev´ess´e b´ar, de minden esetben n¨ovel- het˝o volt a kitermel´es, m´eg a m´odos´ıtott Birch redukci´o eset´en is, ami egy kv´azi- homog´en, oldatf´azis´u reakci´o, ´es els˝odleseges kiindul´asi anyagai az old´oszerben jelenl´ev˝o negat´ıvan t¨olt¨ott nanocs¨ovek. A k¨otegek felboml´asa m´ar ekkor megkezd˝odik, az oldat- ban egyedi nanocs¨ovek is jelen vannak. A kitermel´es n¨oveked´ese azt igazolja, hogy a megmarad´o kis k¨otegek az egym´ast k¨ovet˝o reakci´ok sor´an fokozatosan lazulnak ´es bomlanak fel.
Abstract
Chemical modification and optical spectroscopy of single-walled carbon nanotubes
In this thesis, the reactivity and the diameter selectivity of reductive addition re- actions of individual and bundled single-walled carbon nanotubes were investigated.
Two different reactions were applied: the well-known modified Birch reduction and a solid-phase reaction, similar to those of used for the synthesis of some graphite in- tercalation compounds. These routes were used to functionalize the nanotubes with hydrogen and n-butyl groups. Thermogravimetry-mass spectrometry was used to de- termine the functional group content and the thermal stability of the samples, and wide range transmission spectroscopy on self-supporting thin films to determine the diam- eter selectivity of the reactions inside one sample, since the energy of the electronic transitions of the nanotubes has diameter-dependence.
Auszug
Chemische Modifikation und optische Spektroskopie der einwandigen Kohlenstoff- nanor¨ohren
Im Rahmen dieser Doktorarbeit wurden die Reaktionsf¨ahigkeit und die Selektivit¨at der Reaktionen an individuellen einwandigen Kohlenstoffnanor¨ohren und Nanor¨ohrb¨un- deln untersucht. Zwei verschiedene reduzierende Additionsreaktionen sind hierbei angewandt worden: die wohlbekannte modifizierte Birch Reduktion und eine Fest- phasenreaktion, welche ¨ahnlich zu denjenigen bei den Grafitinterkalationverbunden ge- br¨auchlich ist. Diese Reaktionen wurden angewandt, um die Nanor¨ohren mit Wasser- stoff und n-Butyl Gruppen zu modifizieren. Termogravimetrie-Massenspektrometrie wurde f¨ur die Bestimmung des Funktionsgruppeninhalts und der termischen Festigkeit der Proben benutzt. Breitb¨andige optische Spektroskopie wurde an selbsttr¨agenden D¨unnschichten angewandt, um anhand von ¨Anderungen in den Spektren Folgerungen auf die Durchmesserselektivit¨at zu schließen.
Foreword
Carbon, this significantly important element has very unique properties arising from the 1s22s22p2 electronic structure of the carbon atom. This electronic structure permits wide variety of chemical bonding between two, or even more carbon atoms, building up long chains, rings, networks, even structures with multiple carbon-carbon bonds.
Organic chemistry that deals with these structures is very vivid and complex, but accordingly very interesting and challenging.
The same challenge exists when we consider the inorganic chemistry of carbon.
Even elemental carbon shows a huge diversity because of the hybridization and bonding possibilities.
In this thesis I focus on one allotropic form of carbon, namely nanotubes. Covalent hydrogenation and butylation reactions were done in the frame of this work to inves- tigate selectivity and steric effects of these addition reactions. Optical spectroscopy and thermogravimetry-mass spectrometry were the key tools to investigate the special behaviour of the synthesized material systems.
In the Introduction part I present the basic physical and chemical properties of nanotubes. A detailed description of the special optical spectroscopic technique and data evaluation used for carbon nanotube samples is given. Then I present the syntheses and the results obtained on the products, with special attention to optical spectroscopic results.
1 | Introduction
1.1 Carbon nanotubes
Carbon nanotubes constitute a very special allotropic form of elemental carbon.
Although they can form individual particles in a system (giant molecules set up by periodic units, like a polymer molecule), a carbon nanotube system is preferably de- scribed as a solid. With the solid-state description most of the physical properties of a carbon nanotube can be described and predicted. However, regarding the chemical properties and reactivity, the solid-state picture is not always sufficient.
In this section I present the special structural, electronic and optical properties of carbon nanotubes that are relevant and necessary for the topic of this thesis.
1.1.1 Allotropic forms of elemental carbon
A carbon atom (6C: 1s22s22p2) possesses four valence electrons. This means that it can form four covalent bonds. Because of the collusion of spatial and energetic cir- cumstances inside the atom, a carbon atom is really capable of forming up to four stable covalent bonds even with other carbon atoms. This fact leads to the variety of its allotropic forms (Figure 1.1).
These carbon structures are usually considered as three, two, one and zero dimen- sional according to their symmetry properties. Diamond is a three-dimensional (3D) structure because of the tetrahedral symmetry of sp3 hybridized carbon atoms which build up the diamond lattice. sp2 hybridized carbon atoms build up the structure of graphite (2D), nanotubes (1D) and fullerenes (quasi-0D) with aπ-electron system de-
Figure 1.1: Allotropic forms of carbon [1].
localized over the wholeσ-framework. For sp2 carbon atoms, the energetically favored arrangement is trigonal planar, however in nanotubes and fullerenes the carbon atoms are not in planar arrangement due to the curvature of these structures.
The strain in theσ-framework andπ-electron system leads to the interesting physi- cal and chemical properties of nanotubes, which is placed between that of graphite and fullerenes.
1.1.2 Basics of carbon nanotubes
Carbon nanotubes are hollow cylindrical forms of graphitic sheets (Figure 1.1 c).
The multi-walled form of carbon nanotubes (multi-walled carbon nanotubes, MWNT) was discovered by S. Iijima in 1991 (while using the arc-discharge method developed for synthesis of fullerenes) [2], the single-walled form (single-walled carbon nanotubes, SWNT) two years later [3]. The diameter of a SWNT is typically 0.5-2.5 nm, its length is 50 µm-4 mm.
Theoretically SWNT can be derived from a single graphene layer rolled up seam- lessly to form a cylinder [4]. We can choose a chiral vector, Ch on the graphene sheet as in Figure 1.2. This will constitute the circumference of the nanotube (MWNT are built up by coaxial SWNT). The lattice vectors of the graphene sheet,a1 anda2, build up theCh vector as Equation 1.1 shows, where n and m are integer numbers:
Ch =na1+ma2 (1.1)
a
1a
2(n ,0) zig
zag
n m
T
(n,n) armchair
C
h=(7,4)
θ
Figure 1.2: The honeycomb structure of the graphene sheet showing the chiral vector Ch, constructed from the lattice vectorsa1 anda2, and the three main groups of single- walled nanotubes: (n,0) zigzag, (n, n) armchair and (n, m) chiral. θ is thechiral angle, the angle betweenChanda1. The brown rectangle is the unit cell of the nanotube having the Ch vector as a circumference. T is the normal vector of Ch and the translational direction of the unit cell in order to construct a nanotube with an arbitrary length.
These (n,m) indices determine all geometrical-physical parameters of the nanotube, like the diameterd:
d= |Ch| π = a0
π
√n2+nm+m2 (1.2)
where a0 is the length of the base vector in graphene (0.2461 nm); the chiral angle θ;
the indices of the translational vectorT(t1, t2):
t1 = n+ 2m
gcd(n+ 2m,2n+m); t2 = 2n+m
gcd(n+ 2m,2n+m) (1.3) wheregcdis the operator for greatest common divisor; the number of atoms in the unit cell N:
N = 4·(n2+nm+m2)
gcd(n+ 2m,2n+m) (1.4)
the electronic structure and conduction properties (metallic or semiconducting), etc.
There is an infinite number of ways to roll up the graphene sheet into a cylinder resulting in nanotubes with different properties. This vast number of nanotubes can be divided into three main groups according to the shape of their unit cells: armchair, zig-zag and chiral tubes (see Figure 1.3). Due to the six-fold symmetry of the graphene sheet, structurally different nanotubes can be obtained only in theΘ = 0−30◦range [5].
In reality, the length of a carbon nanotube is not infinite, and its end is usually closed by a fullerene-like cap. A real single-walled carbon nanotube has three main structural parts with different chemical and physical properties: the graphitic-like sidewall, the fullerene-like cap (or an open end) and defects in the sidewall: absence or excess of carbon atoms (pentagons or heptagons), contaminant atoms, distortion of the hexagons, etc. These facts lead to a quite large variety of physical and chemical properties and chemical reactions.
A real bulk nanotube sample is a black powder with very low density, mixtures of bundled nanotubes with different chiralities and a given diameter and length distribu-
Figure 1.3: The three main groups of SWNTs. The translational period is indicated [6].
tion. Figure 1.4 shows an AFM image of an SWNT nanotube sample produced by the electric arc-discharge method (see Section 1.1.3).
It can be derived from the band structure and the symmetry properties of the graphene sheet by using tight-binding approximation, that the ratio of semiconducting and metallic nanotubes is 2:1. If|n−m|= 3k, wherek is an integer number, the nano- tube is metallic, otherwise semiconducting. Due to curvature effects on the electronic structure of the nanotubes, the smaller the tube diameter, the larger the deviation from the 2:1 ratio. However, armchair nanotubes are always metallic. Even in thin armchair nanotubes, the conjugated bond structure is parallel to the tube axis and extends to the whole length of the tube. Thus, these electronic states are extended to the whole molecule, they do not have any nodal planes with a component perpendicular to the tube axis.
Figure 1.4: AFM image of a typical nanotube sample: the spaghetti-like bundles shown in the image are built up by ropes of individual nanotubes (own measurement).
1.1.3 Growth of carbon nanotubes
Carbon nanotubes are produced by decomposition of carbonaceous materials. The so-formed carbon atoms will build up the nanotubes. By varying the parameters (method, reactor geometry, starting materials, atmosphere, temperature, catalysts, etc.) different samples are produced. The resulting material contains several types of nanotubes, so it has a narrower or broader diameter and length distribution. More- over, the individual nanotubes are not grown in a well-ordered structure, but they form bundles randomly. In the bundles, different nanotubes stick together very tightly.
Besides, the sample always contains contaminants like amorphous carbon or residue of catalysts.
In the following, a brief summary of nanotube growing methods is given:
Electric-arc discharge method
Striking an arc between graphite electrodes in an inert atmosphere (usually He, He/Ar) is the traditional technique. Pyrolitic graphite and graphitic nanoparticles are the contaminants. The process is quite simple and the product has a high structural quality, even after purification [7, 8]. For synthesizing MWNT there is no need for catalysts, but it is necessary for growing SWNT. Typical catalysts are Fe, Co, Ni, Y, Gd, Fe/Ni, Co/Ni. The average diameter of so-produced SWNT is 1.2-2.0 nm [3, 9–11].
Laser ablation
A piece of graphite (or graphite-metal/metal-oxide mixture) is vaporized by laser irradiation at high temperature and in inert atmosphere. The carbon particles are swept by a gas flow and deposited on a cooled collector. Default product without transition metal catalyst is MWNT, catalyst is needed to produce SWNT [12–15].
Using catalysts, high quality but highly bundled SWNT can be produced. Their average diameter is around 1.2-1.4 nm [15].
Chemical vapor deposition
While arc-discharge and laser ablation are called ”high temperature” (>3000 K) and ”short time reaction” (10−3 −10−6 s) methods, chemical vapor deposition (CVD) is a medium temperature (700−1500 K) and long time (minutes to hours) reaction.
Advantages of CVD or CCVD (catalytic chemical vapor deposition) methods compared to the former ones are that they contain less carbonaceous impurities, so only the catalytic particles have to be removed.
Technically, a simple equipment consists of a quartz tube in a furnace. Hydrocarbon (or other carbon-containing) gas is led into the quartz tube. In the presence of a metal catalyst, thermal decomposition of the gas takes place. Carbon nanotubes grow over and around the catalyst particles. Substrate materials are usually Si, mica, silica, quartz, alumina. By varying the parameters (temperature, composition, catalyst, time, gas flow etc.) physical and chemical properties can be varied [16].
One of the most popular CVD methods is thehigh pressure carbon monoxide, HiPco method, where the thermal decomposition of Fe(CO)5 provides in situ the carbon source CO and the catalytic Fe nanoparticles [17]. Average diameter of HiPco nanotubes is 0.7-1.4 nm [16, 17].
CoMoCat nanotubes are also CVD tubes, but using a Co-Mo mixture as a catalyst.
Carbon sources are usually CO, CH4 or C2H2 [18].
Finally, it must be emphasized that by varying the reaction conditions the consti- tution of the products (diameter and length distributions, size of the bundles, func- tionality) can be designed within certain limits, but an overall control has not yet been achieved.
1.1.4 Electronic structure of single-walled carbon nanotubes
In graphite the fourth valence electron of each carbon atom is delocalized over the whole honeycomb-like plane. It is demonstrated by the fact that the electrical conductivity of graphite bulk material is 100 times greater along the planes than in the perpendicular direction [19].
Let us consider a tubularly wrapped graphene sheet. This is a quasi-one dimen- sional, ideal nanotube. The z direction, which is the direction of the nanotube axis, will be infinite, and the electronic states in this direction will be continuous. Along the circumference of the tube, electronic states are quantized by |Ch|.
This kind of quantization is a peculiarity of all one-dimensional electronic systems, and has an important consequence: there appear narrow energy ranges in the solid’s electronicband structure, which are allowed for a huge number of electrons. It leads to the appearance of sharp peaks at these specific energies in their electronic density of states (DOS), called Van Hove singularities [20–22].
Practically, from a chemist’s point of view, Van Hove singularities can be considered as discrete molecular energy levels superimposed on the continuous solid electron states (bands). In semiconducting nanotubes, there are forbidden states between the highest energy level, where electrons are in the ground state (analogy with HOMO), and the
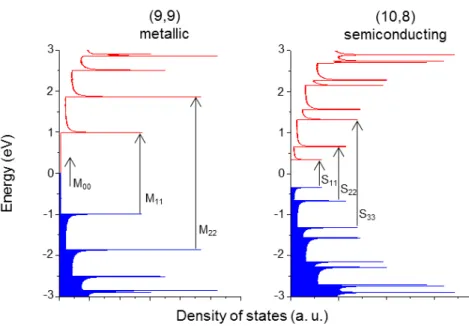
Figure 1.5: Electronic density of states (DOS) of (9,9) metallic and (10,8) semicon- ducting tubes (diameter: 1.22 nm). Optically allowed symmetric transitions between Van Hove singularities are indicated: M11 - 1st metallic transition; M22 - 2nd metallic transition. S11 - 1st semiconducting transition; S22 - 2nd semiconducting transition; S33 - 3rd semiconducting transition. M00 notation is used for the contribution of free charge carriers (at zero energy) [23].
next allowed unoccupied state (analogy with LUMO). This energy range is calledband gap. In metallic nanotubes the density of states is finite (non-zero) and is populated up to the 0-level (Fermi level) in the ground state (Figure 1.5).
1.1.5 Optical transitions of single-walled carbon nanotubes
Using optical spectroscopy to investigate the electronic structure and chemical bonds of carbon nanotubes is plausible. Nanotube spectra have unique properties originating from the one-dimensionality, diameter distribution and bundling. One- dimensionality causes the above mentioned sharp peaks, the Van Hove singularities in the DOS. Electronic transitions between these Van Hove singularities cause intense peaks in the optical spectrum usually in the mid-infrared–visible range, superimposed on the continuous electron states. Since electronic transition energies of nanotubes with different diameters are very close to each other, diameter distribution of the sam-
ple causes broadening of the peaks related to the Van Hove singularities. Bundling of the nanotubes changes the band structure through intertube interactions and lowering symmetry properties.
The impurities, like amorphous carbon and remaining catalyst particles also con- tribute to the optical spectrum. They increase the background and complicate the evaluation of the measured spectra.
The electronic transitions between Van Hove singularities are demonstrated in Fi- gure 1.5. These transitions can be easily induced optically and dominate the nanotube spectrum shown in Figure 1.6.
Because of the one-dimensional structure of nanotubes, selection rules of optical transitions are dependent on the polarization of the exciting light. Only symmetrical transitions between Van Hove singularities are allowed, when light polarization is paral- lel to the nanotube axis. For light polarized perpendicular the tube axis, selection rules are different, but the intensity of these transitions is negligible beside the symmetrical ones.
Plotting electronic transition energies versus tube diameter, the widely used Kataura plot is obtained. It was developed by H. Kataura in 1999 using measured data and calculations by thezone-folding method (Figure 1.7) [25,26]. The Kataura plot has been subject to continuous improvement in experimental and theoretical techniques over the years, and as a result, it has been refined but not changed substantially.
With increasing tube diameter the points in the Kataura plot get more dense, which involves the densifying of the single peaks in the optical spectrum at high energies and hardening the assignment to a given chirality. In the Raman spectrum, tubes having transition energies that match the laser energy will be in resonance and provide an enhanced Raman intensity.
The vibrational modes in the mid-infrared region are missing from the absorption spectrum. The main reason for this absence is that in carbon nanotubes the transition dipole moments connected to vibrational transitions are small [27].
0 1 0 0 0 0 2 0 0 0 0 3 0 0 0 0 4 0 0 0 0 5 0 0 0 0 π−π*
M 1 1
S 2 2 S 1 1
M 0 0
Absorbance (a. u.) W a v e n u m b e r ( c m - 1)
S 3 3+ M 2 2
7 8 5 n m
a )
0 5 0 0 0 1 0 0 0 0 1 5 0 0 0 2 0 0 0 0 2 5 0 0 0
M 1 1
S 2 2 S 1 1
M 0 0
Absorbance (a. u.) W a v e n u m b e r ( c m - 1) S 3 3+ M 2 2
b )
Figure 1.6: (a) Absorbance spectrum of a real SWNT sample consisting of many differ- ent (n, m) tubes. The laser energy used in this work (785 nm) is indicated; (b) Zoomed in to the range of relevant electronic transitions. Each symmetric transitions has a distinct peak consisting of tubes with different diameters [24].
0 1 2 3
0123
. .
M 2 2M 1 1S 4 4S 3 3S 2 2s e m i c o n d u c t i n g m e t a l l i c
Energy separation (eV)
N a n o t u b e d i a m e t e r ( n m ) γ0= 2 . 9 e V , a C C = 0 . 1 4 4 n m
7 8 5 n m
S 1 1
.
Figure 1.7: By plotting the energy of electronic transition vs. tube diameter, the so called Kataura plot can be obtained [23]. Raman laser line used in this work (785 nm) is indicated. Tubes on this line are in resonance and have enhanced intensity in the Raman spectrum obtained by using this laser. With gray rectangle is indicated the diameter distribution of the nanotube sample, which absorption spectrum is shown in Figure 1.6.
1.1.6 Vibrational properties and Raman spectrum of single- walled carbon nanotubes
The one-dimensional nature of carbon nanotubes has pronounced effects also on their vibrational properties. As it was mentioned above, absorption spectroscopy is unsuitable for investigation of the vibrational modes of pure nanotubes since they have a very weak contribution. In contrast, Raman spectroscopy has proven to be a very effective technique [28, 29]. Raman active vibrational modes can have much larger intensity due to resonance effects compared to IR active vibrational modes.
In the case of carbon nanotubes, a resonance effect is present, when the laser energy matches that of a real electronic transition in the sample. These electronic transitions appear in the absorption spectrum shown in Figure 1.6 as transitions between the Van Hove singularities. Resonance causes enhanced intensity compared other excitations.
This, on the one hand, improves the quality of the Raman spectra, on the other hand,
0 2 5 0 5 0 0 7 5 0 1 0 0 0 1 2 5 0 1 5 0 0 1 7 5 0 2 0 0 0
Raman intensity (a. u.)
R a m a n s h i f t ( c m - 1) R B M
D - b a n d G - b a n d
Figure 1.8: General Raman spectrum of an SWNT sample [6].
it can cause complications in the evaluation, since the detected intensity does not correlate with the amount [30].
The significance and popularity of Raman spectroscopy in nanotube characteriza- tion is in its fast, simple and non-destructive features. Many processes can be followed in situ by Raman spectroscopy. There is no need for special sample preparation, and in the past few years there were important developments in the methodology. With Raman spectroscopy, the electronic, vibrational and (under external pressure) elastic properties of nanotubes can be investigated.
For investigating the electronic properties of carbon nanotube samples, absorption spectroscopy is much more effective than Raman spectroscopy because there occurs no complication of resonance effects.
The Raman spectrum of a solid, pure SWNT sample is shown in Figure 1.8. Three main parts of the spectrum can be distinguished: at low wavenumbers the RBM (Ra- dial Breathing Modes) region can be found, which appears only in nanotubes out of all carbon allotropes. This is a collective expansion-contraction motion (like breathing) of the carbon atoms building up the cylinder of the nanotube. The frequency of this mode is inversely proportional to the tube diameter [29]. The RBM mode is usually used for
determining the diameter distribution of the sample by using several excitation wave- lengths. For a precise characterization, more lasers are needed because of resonance: in a bundled nanotube sample with 30-100 different diameters, there must be tubes with an electronic excitation at the laser energy (resonance effect). RBM peaks of these tubes will have anomalously large intensity. In some cases, this becomes a drawback:
from a simple Raman experiment, the quantitative determination of the amount of a nanotube with a specific diameter is not possible.
Between 1200-1400 cm−1 the D-band (Disorder Induced Mode) can be found. This mode can also be found in most forms of carbon. The origin of the D-band in nanotubes lies in defects in the tube structure, like heptagons, pentagons, sp3 C atoms, ends and caps of the tubes. All these defects increase the D-band intensity. In functionalized nanotubes prepared from a good quality starting material, the increase of the intensity of the D-band can be used for the quick verification of the functionalization.
The drawback of Raman measurements over absorption measurements in the case of investigating chemical reactions of carbon nanotubes is that the change of the D- band does not provide information about the selectivity of a reaction, only about its occurrence.
The G-band around 1500-1700 cm−1is also characteristic of graphite and nanotubes.
The origin of the G-band is the superposition of the tangential shifts of the C atoms on the surface of the tubes.
1.2 Chemistry of single-walled carbon nanotubes
1.2.1 Structure and reactivity
Special properties of nanotubes compared to a simple graphene sheet play a very important, moreover, determinative role in physical and chemical behaviour of real nanotube samples. The differences between the ideal and real world become more and more dominant as the diameter of the nanotube decreases, since the effect of finite curvature and intertube interactions gets more significant [31].
Figure 1.9: Diagrams of (a) metallic (5,5) SWNT, (b) pyramidalization angle (θP), and (c) the π-orbital misalignment angles (φ) along the C1-C4 bond in the (5,5) SWNT and its capping fullerene, C60 [32].
The first, chemically interesting statement is that a nanotube can be considered as a cylindrical macromolecule expected to be chemically fairly inert. However, like other non-planar conjugated systems, there are two curvature-induced effects that must be considered: pyramidalization of conjugated carbon atoms and π-orbital misalignment between adjacent carbon atoms (Figure 1.9) [32]. Both cause local strain, and therefore enhance reactivity towards addition reactions. During addition, sp3 carbon atoms are formed with tetrahedral symmetry which lowers local strain, and somewhat relaxes the structure. Compared with fullerenes, which are curved in three dimensions, and with graphene, which is not curved, the reactivity correlates with structural strain, therefore expected to be placed between that of fullerenes and graphene.
In nanotubes - contrary to fullerenes -π-orbital misalignment is the main source of strain. This effect is the most relevant in small-diameter tubes at C-C bonds enclosing a higher angle with the nanotube axis [33].
Also, bond curvature determines the reactivity, especially towards [2+1] cycload- ditions. There are three nonequivalent C-C bond types in nanotubes, defined by the angleθ.θ is an acute angle between the tubular axis and the C-C bond in the plane of
the unfolded SWNT.θ is just equal to the chiral angle, the other two angles are 60◦−θ and 60◦+θ [34].
In extremely thin nanotubes, the curved surface causes rehybridization. Originally, σ and pz orbitals are orthogonal to each other. Curvature induces a finite overlap between them. The energy of the σ∗ state shifts upward a little, while the energy of π∗ state shifts downward. These shifts increase with decreasing tube diameter. In semiconducting tubes with <1 nm diameter, the π∗ band can slide into the bandgap, and make them metallic [35, 36].
1.2.2 Challenges in nanotube chemistry
Comparing a flask of nanotubes with an ordinary chemical system, a chemist faces the following challenges. First, nanotubes are insoluble in any solvent. Dispersions by using surfactants can be made with different stability, but sedimentation starts in a short time. To get a homogeneous dispersion, nanotubes must be covered strongly with surfactants (then usually it is impossible to get rid of them without re-bundling of the nanotubes) [37], functionalized with solubility-increasing side groups (this may completely change the original properties) [38,39], or modified by adsorption of charged species [40].
Second, a nanotube sample is a mixture of 10-100 different (n,m) nanotube types.
This varies with growing techniques and circumstances, even from batch to batch pre- pared by the same technique in the same lab. The nanotube composition can be more or less well determined by Raman spectroscopy using several lasers.
Third, nanotubes form close-packed bundles held together by van der Waals forces.
Tubes inside a bundle can be more difficult to reach by a reactant species. A particular tube could be highly reactive, but useless in a reaction which cannot unfold the bundle:
that tube will remain intact, and shows itself less reactive.
1.2.3 Reaction types and sites in nanotubes
A real nanotube has three different parts regarding the chemical reactivity:
• perfect sidewall: sp2 carbon atoms in a honeycomb lattice
• defects: sp3 carbon atoms, lack of atoms, Stone-Wales defects
• fullerene-like cap or an open end
Nanotube modifications can be divided into non-covalent, covalent and encapsula- tion methods. Non-covalent methods are usually used for increasing the solubility of the nanotubes, or further the adsorption of other functional molecules or particles.
Functionalization means collectively those reactions that provide a special func- tionality. Most of the chemical reactions on nanotubes are performed on buckypapers.
Buckypapers are thin sheets made of nanotubes by filtering nanotube dispersions. Na- notube bundles in the buckypaper form are oriented in 2D (because of the filtration), while in the powder form, they are oriented in 3D.
In the following a short summary of chemistry on carbon nanotubes is given:
Covalent chemistry
Covalent chemistry of nanotubes is very complex. The most evident is addition reactions to sidewalls (sidewall functionalization; addition reactions only) as it is shown in Figure 1.10, and adding –COOH or –[F]n groups to the ends and defects of the tube (defect functionalization; either addition or substitution reactions) as it is shown in Figure 1.11.
Noncovalent chemistry
Noncovalent functionalization is the most widespread modification of nanotubes used in applications. This covers usually wrapping by polymer- and biomolecules for special functionality, attachment and covering by surfactants to enhance solubility, attachment of molecules with π-systems by van der Waals and π − π interactions, inorganic nanoparticles (usually oxides of transition metals) via polymer wrapping.
The advantage of this type of modifications is that the original electronic structure of the tubes can be retained [43].
Figure 1.10: Summary of sidewall covalent chemistry of nanotubes [41].
Figure 1.11: Summary of defect functionalization through –COOH and –[F]n groups [42].
Encapsulation
Filling different species into carbon nanotubes (X@CNT) was reported first by Smith et. al. in 1998. They filled C60 into nanotubes [44]. Since then, several organic molecules, metal organic complexes [45, 46], metal clusters [47], endohedral fullerenes etc. [43] were also used for encapsulation. Nanotubes can be used asnanoreactors for oriented reactions, like polymerization, fabrication of nanoribbons [48, 49], and double- walled carbon nanotubes [50].
In the following I will focus on those two reductive addition reactions which were used in the frame of this work.
1.2.4 Classical and modified Birch reduction
Birch reduction was developed by A. Birch in 1946-1949 for the hydrogenation of aromatic compounds, especially benzene [51, 52].
The base of the reaction is the dissolution of alkali metals in liquid ammonia (thus they are also referred to as dissolving metal reductions) by producing ”solvated elec-
trons”: these are the blue colored complexes of [M(NH3)6]+e−, where M=Li, Na or K [53]. These complexes act as very strong and selective reducing agents.
The mechanism of the classical Birch reduction is shown in Figure 1.12. The main steps are the addition of an electron to the aromatic system resulting in a carbanion and a radical in para position. The carbanion part reacts with electrophilic agents, like protons, alcohols, carbocations resulting in a saturated C atom and a newly formed carbanion also in para position. This carbanion can also react with electrophilic agents.
Figure 1.12: The mechanism of the classical Birch reduction [6].
In modified Birch reductions, the primary reducing agents can be other complexes, for example radical anions formed from aromatic compounds like naphthalene. By using different solvents and circumstances, these reactions can be directed well and used for reductive addition reactions of aromatic and conjugated electronic systems.
1.2.5 Alkali metal intercalation
The existence of graphite intercalation compounds (GICs) and the need of tuning electronic properties of carbon nanotubes have given the motivation for n-doping of nanotubes: charge transfer reactions with electron donors and synthesizing alkali metal intercalated carbon nanotubes [54–58].
Intercalation is different from the above mentioned encapsulation. Encapsulation happens inside the hollow of an individual nanotube, but intercalation happens in a nanotubebundle, the intercalating species are located between the individual tubes in the interstitial channels.
Alkali metal intercalated nanotubes are at least as air- and water sensitive as al- kali metals themselves. Intercalation can be achieved by electrochemical and simple chemical means [59, 60]. One of the first observations was the work of Nalimova et al. [61]. They reacted Li with carbon nanotubes in large excess at room temperature in ultrahigh vacuum. Li intercalation was proved by XRD and IR studies. They pointed out that using Li in excess may lead also to the insertion of Li into the hollow of the individual tubes (encapsulation).
Suzuki et al. studied K and Cs intercalation at room temperature [62]. They found that intercalation into the bundles is reversible and has an equilibrium value of KC24, CsC24 and CsC8.
Bower et al. showed the reversibility of intercalation and structural disorder by TEM and EELS measurements [63].
After investigating the structure and conduction properties of alkali metal interca- lated nanotubes, and the reversibility of the process, Pichler et al. determined more precisely the electronic spectra of K-intercalated materials paying attention to the origi- nally unoccupied electronic states. They found that the electronic and optical properties can be well described within the frame of a simple Drude-Lorentz model [64, 65].
The first review of nanotube intercalation was provided by J. E. Fischer [66]. He suggested a model with chain-like structure in the triangular and hexagonal channels between the tubes. The structural parameters are determined by the size of interstitial channels and the Coulomb repulsion between the alkali ions. Alkali metal intercalation destroys crystallinity, although the process is almost completely reversible.
Bendiab et al. studied possible Rb positions and Rb-doped nanotube bundles by X-ray and neutron diffraction and used ab initio calculations [67]. They found that the most probable and energetically favorable positions for a single Rb ion are the interstitial channels between three tubes in the bundle. Reaching saturation (RbC8), these sites will be no longer available, and the outer surface of the bundles becomes preferential for further Rb uptake.
Diameter-selective doping was presented by Kukovecz et al. [68]. They showed by resonant Raman spectroscopy and conductivity measurements that the intercalation of potassium depends on the diameter of nanotubes. They studied pulsed laser vapor- ization (PLV) and HiPco tubes (1.2-1.4 and 0.8-1.2 nm diameter, respectively). From radial breathing modes (RBM) of the Raman spectra, they found that the doping level showed reversed dependence on the tube diameter below a certain limit. They calcu- lated the required relative lattice expansion as a function of tube diameter (the size of intertube channels naturally increases with increasing tube diameter). From these data they obtained that above 1.4 nm tube diameter there is no need for lattice expansion.
Between 1.4 and 0.7 nm diameter larger and larger lattice expansion is required. Be- low 0.8 nm, the energy gain of charge transfer is not enough for covering the energy requisite, and hence, the intercalation becomes hindered and unfavorable.
Kukovecz et. al. also observed an unexpected intensity loss in the RBM region of small diameters. They explained this by the higher dopant/C ratio (decreasing number of C atoms per unit length in smaller diameter tubes), higher quenching of resonance of nanotube dopants and the increasing stacking of smaller diameter tubes. Because of the smaller number of C atoms per unit length in thinner tubes, the secondary interactions are weaker, thus they can be more easily pushed apart by the dopants. Because of these competing effects, they expected a minimum in doping level for K between 0.9-1.2 nm tube diameter.
Vigolo et al. investigated K, Rb and Cs-intercalated nanotube bundles and their dispersibility by Raman spectroscopy and transmission electron microscopy [69]. By alkali intercalation, SWNT dispersibility in dimethyl-sulfoxide (DMSO) increased in- dicating debundling process and charge transfer. Debundling was confirmed by TEM images.
Debundling and resulting increase in the volume of a buckypaper sample was also described by Tanaike et al. [70]. Swelling, like in GICs, and highly increased solubility in DMSO was detected caused by electrochemical intercalation of Li ions.
In summary, intercalation of nanotubes by alkali metals is extensively studied and also a practically interesting field of nanotube science. However, covalent chemical reactions of alkali metal intercalated nanotubes have not yet been published.
1.3 Optical spectroscopy of carbon nanotube thin films
Optical spectroscopy is beyond doubt one of the most important and useful tech- niques to investigate material systems. It is based on the interaction of electromagnetic radiation with matter. Electromagnetic radiation transmits energy to the system un- der consideration. The system absorbs an exact amount of energy depending on the relation between its intrinsic properties and the electromagnetic radiation. Here we con- sider optical spectroscopy in the far infrared-ultraviolet range of the electromagnetic spectrum (λ=400µm–190 nm; E=3.1 meV–6.5 eV). Absorbing these energies changes the rotational, vibrational and/or electronic states of the system.
The response to electromagnetic radiation is determined by the system’s micro- scopic (molecular, electronic and crystal structure) and macroscopic properties (shape, thickness, heterogeneity etc.).
1.3.1 The Drude-Lorentz model [24, 71]
The Drude-Lorentz model is a very simple, commonly used model to describe optical functions of solids, and based on the damped harmonic oscillator model. Due to the scales (optical wavelengths are much larger than atomic distances), both light and matter can be treated classically.
When describing electronic transitions, we start from the band structure. Optical transitions inside a band (like behavior of free electrons in metals) can be described by the classical Drude model. Excitationsbetween the bands are modeled by a sum of Lorentz oscillators. Both vibrational and electronic excitations can be discussed within the framework of the dielectric formalism.
When light interacts with matter, it can be reflected and absorbed, and the residual amount will be transmitted. We can measure the reflected and transmitted light in- tensity relative to the incident intensity (IR/I0 andIT/I0, respectively). The absorbed intensity, IA/I0 can be calculated by using the relations between the intensities given by Equation 1.5:
I0 =IR+IT +IA (1.5)
To describe light absorption in non-magnetic insulators, bound electrons can be modeled as damped harmonic oscillators excited by the E = E0eiωt electric field (Lorentz-model):
med2r
dt2 +meγdr
dt +meω02r=eE (1.6)
where e is the charge, me is the mass of electron, r is the momentary deflection, γ is the damping, ω0 is the excitation frequency.
The solution of Equation 1.6 is:
r(ω) = eE
me(ω02−ω2−iωγ) (1.7)
The dielectric function of the Lorentz oscillator, which describes its response to the exciting electric field:
r(ω) = 1 + e2 0me
1
ω02−ω2−iωγ (1.8)
where0 is the dielectric constant of vacuum.
In real systems, high frequency excitations also contribute to the dielectric function, that can be considered as a constant (∞):
r(ω) =∞+ e2 0me
1
ω02−ω2−iωγ (1.9)
Metallic electrons are considered in this so-called Drude-Lorentz dielectric function as oscillators with zero excitation frequency. Further generalization to the case of many oscillators (N oscillators in unit volume taking part in the j-th excitation):
r(ω) =∞+ e2 0me
X
j
Nj ω20j−ω2−iωγj
(1.10)
1.3.2 Calculation of optical functions
The dielectric function, and therefore all optical functions (refractive index, optical conductivity etc.) are complex quantities. The real and imaginary parts of the Drude- Lorentz dielectric function are:
=0+i00 (1.11)
0r =∞+ e2 0me
ω02−ω2
(ω20 −ω2)2+ω2γ2 (1.12)
00r = e2 0me
ωγ
(ω02−ω2)2+ω2γ2 (1.13) The complex refractive index ˆN and the complex optical conductivity ˆσ are defined by Equations 1.14 and 1.15, respectively:
Nˆ =√
r =n−iκ (1.14)
ˆ
σ(ω) = [ ˆr(ω)−0]ω
i (1.15)
In Equation 1.14, the real part of the complex refractive index (n) is in connection with reflectance (change in the phase), and imaginary part,κis in connection with the exponential decrease of the amplitude.
The well-known and widely used Beer’s law makes connection between the optical density D calculated from the transmittance T (T = IT/I0), the concentration c and the thicknessd of the sample:
D=−logT =cd (1.16)
where is the extinction coefficient.
Beer’s law is valid only for sufficiently low concentrations and when reflection can be neglected. In this caseD =A, where A is the absorbance.
In our case, the simple Beer’s law is not sufficient. On the one hand, nanotube sam- ples always contain metallic tubes. Their reflectance is not negligible in the far-infrared region, and has an effect even in the near-infrared region. The relevant information from our point of view is mostly in the near-infrared part of the spectra. On the other hand, the Drude-Lorentz fit of the complex dielectric function (or any other optical functions) will be proper, relevant and contain every information if both the real and the imaginary parts are known.
In order to get both components of the complex optical functions of our samples, we apply the single layer model, which works well for self-supporting nanotube thin films, the form of samples measured in our experiments.
The single layer model describes the transmittance of a layer with finite thick- ness d, and with parallel surfaces surrounded by vacuum. Inside the layer multiple reflection-transmission events happen. The sum of these events appear in the transmit- ted intensity, IT.
The transmittance of a single layer:
T = IT
I0 =|t|2 (1.17)
wheret is the transmission coefficient.
t=|t|eiφ =√
T eiφ = 4 ˆN
(1 + ˆN)2e−iδ−(1−Nˆ)2e−iδ (1.18)
where δ = 2πωdNˆ, ω is the wavenumber of the exciting light, d is the thickness, ˆN is the complex refractive index of the layer [21, 24]
Thus, for obtaining the total optical function of the system, we need to know the thickness of the sample d and the phase φ. d is available experimentally: thickness of nanotube thin films can be measured by atomic force microscopy (see Experimental).
φ is experimentally unavailable, but under specific conditions (which luckily hold in our case) it can be calculated by using the Kramers-Kronig relations.
2 | Experimental
2.1 Objectives
As it was shown in the Introduction, carbon nanotubes form bundles of different tubes held together by van der Waals forces. The first step, when one applies chemical reaction to nanotubes is to bring reactants close to the tube surface, preferably to each and every one with equal chance.
This is quite well solved by forming negatively charged nanotubes through reduction reactions. When each tube becomes negatively charged, Coulomb repulsion will exfoli- ate the bundles. This phenomenon is well represented by Birch reductions [72–75]. In these reactions, ammonia, tetrahydrofuran and ethylenediamine are used as solvents, and lithium or potassium as reductive agents. After applying this step, electrophilic species can attack the so-formed carbanions and result in different functionalized ma- terials. A similar process happens in alkali metal intercalated graphite resulting in partially hydrogenated graphite [54, 76].
Following the example of graphite intercalation compounds, direct reduction by in- tercalating alkali metals into carbon nanotube bundles were applied [54, 70, 77]. Based on these results and the similar reactivity of graphite and carbon nanotubes, alkali metal intercalation is expected to exfoliate and reduce nanotube bundles. By this method, the step of carbanion formation during the reductive modification could be necessarily separated in space and time from the step of attachment of the functional group (unlike other Birch-type reactions) [78].
Nanotube Company Type Diameter range Mean diameter
(nm) (nm)
P2 Carbon Solutions O2-purified
1.2-1.7 1.60
arc-discharge
HiPco CNI Nanotechnologies CVD 0.8-1.3 1.08
CoMoCat CG SouthWest
CVD 0.57-1.17 0.90
NanoTechnologies
Table 2.1: Specific parameters of investigated single-walled carbon nanotubes.
When adding alkali metals to carbon nanotubes in excess, a stable phase (with composition KC27in case of potassium determined by XPS) is formed in a few minutes at 180 ◦C [79]. Over longer time a saturation concentration (about KC9 excluding encapsulation) is reached. Sidewall functionalization of the nanotubes may be able to proceed from phase KC27 by electrophilic addition.
The general selectivity of sidewall reactions in nanotubes is believed to be deter- mined principally by structural strain caused byπ-orbital misalignment on the curved surface, resulting in higher reactivity of smaller diameter tubes [32]. Taking into ac- count, however, that realistic nanotube samples consist of bundles, there are other important phenomena that must be considered, such as kinetics, steric effects and en- ergetics of all processes and intermediate products in a reaction.
In my thesis I studied reductive addition reactions of single-walled carbon nanotubes and SWNT bundles investigating the diameter and other selectivity of these reactions.
Several types of commercial single-walled carbon nanotubes were used as starting materials representing a wide diameter range, overall between 0.57-1.7 nm. Parameters of the starting nanotubes are summarized in Table 2.1.
The products were investigated by thermogravimetry-mass spectrometry (TG-MS),
1H-NMR spectrometry, Raman spectroscopy and wide range optical transmission spec- troscopy to obtain detailed information about the reactivity through composition, ther- mal and optical properties of the samples, with special attention to diameter selectivity.
For a more detailed comparison to hydrogenation by alkali metal intercalation, hy- drogenation of HiPco by modified Birch reduction, using K-naphthalenide in tetrahy- drofuran was also performed [74, 75]. HiPco nanotubes were also modified with n-butyl groups both by alkali metal intercalation and modified Birch reduction. All the control samples were studied by TG-MS and Raman spectroscopy.
2.2 Preparation
2.2.1 Materials
The following materials were used:
• SWNT: P2, HiPco, CoMoCat (Table 2.1, as received, without further purification)
• Solvents: toluene (VWR , 99.8+%, redistilled), tetrahydrofuran (VWR, 99.7+%, redistilled). Anhydrous solvents must be used during the syntheses, because both the alkali metals and the carbanions are air and water sensitive. Special care has to be taken all along the reactions. Air sensitive steps have to be performed in inert atmosphere. In our case we used an Ar-filled dry box. Toluene was cryo-distilled from Na-K alloy in a vacuum line. THF was redistilled from K-benzophenone.
• Reducing agents: K, Rb (Sigma-Aldrich, 98+%), naphthalene (Sigma-Aldrich, 99+%, as received)
• Reactants: methanol (VWR, 99.8+%, as received), 1-iodobutane (Sigma-Aldrich, 99%, as received)
• Filtering and washing: tetrahydrofuran, ethanol (VWR, 99.7+%, as received), 1:3 HCl:H2O, distilled water, acetone (VWR, 99.8+%, as received)
2.2.2 Synthetic routes
The functionalization method, which was inspired by exfoliated graphite intercala- tion compounds, is described below. The reaction scheme is shown in Figure 2.1.
Figure 2.1: Reaction scheme of reduction of nanotubes by alkali metal and subsequent addition of hydrogen (n-butyl) groups.
About 100 mg of as-received SWNT was first annealed in dynamic vacuum (10−6 mbar) at 250 ◦C for 12 hours, followed by transfer into an Ar dry box. In the dry box, alkali metal (potassium in case of P2 and HiPco and rubidium in case of CoMoCat) was added in a glass vial, keeping the carbon:alkali metal molar ratio 4:1.
The glass vial was sealed on a vacuum line. Annealing at 200 ◦C for 12 hours was enough for the alkali metal to intercalate into the nanotube bundles. Intercalation was indicated by the copper/gold color of the sample [80].
Subsequently, the intercalated sample was taken back to the dry box. The vial was opened and the intercalated nanotubes were put into a Schlenk-type flask with a funnel (Figure 2.2). 40 ml anhydrous toluene was added to the flask and 20 ml to the funnel. Toluene was used as an aprotic solvent to avoid side reactions with any other H source. Outside of the dry box, sonication was applied for 15 minutes to enhance the intercalation process. Next, 5 ml methanol was filled fast and carefully to the funnel. Methanol/toluene was added dropwise into the flask during sonication.
Sonication was continued for 2 more hours, and the mixture was left overnight. The sample was filtered on a Millipore nylon membrane filter (0.1 µm pore size), washed with ethanol, 1:3 HCl:H2O, distilled water, ethanol and acetone. Finally, it was dried in dynamic vacuum at 200◦C for 12 hours.
The product obtained this way was transferred back into the dry box. The whole process described above, except the initial annealing, was repeated two more times in order to investigate whether it is possible to improve the degree of hydrogenation by applying successive steps.
The main products of reactions with methanol are hydrogenated nanotubes, but there are side reactions, such as hydrogen evolution, when attachment of H to the
Figure 2.2: The Schlenk-type reaction flask. In the flask, there are K-intercalated nano- tubes. It is clearly seen that they are not dispersed in the toluene, even after sonication, since they are negatively charged in a totally apolar solvent.
nanotube is kinetically hindered, or when the unreacted alkali metal reduces methanol directly. In case of reactions with 1-iodobutane, n-butylated nanotubes are the product.
Reference samples were made of pristine nanotubes by performing the same steps as at the hydrogenation reactions (initial annealing, annealing in sealed glass tube, addition of methanol, washing, annealing in dynamic vacuum),except for the addition of alkali metal.
The preparation using modified Birch reduction (the reaction scheme is shown in Figure 2.3) was started by a prior annealing of 100 mg of the as-received HiPco for 12 hours at 250 ◦C in dynamic vacuum (at 10−6 mbar). Subsequently, the nanotubes were transferred into the dry box. The same Schlenk-type flask as for alkali metal in- tercalation was used for the reaction. Naphthalene and potassium were dosed in excess.
Then THF was added both to the flask and to the funnel (100 ml and 20 ml, respec- tively). The sample was left for 15 min. Meanwhile potassium reacted with naphthalene and composed a dark green complex. This complex reduced the nanotubes to carban- ions in an equilibrium process. Then the flask was sonicated for 15 min to loosen the nanotube bundles and to promote the carbanion formation. 5 ml methanol was added to the funnel. The reactant was added slowly, dropwise during continuous sonication.
The reaction is quite fast, indicated by the almost instant disappearance of the green
Figure 2.3: Reaction scheme of hydrogenation (n-butylation) of nanotubes by modified Birch reduction.
color of the complex. Small bubbles were also observed, indicating the hydrogen evo- lution from the side reaction of potassium and methanol, and their excess. Sonication was kept going for 1 more hour. The sample was left overnight. The same filtering and washing procedure was applied as after the alkali metal intercalated reaction, but completed by a step of washing with THF.
Using HiPco, two more series of samples were prepared. By potassium intercala- tion and by modified Birch reduction, following the processes described above, n-butyl groups were attached to the HiPco nanotubes. The reagent was 1-iodobutane instead of methanol. Three successive steps were also performed.
2.3 Characterization
In this section I present the methods that were used for sample characterization.
The conclusions are based on the results of thermogravimetry-mass spectrometric and wide range optical measurements, while Raman spectroscopic and 1H-NMR results support well the main results of the former techniques.
2.3.1 Raman spectroscopy
Raman studies were carried out to detect changes in theD/Gmode intensity ratio of the samples. This gives information about the formation of defects (like sp3 carbon atoms in the sidewall), thus indirectly about the success of the reactions (Section 1.1.6).
Raman spectra were taken by a Renishaw 1000B spectrometer using 785 nm excita- tion wavelength, with 4 cm−1 spectral resolution. The laser power was kept sufficiently low in order to exclude heat damage (2.5 mW/µm2).
2.3.2 Thermogravimetry-mass spectrometry
Thermogravimetry-mass spectrometry is widely used to determine the composition and thermal stability of samples. The main point of the measurement is to determine the mass loss of a sample as a function of temperature. The thermal decomposition products are introduced into a mass spectrometer to determine their composition and their contribution to the mass loss. On the basis of these data conclusions can be drawn on the structure of the sample from the TG (thermogravimetric) and DTG (derivated thermogravimetric) curves by obtaining the contribution of the single fragments.
In the case of our samples, TG-MS data give information about the side group content and thermal stability, which is determined by the diameter of the tube. From these data we could draw conclusions about the efficiency and the diameter selectivity of the reactions.
Measurements and data evaluation were done by Emma Jakab in the Institute of Materials and Environmental Chemistry, Research Centre for Natural Sciences.
Mass change with temperature is directly measured by a Perkin-Elmer TGS-2 ther- mobalance and a HIDEN HAL 2/301 PIC quadrupole mass spectrometer. 2-4 mg sam- ple in a Pt vessel was heated up to 800 ◦C with 20 ◦C/min rate in Ar atmosphere. A portion of the volatile products was introduced into the mass spectrometer (operated at 70 eV in electron impact ionization mode) through a heated glass-lined steel cap- illary. Ion intensities were normalized to 38Ar isotope of the carrier gas to eliminate errors resulting from the shift in MS intensities. To measure hydrogen (m/z = 2), a calibration with TiH2 is necessary. During the measurements, signals of 16 ions can be followed.
2.3.3
1H-NMR spectrometry
For quantitative determination of H-content, 1H-NMR spectrometry can be well used. Unlike TG-MS, NMR measures together all the1H atoms, which are also present in the residual solvents (toluene, water, ethanol, acetone etc.) and water condensed
from the air, and a very little amount can come also from the sample holder. Therefore it is very important to correct with the H-content of a carefully produced reference sample.
Wide line 1H-NMR measurements and data evaluation were performed by M´onika Bokor, Tam´as Vereb´elyi and K´alm´an Tompa in the Institute for Solid State Physics and Optics, Wigner Research Centre for Physics.
Measurements and data acquisition were accomplished by a Bruker AVANCE III NMR spectrometer at the frequency of 82.4 MHz with a stability better than ±10−6. The inhomogeneity of the magnetic field was 2 ppm. Free induction decays (FIDs) were measured at room temperature. Known amounts (weight) of the nanotubes (typically 7-15 mg of P2 and CoMoCat, 2-3 mg of HiPco samples) or adamantane (99+%, Sigma- Aldrich) were put in Teflon capsules. The FID measured on the empty capsule was subtracted from the FID of the actual capsuled sample to correct for background. The amplitude of the FID at zero time is proportional to the number of 1H nuclei in the sample [81]. The first 9-10µs of the FID was lost in the dead time of the spectrometer.
The observed FIDs were extrapolated back to zero time by fitting Gaussian functions to obtain its zero-time amplitude. The FID of adamantane was used for calibration in calculating the hydrogen concentrations. There were residual magnetic catalyst parti- cles in the samples (typically 2-5 w/w%), but they did not disturb the measurement significantly [74].
2.3.4 Wide range transmission spectroscopy
Wide range optical transmission measurements on carbon nanotube self-supporting thin films combined with Kramers-Kronig transformation and fitting with the Drude- Lorentz model give detailed information about the optical transitions in the sample.
From these results, quantitative information can be obtained of the contributions of tubes with different diameters. Since addition reactions remove electrons from the nano- tube’s sp2 electronic system, the peak intensity of transitions related to those electrons will decrease. With proper data evaluation this decrease can be quantitatively deter-
![Figure 1.3: The three main groups of SWNTs. The translational period is indicated [6].](https://thumb-eu.123doks.com/thumbv2/9dokorg/872167.46910/15.892.145.770.104.569/figure-main-groups-swnts-translational-period-indicated.webp)

![Figure 1.7: By plotting the energy of electronic transition vs. tube diameter, the so called Kataura plot can be obtained [23]](https://thumb-eu.123doks.com/thumbv2/9dokorg/872167.46910/22.892.261.663.110.436/figure-plotting-energy-electronic-transition-diameter-kataura-obtained.webp)
![Figure 1.8: General Raman spectrum of an SWNT sample [6].](https://thumb-eu.123doks.com/thumbv2/9dokorg/872167.46910/23.892.261.658.137.446/figure-general-raman-spectrum-swnt-sample.webp)
![Figure 1.9: Diagrams of (a) metallic (5,5) SWNT, (b) pyramidalization angle (θ P ), and (c) the π-orbital misalignment angles (φ) along the C1-C4 bond in the (5,5) SWNT and its capping fullerene, C 60 [32].](https://thumb-eu.123doks.com/thumbv2/9dokorg/872167.46910/25.892.203.630.111.394/figure-diagrams-metallic-pyramidalization-orbital-misalignment-capping-fullerene.webp)
![Figure 1.10: Summary of sidewall covalent chemistry of nanotubes [41].](https://thumb-eu.123doks.com/thumbv2/9dokorg/872167.46910/28.892.183.731.214.984/figure-summary-sidewall-covalent-chemistry-nanotubes.webp)
![Figure 1.11: Summary of defect functionalization through –COOH and –[F] n groups [42].](https://thumb-eu.123doks.com/thumbv2/9dokorg/872167.46910/29.892.179.739.102.468/figure-summary-defect-functionalization-cooh-f-n-groups.webp)
![Figure 2.4: Self-supporting thin film preparation. a) filtering; b) filtrate on soluble membrane filter; c) transparent self-supporting thin film [24].](https://thumb-eu.123doks.com/thumbv2/9dokorg/872167.46910/47.892.248.665.110.320/figure-supporting-preparation-filtering-filtrate-membrane-transparent-supporting.webp)

