growth of glial cells in vitro
Ágnes Szabó 1,2, Hanna Liliom3, Zoltán Fekete1*, Katalin Schlett3, Anita Pongrácz4
1 Research Group for Implantable Microsystems, Faculty of Information Technology & Bionics, Pázmány Péter Catholic University, Hungary
2 Roska Tamás Doctoral School, Faculty of Information Technology & Bionics, Pázmány Péter Catholic University, Hungary 3 Neuronal Cell Biology Research Group, Department of Physiology and Neurobiology, Eotvos Loránd University, Hungary 4 Microsystems Laboratory, Centre for Energy Research, Hungary
* Correspondence: fekete.zoltan@itk.ppke.hu; (Z.F.)
Abstract: Tailoring the surface topography of neural implants holds great potential for directing the controlled, healthy evolution of the surrounding cells. Neuronal survival depends on the glial reaction to the implants, therefore the response of glial cells to the physical properties of the artificial interfaces is under intensive investigation. In this study, astrocytes were cultured on micropatterned SU-8 surfaces (micropillars, microstripes, and micromeanders) for 24 and 48 hours and examined the reaction of the cell nuclei. The cell nuclei were examined in view of cell number, average nucleus area, orientation, and elongation using fluorescent microscopic images. The created patterns had an apparent influence on the nucleus area.
Microgrooves helped guide cell nuclei and induced higher elongation rates than micropillars. The results suggest that SU-8 based micropattern has an impact on the size and alignment of astrocyte nuclei even shortly after of attachment.
Keywords: SU-8; topography; micropattern; astrocytes; cell nuclei
1. Introduction
The diagnostic and therapeutic role of neural implants in the clinical setting is increasing. One of the key issues in the rapidly evolving field is how we can mitigate the inflammatory response of the surrounding tissue, which deteriorates the long-term functionality of implants. The most investigated possibility is to imitate the extracellular matrix (ECM) by modifying the chemical or physical properties of the device. The ECM presents essential molecular and topographical cues to cells, which regulate adhesion, cell growth, and cellular connections within the tissue [1]. In neural tissue, the environment of the neurons is defined mostly by the glial cells. These cells are responsible for the protection of neurons, nutrition, or neurotransmitter balance [2, 3, 4].
Astrocytes play an important role in the evolution of the glial scar, as well. In response to an implant entering the cell, astrocytes and microglial cells initiate tissue encapsulation, which isolates the recording sites of a neural probe from the healthy neurons [5], and eventually inhibits long-term measurement or efficient electric stimulation.
It is under investigation whether micro- and nanofabricated electrode surfaces could reduce this effect.
Biomaterial surfaces can be patterned by photolithography, microcontact printing, microfluidic patterning, or electrospinning [6]. The most extensively examined parameters are the geometry, roughness, orientation, spatial resolution of the surfaces because these parameters can be easily engineered. To create highly biocompatible devices showing long-term stability, the response of nearby glial cells to various materials and topography is essential [7, 8, 9]. Submicron-scale topography can be created using laser holography [10]. Human astrocytes can attach to the produced surface relief grating and this pattern affects the elongation of the cells even at a shallower, 250 nm depth groove. Lee et al. studied C6 glioma cells on nanodot arrays based on tantalum nitride thin films [11]. Between the range of 10 to 200 nm dot diameter, the presence of 100-200 nm nanodots causes reduced formation of focal adhesion, decelerated gap junction protein Cx43 transport, and reduced branch point and mesh numbers. To reduce astrogliosis, nanoporous gold was also suggested by Chapman [12]. The length scale of the nanoporous gold is tunable. By changing the topography, astrocytic coverage can be reduced, while maintaining high neuronal coverage. The random topography of the nanoporous gold surface also inhibits the spreading of astrocytes. The effect of changes in topography was also examined in case of electrospun fibers, where the diameter dependency was investigated [13]. Researchers found a significant increase in astrocyte elongation in the presence of 808 nm in diameter fibers. Due to this elongation, the neuroprotective properties of the glial cells have increased.
Many research groups investigate the effect of surface morphology on cell shape or on the cytoskeleton.
At the same time, investigating nucleus deformation can provide novelty, since the nucleus deformation regulates gene expression [14]. In astrogliosis research, it is advantageous to examine changes in nucleus size because “the area of the nucleus is directly proportional to the state of reactivity of the astrocyte” [15]. It has been reported that the cell nucleus also reacts to microstructured surfaces since it shows viscoelastic properties [16]. Due to the interconnected network that the cytoskeleton forms around the nucleus, the nucleus shows deformation caused by cytoskeleton attachment [17]. To control the nucleus by the alteration of topography, bone marrow stromal cells were seeded onto poly(d,l-lactide-co-glycolide) micropillars [18]. The results show that the topography determines the nucleus orientation and that strain has a negligible effect. The connection between cell nucleus deformation and cytoskeleton attachment enables analyzing only the nucleus to study topographical effects. Nucleus detection is an easier task since the shape of the nuclei is more homogenous than the cytoskeleton. Therefore, nucleus detection can be automated and data analysis is less time-consuming.
Our paper shows the effect of the SU-8 micropattern on astrocyte nuclei shortly after the surface attachment of the cells. The biocompatibility of SU-8 has been examined in detail by KV Nemani [19] and its biocompatibility with the central nervous system has also been investigated [20]. Patterning of this polymer is feasible using traditional microlithography techniques [21, 22], which allows a low-cost fabrication. SU-8 also suitable to form diverse type of structures [23]. The easy detection of the cell nucleus and its important role in
cell reaction to the topography motivates our current study. We provide insight into the orientation, elongation, and attachment of glial cell nuclei on a micron-scale pillar, stripe, and meander patterns in vitro with underlying SiO2 (native oxide of bare silicon surfaces) as reference surface. This reference choice allows examining the case to equip the surface of silicon based neural interfaces with additional SU-8 microstructures to improve and investigate cell guiding properties.
2. Materials and Methods 2.1. Design of test surfaces
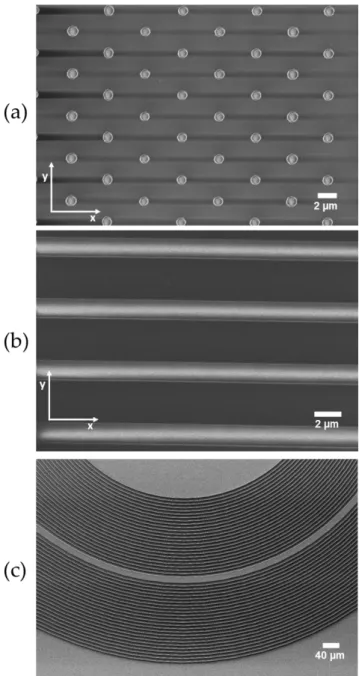
Three different micropattern (micropillars, microstripes, micromeanders) designs were created with similar size parameters (see Figure 1). Micropillars are columnar structures ~5.7 µm high, 2 or 5 µm in diameter with an inter-pillar distance of 3/5/10 µm. Microstripes are stripes 2 or 5 µm wide, spaced 3/5/10 µm.
Figure 1. Scanning electron microscope images of SU-8 micropatterns for controlled study of glial cell growth.
(a): micropillars; (b): microstripes; (c): micromeander. Y and x represent the orientation axes.
A third pattern, called a micromeander consists of parallel curved stripes where the width is 2 or 5 µm and the spacing of troughs is 5 µm. . A representative SEM image about the whole structure is showed in the supplementary material (Supp. Figure 2). During the manufacturing of the micromeander a group of the dimensions of the patterns presented earlier has been used. The aim of the micromeander was to investigate the orientation of the curved line. The examination of the effects of the dimensions in the presence of lines was performed in the case of microstripes.
These 3 pattern types are organized on chips of 7.1 by 7.1 mm, which also contain smooth, unpatterned areas of SiO2 as control surfaces. Each chip contains one pattern type with all possible parameter combinations.
The used pattern height (~5.7 µm) is sufficiently large to have an impact on the cell nuclei. Based on the article of Pan Z. et al., a structure height over a critical height ( 5 µm) is beneficial to achieve self-deformation of cell nuclei [18]. The notation used in the following as 2/5 or 5/10 specify the line width or diameter of the structure as the first number slash the spacing with the second number. Representative tiled view images are showed in Supp. Figure 3.
2.2. Material and fabrication
Micropatterned surfaces were created on a 4” 380 µm thick (100) silicon wafer using SU-8 2005, a high contrast, epoxy based negative photoresist (Kayaku Advanced Materials, USA).
The silicon substrate was cleaned with nitric acid, followed by HF dip and a dehydration step for an hour at 300 C° to promote the adhesion of SU-8 on the wafer. SU-8 2005 was spin-coated at 2500 RPM for 30 s to form 5-6 µm thick layers. After a soft bake at 95C° for 2 minutes, the material was relaxed for 20 minutes before photolithography. Patterns were transferred in an MA6 Mask aligner (Süss Microtec SE, Germany) using chrome photomasks and 100 mJ/cm2 exposure dose. Post-exposure bake was performed at 95 C° for 10 minutes and was followed by another relaxation step. After developing the pattern, a hard bake was completed at 150 C° for 30 minutes in a convection oven. The used temperatures and time parameters are consistent with the published datasheet of SU-8 2005 [24].
2.3. Cell culture
Primary astrocytes were prepared from 3-day-old mouse CD1 pups according to the method described in [25]. Cultures were maintained in HDMEM (Merck KGaA, Germany) with 10% FCS (Gibco), 2 mM glutamine (Merck KGaA, Germany), 40 μg/ml gentamicin (Hungaropharma Ltd, Hungary), and 2.5 μg/ml amphotericin B (Merck KGaA, Germany). Cells were passaged twice using 0.05% trypsin - 0.02% EDTA (Merck KGaA, Germany) before being seeded onto the test surfaces. Test surfaces were sterilized at 180°C for 4 hours and placed in 24-well culture plates under aseptic conditions. No additional surface treatment was applied.
Astrocytes were seeded at starting densities of 21.000 cells/cm2. Cultures were kept at 37°C in a 5% CO2
atmosphere and fixed with 4% PFA (20’, RT).
2.4. Imaging cell nuclei
Fixed cells were permeabilized using 0.1% Triton-x-100 in PBS for 5’ at RT, followed by blocking with 2% bovine serum albumine in PBS. Nuclei of the cultured cells were stained with DAPI (4′,6-diamidino-2- phenylindole) and images were taken at 24 and 48 hours after seeding using a fluorescence microscope (Zeiss Axio Observer.Z1).
The microfabricated chip surfaces were analyzed with scanning electron microscopy (SEM) using a Zeiss LEO 1540 XB microscope. Samples were rinsed with 0.1 M cacodylate buffer (pH 7.4) and fixed with 2.5%
glutaraldehyde and 5% sucrose in 0.1 M cacodylate buffer for 48 hours. Rinsing with 0.1 M cacodylate buffer was repeated three times, followed by 20- 20 minutes rinses with 50 %, 60 %, 75%, 90 % and 100% ethanol.
Samples were then immersed in amil-acetate, which was left to evaporate in ambient air. Finally, samples were coated with a thin layer of gold by vacuum evaporation or cathodic sputtering. The gold coating was applied for samples investigated through microscopy and were not used anymore for cell culturing purposes. Th sample pictures are shown in Figure 2.
2.5. Image processing, data analysis
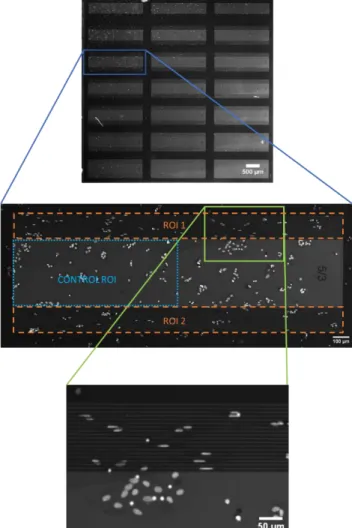
The fluorescence images were analyzed by a custom made, Matlab-based code with a graphical user interface (GUI). The program core was introduced in the supplementary material in [8]. The analysis began with the manual selection of the region of interest (ROI). For the statistical data analysis, selection of a control ROI over the smooth, SiO2 surface was required. Each pattern combination had a specific control ROI. The specific control ROI was selected between two patterned areas with the same pattern size (Figure 2).
Figure 2. ROI selection on fluorescence image and a magnified portion of the chip. One topography feature combination (in this case 5 µm wide stripes with 3 µm spacing; 5/3) has two ROIs and one control ROI. With
this method the control ROI area and the combined patterned ROI area are the same. The bottom image represents a part of the microstriped sample.
It was necessary due to the highly different cell numbers across one chip. This manual selection was based on the visual borders of the topography, represented in Figure 2. One chip contained two parts with the same pattern type, pattern width, and spacing. These areas had visible borders which helped to define the border of the ROIs (Figure 2 ROI 1 and ROI 2). Between these ROIs was the control area with a lighter shade on the fluorescent image. This selection protocol helps the user to create similar size patterned ROIs and control ROIs.
After the manual region selection, the image was processed, starting with segmentation. The detailed segmentation steps are shown in thesupplementary (Supp. Figure 1.)
The segmentation started with an adaptive thresholding step that separates the background from the foreground and gave a binary matrix as output. After the binarization, some non-cellular objects remained in the mask, mostly parts from the pattern or the borders between different surfaces. These elements formed the
“bad mask”, which is bigger than a cell nucleus, so it can be removed from the binary image based on the area and skeleton area. The next steps refined the segmentation more precisely. Morphological opening and small object removal removed cell debris and other contamination from the mask. The last step of the segmentation was the Watershed algorithm, that separates objects in close contact.
Orientation and eccentricity are the two main parameters used to evaluate the outline of the nuclei. The calculation of these parameters is based on the measurement of the Matlab built-in “regionprops” function. The orientation is the angle between the nucleus main axis and the pattern direction, as it is used in a previous study [26]. The lines of the microstripes unambiguously define the direction, the x-axis (Fig.1. panel (b)). In the case of micropillars, the horizontal line (x-axis) was defined as the reference line of the orientation (Fig. 1. panel (a)). The curved micromeander lines require circle ROI selection that gives the data for the orientation calculation. Based on the center points and the radii of the circles, the program calculates the angle of the tangent line in the center point of the detected object. The calculated orientation is the difference between the nuclei main axis angle and the previously calculated tangent line angle. The eccentricity is derived from the major axis length (Major AL) and minor axis length (Minor AL), as in [27]. The calculation method is:
𝐸𝑐𝑐𝑒𝑛𝑡𝑟𝑖𝑐𝑖𝑡𝑦 =2 ∙ √(𝑀𝑎𝑗𝑜𝑟 𝐴𝐿 2 )
2
− (𝑀𝑖𝑛𝑜𝑟 𝐴𝐿
2 )
2
𝑀𝑎𝑗𝑜𝑟 𝐴𝐿
(1)
This way, eccentricity of 0 indicates a perfect circle, and eccentricity of 1 indicates a line. Based on this definition the elements with an eccentricity greater than 0.5 were determined as elongated cells. The data were grouped by the feature sizes and paired with the related control data to normalize the data and enable the comparison of different featured surface effects. The normalized cell numbers were derived as the ratio of the
cell number of ROIs with pattern and the cell numbers of the corresponding control ROIs. This normalization was also applied to the area data.
2.6. Performance of the detection program
Since the image analysis is based on a custom evaluation code, error measurement was performed to prove the reliability of the analysis. The detection was examined at 10 randomly selected ROI. The performance is calculated from the number of correctly detected objects (true positive; TP) – including the separated overlapped nuclei – the number of erroneously detected objects (false positive; FP) – mostly not deleted larger fragments, or background residual pieces – and the number of non-detected, false negative (FN) objects. The 10 test ROIs was analyzed manually to quantify the error of the program. The 10 samples had overall 438 detected cell nuclei and the error measurement gave a 0.8541 precision and a 0.9305 recall based on the following, commonly used equations:
𝑃𝑟𝑒𝑐𝑖𝑠𝑖𝑜𝑛 = 𝑇𝑃
𝑇𝑃 + 𝐹𝑃 (2)
𝑅𝑒𝑐𝑎𝑙𝑙 = 𝑇𝑃
𝑇𝑃 + 𝐹𝑁 (3)
3. Results and Discussion
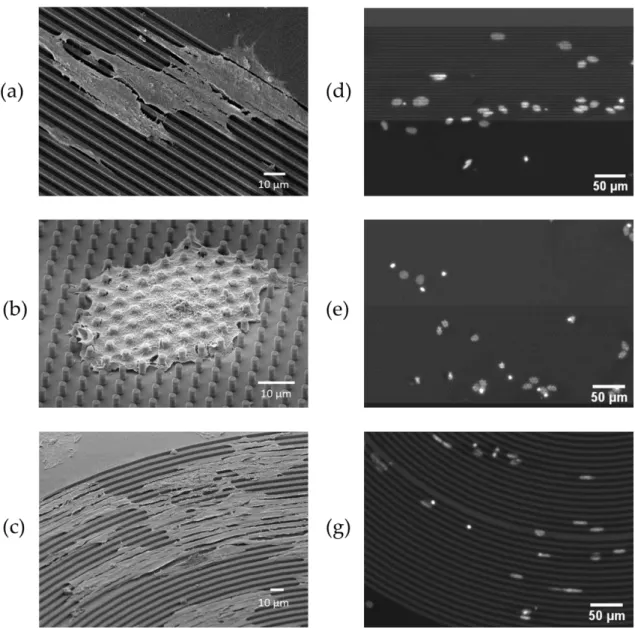
Figure 3 shows representative images of cultured astrocytes on various SU-8 micropatterns after 24 hours.
Panels (a)-(c) are SEM images of the cells on the three different micropatterns. The right-hand panels (e)-(g) show fluorescence images of the three micropatterns with stained nuclei. On the fluorescence images, the cell nuclei can be well-identified thereby these images can be used for analysis.
3.1. Adhesion and spreading of astrocyte nuclei on SU-8 micropatterns
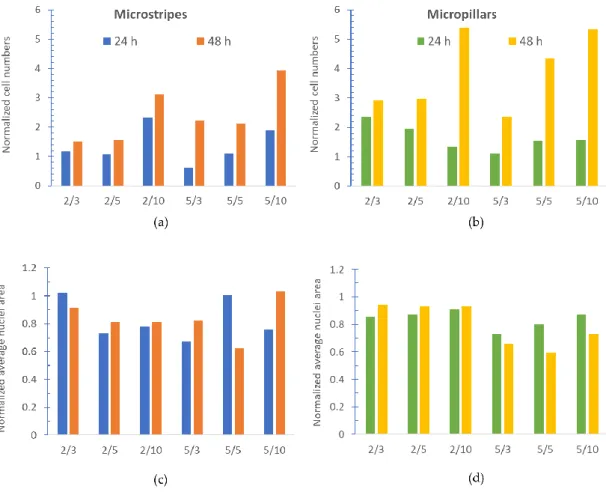
The diameter of the primary mouse astrocyte nucleus is within a 10-µm range. Former studies investigated the effects of smaller, 3 µm wide micropillars [18], and 30 µm parallel lines [28]. In the present study, we created patterns with 3, 5, and 10 µm spacing which are closer to the nucleus size range. Therefore, we expected to see actual effects on the chosen astrocyte nuclei. To investigate how astrocytes can attach to the surface, the cell number was counted and normalized to the smooth SiO2 control surface belonging to the specific parameter size pattern. The results are represented in Figure 4. (a-b) panels. The bars represent the cell number rate between the control surface and the patterned surface. With this method, we compensate the different cell density between samples.
Figure 3. Representative scanning electron microscope images (a-c) and fluorescence images (d-f) of the astrocytes on different micropatterns. 2 µm wide microstripes with 3 µm spacing (2/3) (a), (d); 2 µm in diameter micropillars with 3 µm spacing (2/3) (b), (e); micromeanders with 5 µm wide stripes with 5 µm spacing (5/5) (c), (f).
Since the area of the nuclei reflects the spreading of cells on a given surface and nucleus detection is more precise and can be easily automated, the average nucleus area was measured and normalized to the previously presented control surface. The results are shown in the panel (c) and (d) of Figure 4.
Figure 4. Cell numbers and average nuclei area data normalized to the control surface. The bars represent the ratio of the cell number on the patterned surface and the corresponding control surface. One panel shows one pattern type (microstripes or micropillars) with all topography sizes. Along the x-axis, columns are labeled in the following way: the first number indicates microstripes or micropillar width while spacing is represented by the second number (all in µm). Based on this, microstripes bar 2/5 means 2 µm wide microstripes with 5 µm spacing.24h or 48h fixation times are represented in different colors. (a):
normalized cell number by microstripes with different stripe width and spacing; (b): normalized cell number by micropillars with different diameter and spacing; (c): normalized average nucleus area by microstripes; (d): normalized average nucleus area micropillars. By the normalization, the results can be compared since the cell density is different on the different parts of the sample chip. The normalization by the control areas allows the comparison between the different feature sized areas.
The cell numbers compared to the control show that after 48 hours more cells can attach to any patterned SU-8 surface than to the flat SiO2 surface. The average nucleus area in the presence of microstripes and micropillars is smaller than on a smooth SiO2 surface. If we examine the cell numbers together with the average
nucleus size, we can conclude that the cells adhered to the patterned surface to a greater extent than to the flat control surface, but the patterns caused a smaller nucleus size.
The cell numbers and average nuclei area were also examined in the presence of micromeander. The results are represented in the supplementary material (Supp. Fig. 4.). Compare the cell nuclei on micromeander and on the microstripes we found no major difference in the trends.
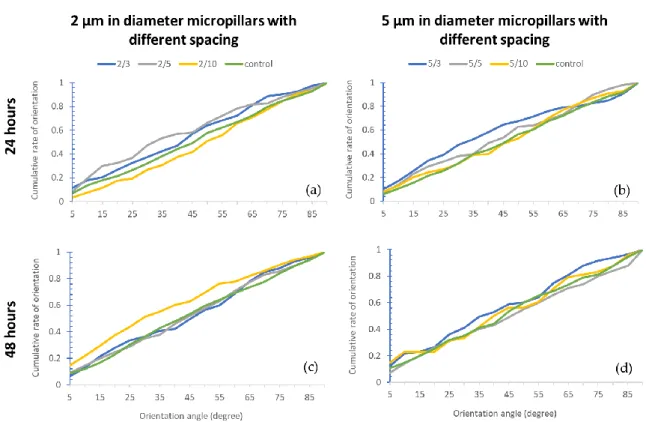
3.2. Nuclei orientation
The orientation of the cells is one of the most important parameters in case of the research of engineered culturing surfaces. There are a number of studies on the cytoskeleton alignment [29, 30, 31], but the alignment of the cell nucleus is a rarely addressed question. Although it gives less information about the cell, the automation of nuclei detection is an easier task than to automate the detection of the cytoskeleton, because of their more uniform shape. Figures 5 and 6 show the cumulative histogram of the orientation in the different parameter spaces and after the two different fixation times. The x-axis shows the angle between the main axis of the detected object and the microstripes direction (Figure 5) and the main axis and the x-axis (horizontal line) in case of the micropillars (Figure 6). Microstripes force more than 50 % of the cells to accommodate the pattern at an angle less than 15° with respect to pattern direction in case of all topographical parameters both after 24 and 48 hours. Based on a previous study [32], we considered these cells with less than 15° orientation angle as aligned cells. In the presence of micropillars, this angle distribution is even, so there is no favored topography that would alter the direction of the nuclei growth.
Figure 5. Orientation data on microstripes. The cumulative histogram of the angle between the nuclei main axis and the stripe direction in case of (a): 2 µm microstripes with different spacing and 24 hours fixation time;
(b): 5 µm microstripes with different spacing and 24 hours fixation time; (c): 2 µm microstripes with different spacing and 48 hours fixation time; (d): 5 µm microstripes with different spacing and 48 hours fixation time.
Figure 6. Orientation data on micropillar. The cumulative histogram of the angle between the nuclei main axis and the stripe direction in case of (a): 2 µm in diameter micropillars with different spacing and 24 hours fixation time; (b): 5 µm in diameter micropillars with different spacing and 24 hours fixation time; (c): 2 µm in diameter micropillars with different spacing and 48 hours fixation time; (d): 5 µm in diameter micropillars with different spacing and 48 hours fixation time.
We found that both 2 µm and 5 µm wide microstripes align the cell nucleus already after 24 hours. The 2 µm wide microstripes with 10 µm spacing have the greatest effect on orientation after the cell adhesion. This difference between the pattern effects ceases by the second day. Patterns with micropillars have no major effect on astrocyte nuclei compared to a smooth control surface.
Figure 7. Orientation data on micromeander and microstripes. The cumulative histogram of the angle between the nuclei main axis and the stripe direction in case of (a): different pattern dimensions (2/5, 5/5) after 24 hours fixation time; (b): different pattern dimensions (2/5, 5/5) after 24 hours fixation time. The letters M and S in the legends indicate microMeander and microStripes.
Comparing the orientation between microstripes and micromeander with the same pattern dimensions, similar trends are visible. The curvation of the micromeander has no main effects on the orientation of the cell nuclei.3.3. Nuclei elongation
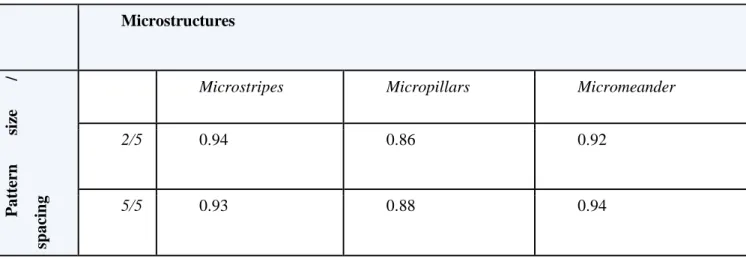
The cell reacts to the environment even in a smaller unit as the nucleus. Table 1. shows the nuclei elongation rate after 2 days. We defined the elongated elements as the nuclei that have at least 0.5 eccentricity value, defined in section 2.5. We compare the elongation rate between the 2 µm wide microstripes, 2 µm diameter micropillars and 2 µm wide micromeander data with 5 µm spacing (2/5) and also the different pattern types with 5 µm pattern width (and diameter in case of micropillars) and 5 µm spacing (5/5). These two parameter combinations were created with all three pattern types.
Table 1. Ratio of elongated nuclei in the presence of different microstructures.
Microstructures
Patternsize/ spacing
Microstripes Micropillars Micromeander
2/5 0.94 0.86 0.92
5/5 0.93 0.88 0.94
As we expected, the micromeander stripes have a great elongation effect on the nuclei. The microstripes resulted in a high rate of elongated nuclei. The results show that the linear surfaces, the microstripes, and the micromeanders cause large-scale elongation on astrocytes while the micropillars have a smaller impact on the nuclei elongation.
4. Conclusion
In this work, we investigated the effect of SU-8 micropatterns on parameters of astrocyte nuclei shortly after attachment in vitro. We showed that the surface effects can be studied due to the cell nuclei that allows a simple detection of fluorescent microscope images. The cell numbers and average nuclei sizes indicate that astrocytes can attach to the patterned SU-8 surfaces better than to the flat SiO2 surface and the patterns affect the nucleus sizes. The results suggest that the microgrooves orient the nuclei of the astrocytes even in an early stage of cell attachment, while micropillars do not influence the elongation of the attached cells’ nuclei. The elongation rate was examined with grooves, pillars and meander pattern and we found that the surfaces with linear elements as the microstripes, and micromeander elongate astrocyte nuclei by both 2 and 5 µm pattern width and 5 µm spacing. Although the presented SEM images suggests that the cells are suspended and spanning this article did not investigated this question. These phenomena cannot be examined based on the fluorescent images. To equip the surface of silicon based neural interfaces with additional SU-8 microstructures, one can improve the cell guiding properties and enhance the number of attached astrocytes. Orientating astrocyte nuclei maybe efficient with microstripes with 10 µm spacing. This study shows the pattern surface effects can be investigated due to the cell nucleus and astrocytes can attach differently to a patterned SU-8 surface and to a flat SiO2.
Acknowledgement
This work was supported by the Hungarian Scientific Research Fund (OTKA NN 116550), the Hungarian Brain Research Program (2017_1.2.1_NKP-2017-00002). A. Pongracz is thankful for the support of the Bolyai Fellowship. The support of the European Union through the grant EFOP-3.6.3-VEKOP-16-2017-00002 co- financed by the European Social Fund is also acknowledged. Á. Szabó is thankful for the KAP19-32003-3.3- ITK grants.
References
[1] K. Von Der Mark, J. Park, S. Bauer and P. Schmuki, Nanoscale engineering of biomimetic surfaces: Cues from the extracellular matrix, vol. 339, Springer, 2010, pp. 131-153.
[2] A. Schousboe, L. K. Bak and H. S. Waagepetersen, Astrocytic control of biosynthesis and turnover of the neurotransmitters glutamate and GABA, vol. 4, Frontiers, 2013, p. 102.
[3] M. V. Sofroniew and H. V. Vinters, Astrocytes: Biology and pathology, vol. 119, 2010, pp. 7-35.
[4] B. A. MacVicar and E. A. Newman, "Astrocyte regulation of blood flow in the brain," Cold Spring Harbor perspectives in biology, vol. 7, no. 5, p. a020388, 2015.
[5] W. F. Windle and W. W. Chambers, "Regeneration in the spinal cord of the cat and dog," Journal of Comparative Neurology, vol. 93, no. 2, pp. 241-257, 1950.
[6] C. Simitzi, A. Ranella and E. Stratakis, "Controlling the morphology and outgrowth of nerve and neuroglial cells: The effect of surface topography," Acta biomaterialia, vol. 51, pp. 21-52, 2017.
[7] Z. Bérces, K. Tóth, G. Márton, I. Pál, B. Kováts-Megyesi, Z. Fekete, I. Ulbert and A. Pongrácz,
"Neurobiochemical changes in the vicinity of a nanostructured neural implant," Scientific Reports, vol.
6, no. 1, pp. 1-11, 24 10 2016.
[8] H. Liliom, P. Lajer, Z. Bérces, B. Csernyus, Á. Szabó, D. Pinke, P. Lőw, Z. Fekete, A. Pongrácz and K.
Schlett, "Comparing the effects of uncoated nanostructured surfaces on primary neurons and
astrocytes," Journal of Biomedical Materials Research - Part A, vol. 107, no. 10, pp. 2350-2359, 2019.
[9] Z. Bérces, J. Pomothy, Á. C. Horváth, T. Kőhidi, B. É, Z. Fekete, E. Madarász and P. A, "Effect of nanostructures on anchoring stem cell-derived neural tissue to artificial surfaces," Journal of neural engineering, vol. 15(5), p. 056030, 2018.
[10] H. Baac, J. H. Lee, J. M. Seo, T. H. Park, H. Chung, S. D. Lee and S. J. Kim, "Submicron-scale
topographical control of cell growth using holographic surface relief grating," Materials Science and Engineering C, vol. 24, no. 1-2, pp. 209-212, 5 1 2004.
[11] C. H. Lee, Y. W. Cheng and G. S. Huang, "Topographical control of cell-cell interaction in C6 glioma by nanodot arrays," Nanoscale Research Letters, vol. 9, no. 1, pp. 1-11, 2014.
[12] C. A. Chapman, H. Chen, M. Stamou, J. Biener, M. M. Biener, P. J. Lein and E. Seker, "Nanoporous gold as a neural interface coating: Effects of topography, surface chemistry, and feature size," ACS Applied Materials and Interfaces, vol. 7, no. 13, pp. 7093-7100, 8 4 2015.
[13] C. D. Johnson, J. M. Zuidema, K. R. Kearns, A. B. Maguire, G. P. Desmond, D. M. Thompson and R. J.
Gilbert, "The Effect of Electrospun Fiber Diameter on Astrocyte-Mediated Neurite Guidance and Protection," ACS Applied Bio Materials, vol. 2, no. 1, pp. 104-117, 22 1 2019.
[14] K. Anselme, N. T. Wakhloo, P. Rougerie and L. Pieuchot, "Role of the Nucleus as a Sensor of Cell Environment Topography," Advanced Healthcare Materials, vol. 7, no. 8, p. 1701154, 28 4 2018.
[15] E. S. Ereifej, S. Khan, G. Newaz, J. Zhang, G. W. Auner and P. J. VandeVord, "Characterization of astrocyte reactivity and gene expression on biomaterials for neural electrodes," Journal of Biomedical Materials Research Part A, vol. 99A, no. 1, pp. 141-150, 1 10 2011.
[16] P. M. Davidson, H. Özçelik, V. Hasirci, G. Reiter and K. Anselme, "Microstructured Surfaces Cause Severe but Non-Detrimental Deformation of the Cell Nucleus," Advanced Materials, vol. 21, no. 35, pp.
3586-3590, 18 9 2009.
[17] P. M. Davidson, O. Fromigué, P. J. Marie, V. Hasirci, G. Reiter and K. Anselme, "Topographically induced self-deformation of the nuclei of cells: dependence on cell type and proposed mechanisms," Journal of Materials Science: Materials in Medicine, vol. 21, no. 3, pp. 939-946, 2010.
[18] Z. Pan, C. Yan, R. Peng, Y. Zhao, Y. He and J. Ding, "Control of cell nucleus shapes via micropillar patterns," Biomaterials, vol. 33, no. 6, pp. 1730-1735, 1 2 2012.
[19] K. V. Nemani, K. L. Moodie, J. B. Brennick, A. Su and B. Gimi, "In vitro and in vivo evaluation of SU-8 biocompatibility," Materials Science and Engineering: C, vol. 33, no. 7, pp. 4453-4459, 2013.
[20] G. Márton, E. Z. Tóth, L. Wittner, R. Fiáth, D. Pinke, G. Orbán, D. Meszéna, I. Pál, E. L. Győri, Z. Bereczki, Á. Kandrács, K. T. Hofer, A. Pongrácz, I. Ulbert and K. Tóth, "The neural tissue around SU-8 implants: A quantitative in vivo biocompatibility study," Materials Science and Engineering C, vol. 112, p. 110870, 1 7 2020.
[21] A. D. Campo and C. Greiner, "SU-8: a photoresist for high-aspect-ratio and 3D submicron lithography,"
Article in Journal of Micromechanics and Microengineering, vol. 17, pp. 81-95, 2007.
[22] R. A. J. G. a. D. W. Daunton, "Manipulation of exposure dose parameters to improve production of high aspect ratio structures using SU-8.," Journal of Micromechanics and Microengineering, vol. 22.7, p.
075016, 2012.
[23] S. Arscott, "SU-8 as a material for lab-on-a-chip-based mass spectrometry.," Lab on a Chip, vol. 19, pp.
3668-3689, 2014.
[24] "SU-8 2000.5-2015 Data Sheet," https://kayakuam.com/wp-content/uploads/2020/08/KAM-SU-8- 2000-2000.5-2015-Datasheet-8.13.20-final.pdf.
[25] K. Tárnok, L. Szilágyi, T. Berki, P. Németh, L. Gráf and K. Schlett, "Anoxia leads to a rapid translocation of human trypsinogen 4 to the plasma membrane of cultured astrocytes," Journal of Neurochemistry, vol. 115, no. 2, pp. 314-324, 10 2010.
[26] M. J. Dalby, M. O. Riehle, S. J. Yarwood, C. D. Wilkinson and A. S. Curtis, "Nucleus alignment and cell signaling in fibroblasts: Response to a micro-grooved topography," Experimental Cell Research, vol.
284, no. 2, pp. 272-280, 1 4 2003.
[27] K. Wang, A. Bruce, R. Mezan, A. Kadiyala, L. Wang, J. Dawson, Y. Rojanasakul and Y. Yang,
"Nanotopographical Modulation of Cell Function through Nuclear Deformation," ACS Applied Materials and Interfaces, vol. 8, no. 8, pp. 5082-5092, 2 3 2016.
[28] W. W. Ahmed, T. Wolfram, A. M. Goldyn, K. Bruellhoff, B. A. Rioja, M. Möller, J. P. Spatz, T. A. Saif, J.
Groll and R. Kemkemer, "Myoblast morphology and organization on biochemically micro-patterned hydrogel coatings under cyclic mechanical strain," Biomaterials, vol. 31, no. 2, pp. 250-258, 1 1 2010.
[29] T. Vignaud, L. Blanchoin and M. Théry, "Directed cytoskeleton self-organization," Trends in Cell Biology, vol. 22, no. 12, pp. 671-682, 1 12 2012.
[30] E. K. Yim, E. M. Darling, K. Kulangara, F. Guilak and K. W. Leong, "Nanotopography-induced changes in focal adhesions, cytoskeletal organization, and mechanical properties of human mesenchymal stem cells," Biomaterials, vol. 31, no. 6, pp. 1299-1306, 1 2 2010.
[31] H.-Y. a. Z. W. a. L. X. a. D. L. a. P. A. a. A. M. Lou, F. Santoro, A. F. McGuire, Y. Cui and D. G. a. o. Drubin,
"Membrane curvature underlies actin reorganization in response to nanoscale surface topography,"
Proceedings of the National Academy of Sciences, vol. 116, no. 46, pp. 23143-23151, 2019.
[32] S. Ankam, M. Suryana, L. Y. Chan, A. A. K. Moe, B. K. Teo, J. B. Law, M. P. Sheetz, H. Y. Low and E. K.
Yim, "Substrate topography and size determine the fate of human embryonic stem cells to neuronal or glial lineage," Acta biomaterialia, vol. 9, no. 1, pp. 4535-4545, 2013.