2.3 APPLICATION TO AND ADMISSION INTO UPPER- SECONDARY EDUCATION
Zoltán Hermann & Júlia Varga
The progression into secondary education has a fundamentally important effect on the future educational path of students, and consequently, their future career path in the labour market and their success (see for example Kézdi et al, 2008;
Horn, 2014, Makó–Bárdits, 2014, Hajdú et al, 2015). In past years, significant changes have been made in the schedules and contents of vocational training schools,1 which – combined with the changes in the labour market environ- ment – may influence students’ plans and opportunities regarding further edu- cation. In this subchapter, we present how the proportion of those applying to, and those admitted into, particular types of secondary schools changed between 2005 and 2017, and how the proportion of those applying to, and those admit- ted into, schools offering vocational training changed, by vocational groups.
The analysis is based on the data of the Information System – Secondary School Admission Database (KIFIR) on the period between 2005 and 2017.
This database contains the application and admission data of students applying for secondary education having completed the eighth grade of elementary school (or the fourth or sixth grade, in the case of eight- and six-year secondary schools).
Secondary schools rank applicants based on their elementary school and en- trance examination results. Taking these, and application priorities into consid- eration, a central admission algorithm determines which student gets admitted into which school. A small number of students do not get admitted into any of the schools via this application and admission process, because they applied only to schools that either rejected them outright or filled their numbers with applicants that ranked higher. These students will look for a school where they can continue their studies personally, but this database does not contain the results of that process. In the analysis, we presumed that these students would study in the school type with the lowest prestige in their application list, but at the same time, this group is not included in the analysis regarding the voca- tional groups. Their rate dropped from 8 percent in 2005 to 3 percent in 2017.
In the analysis, we present rates relative to the number of students studying in secondary education in the given school year. This is the sum of all appli- cants who had completed the eighth grade of secondary school (presuming that students who did not get admitted anywhere in the first round of the ad- mission process would also continue to secondary education) and the num- ber of students who gained admission to eight- or six-year secondary schools.
We did not take into consideration students applying unsuccessfully to eight- or six-year secondary schools, as they will go into secondary education after completing the eighth grade of elementary school.
1 One change worth highlight- ing is that the length of train- ing in vocational secondary schools (named vocational schools until 2016) has been re- duced to three years in 2013, re- placing the former 4- or 5-year training period. Since 2016, the proportion of vocational con- tent in the training material and of professional practice/
traineeship has increased sig- nificantly in vocational gram- mar schools (named vocational secondary schools until 2016), while the hours of general edu- cation subjects have seen a de- crease. First, state-managed vocational training institutions were transferred to the Minis- try of National Economy in 2015, which organised the vari- ous institutions into vocational training centres. Then in 2018, the Ministry of Innovation and Technology was appointed to be in charge of secondary vo- cational training institutions.
25 30 35 40 45
2005 2007 2009 2011 2013 2015 2017 0
1 2 3 4 5 6
2005 2007 2009 2011 2013 2015 2017
Instead of General secondary school: Vocational secondary school Instead of Secondary school: Vocational school
General secondary
school Vocational
secondary school Vocational school
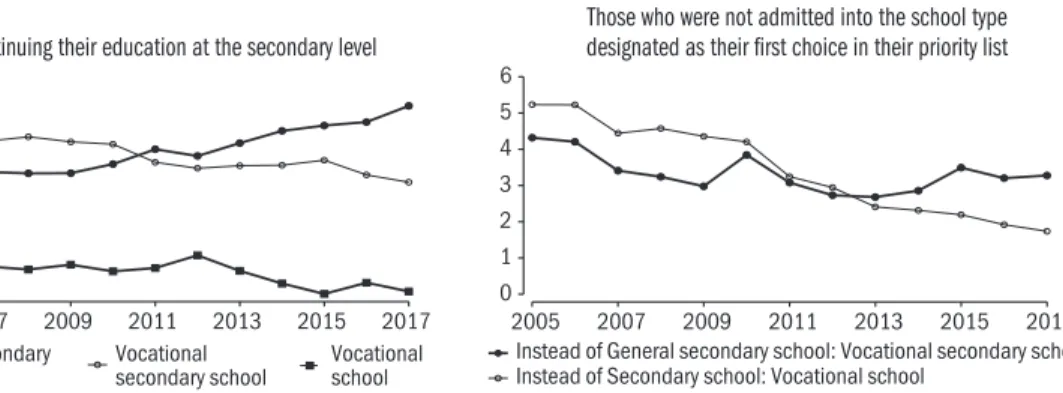
Figure 2.3.1 shows the changes in the shares of school types in secondary education (figure on the left); the proportion of students who were not ad- mitted into the school type designated as their first choice in their priority list; and the type of school they were admitted into instead of the school type designated as their first choice in their priority list (figure on the right). After 2012, the rate of applications to vocational schools started decreasing follow- ing the stagnation observed between 2005 and 2011, and by 2017, less than a quarter of students wanted to get admitted into this school type. The rate of applications to general secondary schools grew between 2009 and 2011, and then continued to grow after 2012; this is the school type in which the highest number of students wish to continue their studies. Vocational sec- ondary schools are considered decreasingly popular among students. The rate of students applying to this type of school decreased both in 2016 and 2017. The majority of students can continue their studies in the school type of their choice (right side of Figure 2.3.1). The rate of those who only man- aged to gain admission into a vocational school instead of a general or voca- tional secondary school that provides a secondary school diploma decreased from 5 percent in 2005 to 2 percent in 2017, and the rate of those who had no choice but to study in a vocational secondary school instead of a general secondary school decreased from 4 percent to 2 percent.
Figure 2.3.1: The proportion of those continuing their education at the secondary level and those who were not admitted into the school type designated as their first choice in their priority list,
by school type, 2005–2017 (percentage)
Those who were not admitted into the school type Those continuing their education at the secondary level designated as their first choice in their priority list
Source: Authors’ compilation.
A significantly higher proportion of females study in general secondary schools than males, while a higher proportion of males continue their studies in vo- cational secondary schools and vocational schools. After 2012, the growth of the proportion of males continuing their studies in general secondary schools began to speed up, and the composition of the school types of males continu- ing their education after elementary school has been significantly rearranged.
20 30 40 50
2005 2007 2009 2011 2013 2015 2017 20
30 40 50
2005 2007 2009 2011 2013 2015 2017
General secondary school Vocational secondary school Vocational school
and vocational secondary schools, and the rate of those doing so in vocational schools dropped below 30 percent (Figure 2.3.2).
Figure 2.3.2: The proportion of those continuing their studies in secondary education, by school type and gender, 2005–2017 (percentage)
Females Males
Source: Authors’ compilation.
Secondary vocational applications (vocational secondary school, vocational school) were aggregated into 12 vocational groups. The changes in the pro- portions of these can be followed in Table 2.3.1 both separately by school type and combined. In a few vocational groups, education or training is con- ducted only or predominantly in one of the school types (such as health care, IT, economics, administration).
Table 2.3.1: The percentage of those continuing their studies
in vocational secondary schools or vocational schools, among those continuing their education at a secondary level, by vocational groups, 2007, 2017 Vocational group
Vocational
secondary school Vocational
school Combined
2007 2017 2007 2017 2007 2017
Not classified 1.0 0.0 0.3 0.0 1.3 0.0
Health care 1.7 2.0 0.2 0.0 1.9 2.0
Social, education 2.2 3.8 0.3 0.7 2.7 4.5
Mechanical engineering 5.3 3.4 4.4 4.8 9.6 8.1
IT 6.1 5.7 0.6 0.3 6.7 6.0
Construction 1.0 0.7 2.9 1.5 3.9 2.2
Chemical and light industries 2.3 1.2 3.0 1.8 5.4 3.0
Economics, administration 4.9 4.2 0.2 0.2 5.1 4.4
Trade and commerce 4.5 2.4 2.5 2.0 7.0 4.4
Agriculture, food industry 2.0 1.6 3.2 3.8 5.2 5.4
Other services, public services 1.1 4.2 1.2 0.3 2.3 4.5
Transport 1.8 1.6 0.5 0.8 2.3 2.3
Vocations not listed in the Hungarian
National Qualifications Register (OKJ) 0.0 0.0 0.01 0.0 0.01 0.0
Hospitality and tourism 3.1 3.0 3.8 6.3 6.9 9.3
Source: Authors’ compilation.
0 5 10 15 Hospitality, tourismOther servicesTransport
Agriculture, food industryTrade and commerce
Economics, administrationChemical, light industriesMechanical engineeringSocial, educationConstructionHealth careIT IT
Hospitality, tourismOther servicesTransport Agriculture, food industryTrade and commerce Economics, administrationChemical, light industriesConstruction Mechanical engineeringSocial, educationHealth care
0 5 10 15
Participation rates decreased in the mechanical engineering-electrical engi- neering-electronics vocational group and the construction, chemical and light industries and trade and commerce vocational groups. Participation increased in the social and service industries, education, arts, hospitality, tourism and other services, and in public services vocational groups.
These changes occurred in certain vocational groups parallel to a rearrange- ment among school types. Thus, in the mechanical engineering, electrical en- gineering, electronics vocational group, the rate of training programmes of- fering a secondary school diploma shrank, just as in the trade and commerce vocational group. In other vocational groups, such as in the social services, education and arts vocational group, the rate of training programmes offer- ing a secondary school diploma increased.
Overall, the rate of those continuing their studies in vocational secondary schools decreased within the technical vocational groups, while the rate of the trade and commerce and economic services vocational groups increased.
The share of technical vocational groups decreased in vocational schools as well, while the rate of those continuing their studies in a human services field increased.
Significant differences can be found between vocational groups by gender as well, which is shown in Figure 2.3.3. While the majority of females con- tinue their studies in the fields of trade and commerce and services, the ma- jority of males choose a vocation within the fields of industry or IT (see more in Csillag et al, 2019).
Figure 2.3.3: The proportion of those continuing their studies after elementary school, by gender, 2017
Females Males
Source: Authors’ compilation.
References
Csillag, M.–Greskovics, B.–Molnár, T. (2019): Girls in Hungarian vocational ed- ucation. In: Fazekas, K.–Szabó-Morvai, Á. (ed.): The Hungarian Labour Market, 2018. Institute of Economics, Centre For Economic and Regional Studies, Hungar- ian Academy of Sciences, Budapest, pp. 110–113.
Hajdu, T.–Hermann, Z.–Horn, D.–Kertesi, G.–Kézdi, G.–Köllő, J.–Varga, J. (2015):
Az érettségi védelmében [In defence of the Matura]. Budapesti Munkagazdaságtani Füzetek, BWP, 2015/1.
Horn, D. (2014): The Effectiveness of Apprenticeship Training a within track compari- son of workplace-based and school-based vocational training in Hungary. Budapest Working Papers on the Labour Market, BWP, 2014/5.
Kézdi, G.–Köllő, J.–Varga, J. (2009): The Failures of “Uncertified” Vocational Train- ing. In: Fazekas, K.–Köllő, J. (eds.): The Hungarian Labour Market, Review and Analysis, 2009. Institute of Economics IE HAS–National Employment Founda-
tion, Budapest, pp. 92–144.
Makó, Á.–Bárdits, A. (2014): A pályakezdő szakmunkások munkaerő-piaci helyzete – 2014 [Labour market success of vocational training school graduates]. MKIK Gaz-
daság- és Vállalkozáskutató Intézet, Budapest.