2.2 THE IMPACT OF SCHOOL TRACKS ON STUDENT PERFORMANCE IN UPPER-SECONDARY EDUCATION
Zoltán Hermann
The effects of school tracks on student performance and disparities between stu- dents have long been debated both in international and Hungarian literature alike. Some studies found the academic track to increase student performance (for example Guyon et al, 2010, Pop-Eleches–Urquiola, 2013, Horn, 2013), while others did not report a significant effect of tracks (for example Mala- mud–Pop-Eleches, 2010, Dustmann et al, 2012) or mainly attributed disparities between tracks to student selection on admission (Manning–Pisch ke, 2006).
This chapter explores the effects of the three upper-secondary educational tracks in Hungary: general secondary school which is a pure academic track, vocational secondary school which is a track with a mixed academic and vo- cational orientation and vocational school.
The analysis relies on data from the National Assessment of Basic Compe- tences (NABC). NABC measures the mathematics and reading skills of all students in Grades 6, 8 and 10, except for students with special educational needs and those absent from school on the day of the assessment, using a scale that enables comparison across years and grades. Our analysis includes a sin- gle cohort (except for Figure 2.2.1): students in Grade 8 in 2014. The sample contains students progressing without grade repetition and those who repeat- ed a grade only once between two assessments (Grades 8 and 10 or Grades 6 and 8), while those completing the two grades in more than three years were excluded from the analysis.
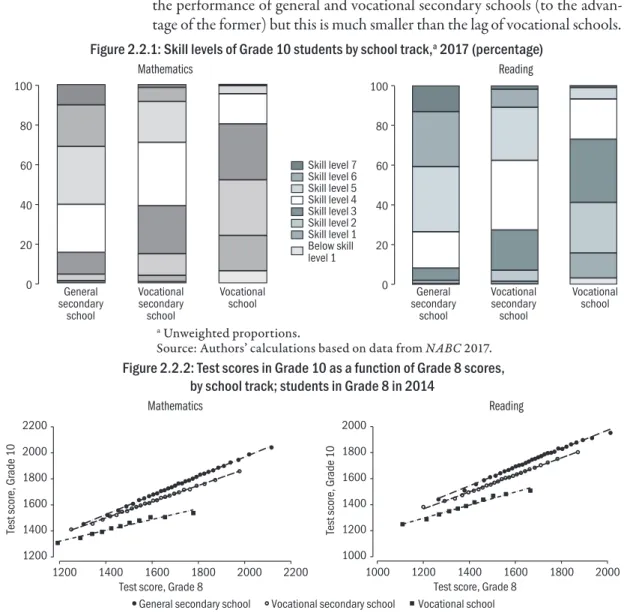
Figure 2.2.1 presents the differences in test results in Grade 10 across school tracks in 2017 (for skill levels see Balázsi et al, 2014). The differences are huge.
A quarter of vocational school students possess exceptionally poor skills and have difficulties solving the easiest exercises (skill levels 1 and below 1 on a 7-point scale), half of them perform very poorly (skill level 2 at most) and four-fifths of them poorly (skill level 3 at most). By contrast, 60 per cent of general secondary school students demonstrate fairly good (skill level 5 at least), one-third of them very good (levels 6 and 7) skills at the assessment, while poor assessment results are very rare. The majority of vocational second- ary school students achieve average results.
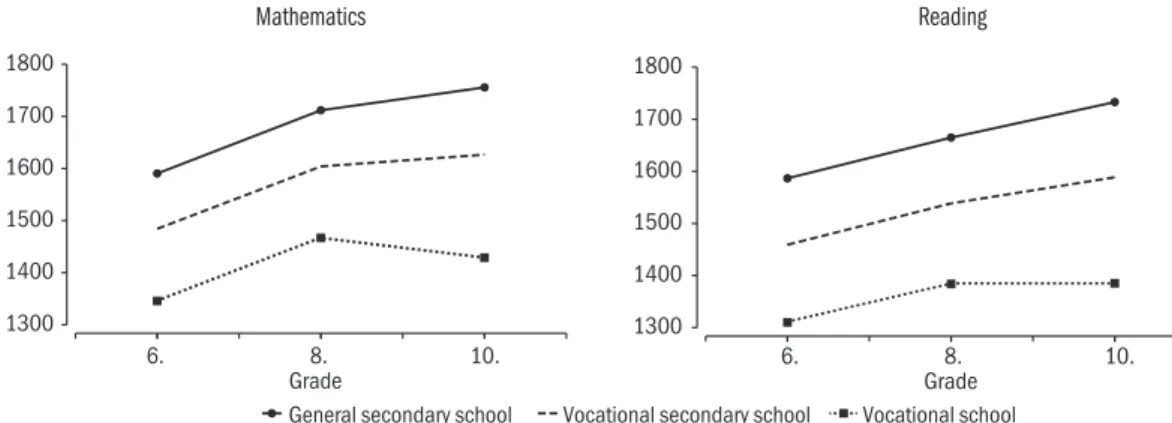
Figure 2.2.2 shows the test scores in Grade 10 of students achieving similar scores in Grade 8, broken down by track. It is obvious that students performing better in Grade 8 also achieved proportionately higher scores in Grade 10 in each of the three tracks. However, students achieving equal scores in Grade 8 performed better in secondary schools ending in a secondary school leaving ex- amination (Matura) than in vocational schools. For example, students achiev-
0 20 40 60 80 100
General secondary
school
Vocational secondary school
Vocational
school General
secondary school
Vocational secondary school
Vocational school Skill level 7
Skill level 6 Skill level 5 Skill level 4 Skill level 3 Skill level 2 Skill level 1 Below skill level 1
0 20 40 60 80 100
1000 1200 1400 1600 1800 2000
Test score, Grade 10
1000 1200 1400 1600 1800 2000
Test score, Grade 8 General secondary school Vocational secondary school Vocational school 1200
1400 1600 1800 2000 2200
Test score, Grade 10
1200 1400 1600 1800 2000 2200
Test score, Grade 8
ing 1400 points in mathematics in Grade 8 also achieve about 1400 points in Grade 10 in vocational school on average, while those of them studying in general or vocational secondary schools obtain nearly 1500 points. This ap- proximately 100-point difference amounts to half a standard deviation unit (the standard deviation of test scores in Grade 8 is 200 points). In another re- spect, the 100-point difference is somewhat smaller than the difference between the average students of two consecutive skill levels (skill levels cover ranges of about 140 points). The Figure reveals that there is also a slight difference in the performance of general and vocational secondary schools (to the advan- tage of the former) but this is much smaller than the lag of vocational schools.
Figure 2.2.1: Skill levels of Grade 10 students by school track,a 2017 (percentage)
Mathematics Reading
a Unweighted proportions.
Source: Authors’ calculations based on data from NABC 2017.
Figure 2.2.2: Test scores in Grade 10 as a function of Grade 8 scores, by school track; students in Grade 8 in 2014
Mathematics Reading
Note: The dots in the Figure represent unweighted averages of groups of students of about 1000.
Source: Authors’ calculations based on data from NABC 2014–2017.
1300 1400 1500 1600 1700 1800
6. 8. 10.
Grade
1300 1400 1500 1600 1700 1800
6. 8. 10.
Grade General secondary school Vocational secondary school Vocational school
These disparities are of course not entirely attributable to upper-secondary education: they primarily emerge in primary and lower-secondary education and reflect the impact of selection on admission to upper-secondary school.
The question is whether there is a significant difference in the performance of school tracks in addition to the effects of selection.
The differences revealed by Figure 2.2.2 suggest that upper-secondary school tracks contribute to developing basic skills to varying degrees. However, these differences may be due to differences between students, since students study- ing in the various tracks may not only differ in earlier academic achievements.
It is possible that vocational school students have more learning difficulties, develop more slowly or they are less motivated or diligent.
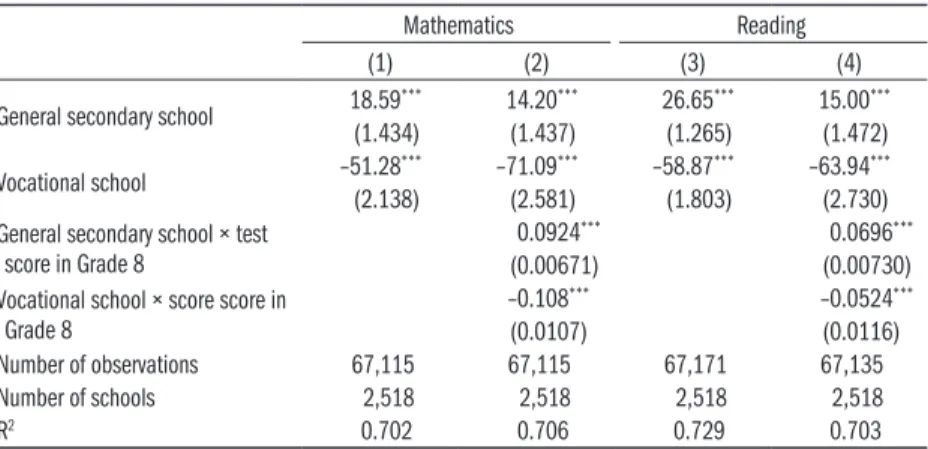
Based on Figure 2.2.3, indirect conclusions may be drawn about the ef- fects of these factors. The Figure presents the average test scores of students attending one of the three tracks in Grade 10 and their scores in Grade 6 and 8. In the first two grades of upper-secondary school, between Grade 8 and Grade 10, the average test scores of students in general and vocational second- ary schools increase, while vocational school students achieve equal reading score and lower mathematics score in Grade 10 than in Grade 8 on average.
What is particularly interesting, is that the increase between Grades 6 and 8 is similar in the three groups. Although future vocational school students obtained lower scores in Grade 6 and 8 than students subsequently attend- ing tracks concluding with a Matura, their average test score increased to the same extent over the two years. This suggests that it is not impossible to im- prove basic skills in this group.
Figure 2.2.3: Changes in average test scores between Grades 6 and 10, by school track; students in Grade 8 in 2014
Mathematics Reading
Note: Unweighted averages.
Source: Authors’ calculations based on data from NABC 2014–2017.
Estimates in Table 2.2.1 quantify the effect of school tracks more accurately.
These regression models include test scores in Grade 10 as dependent variables.
Estimates in Columns (1) and (3) include the following control variables: in- dicators of prior student performance (test scores in both competence areas in Grades 6 and 8 as well as grades at the end of Grades 8 and 6, the latter as dummy variables) and individual characteristics of students (gender, special education needs and severe disadvantage, educational attainment of mother and father and the number of books possessed, all as dummy variables). The missing values of control variables were substituted by average or typical val- ues and missing values are denoted by independent dummy variables. Con- trolling for these factors, coefficients show how students are likely to perform in Grade 10 depending on the school track they attend.
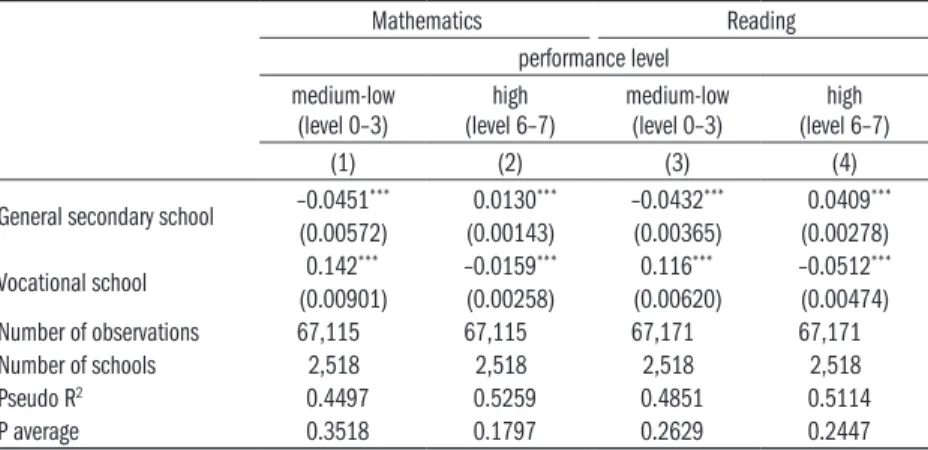
Table 2.2.1: Regression estimates of the effect of school tracks on student performance in Grade 10; students in Grade 8 in 2014
Mathematics Reading
(1) (2) (3) (4)
General secondary school 18.59*** 14.20*** 26.65*** 15.00***
(1.434) (1.437) (1.265) (1.472) Vocational school –51.28*** –71.09*** –58.87*** –63.94***
(2.138) (2.581) (1.803) (2.730) General secondary school × test
score in Grade 8
0.0924*** 0.0696***
(0.00671) (0.00730)
Vocational school × score score in Grade 8
–0.108*** –0.0524***
(0.0107) (0.0116)
Number of observations 67,115 67,115 67,171 67,135
Number of schools 2,518 2,518 2,518 2,518
R2 0.702 0.706 0.729 0.703
Note: Unweighted OLS estimates.
Reference category for school track: vocational secondary school.
Control variables: test scores in both competence areas in Grades 6 and 8, the cat- egories of grades at the end of Grades 8 and 6, gender, special education needs and severe disadvantage, the categories of educational attainment of mother and father, the categories of the number of books possessed as well as dummy variables denot- ing the missing values of control variables.
Standard errors clustered for upper-secondary schools are shown in parentheses.
***Significant at a 1 per cent, **5 per cent, *10 per cent level.
Source: Authors’ calculations based on data from NABC 2014–2017.
The findings show that a vocational school student achieves 50 points less in mathematics and 60 points less in reading on average than a vocational sec- ondary school student with equal performance in lower secondary school.
The advantage of a general secondary school student is 20–25 points. The standard deviation of test scores is about 200 points, thus the lag of voca- tional school students increases by a quarter, while the advantage of general secondary school students increases by one-tenth of a standard deviation unit.
Estimates in Columns (2) and (4) of Table 2.2.1 also include the interaction terms of school tracks and the test score in Grade 8 in the given competence area. The coefficients of the interaction terms indicate that the effect of track
is associated with performance in lower-secondary school: the better the test result of a student in Grade 8, the more advantage studying in a general sec- ondary school is likely to entail compared to a vocational secondary school, and the more disadvantage results from studying in a vocational school. These findings are consistent with the trend seen in Figure 2.2.2, which reveals the difference between school tracks increases with test scores in Grade 8.
Table 2.2.2 presents these correlations from another aspect. The models show how school track is associated with the probability of high or low per- formance in Grade 10, after controlling for individual factors. Since low per- formance levels are less frequent both in the total sample and among average students than high performance, the three lowest performance level together with below level 1 were defined as low performance, while levels 6 and 7 were regarded as high performance. Control variables are identical to those used in earlier estimates.
Table 2.2.2: Regression estimates of the effects of school tracks on the probability of high and low student performance; students in Grade 8 in 2014, marginal effects
Mathematics Reading
performance level medium-low
(level 0–3) high
(level 6–7) medium-low
(level 0–3) high (level 6–7)
(1) (2) (3) (4)
General secondary school –0.0451*** 0.0130*** –0.0432*** 0.0409***
(0.00572) (0.00143) (0.00365) (0.00278) Vocational school 0.142*** –0.0159*** 0.116*** –0.0512***
(0.00901) (0.00258) (0.00620) (0.00474)
Number of observations 67,115 67,115 67,171 67,171
Number of schools 2,518 2,518 2,518 2,518
Pseudo R2 0.4497 0.5259 0.4851 0.5114
P average 0.3518 0.1797 0.2629 0.2447
Note: Unweighted OLS estimation.
Reference category for school track: vocational secondary school.
Control variables: test scores in both competence areas in Grades 6 and 8, the cat- egories of grades at the end of Grades 8 and 6, gender, special education needs and severe disadvantage, the categories of educational attainment of mother and father, the categories of the number of books possessed as well as dummy variables denot- ing the missing values of control variables.
Standard errors clustered for upper-secondary schools are included in parentheses.
***Significant at a 1 per cent, **5 per cent, *10 per cent level.
Source: Authors’ calculations based on data from NABC 2014–2017.
35 per cent of students achieved a low performance level in Grade 10 in math- ematics, while 26 per cent of them did so in reading. Estimates in Column (1) and (3) indicate that if an average student goes on to study at vocational school instead of vocational secondary school, the probability of low perfor- mance increases significantly: by 14.2 percentage points in mathematics and
11.6 percentage points in reading. By contrast, if continuing their studies at general secondary school, this probability decreases by 4.5 and 4.3 percent- age points respectively. The trend is just the opposite for high performance [Columns (2) and (4)]. The share of high performers is 18 per cent in mathe- matics and 24 per cent in reading. General secondary school, compared with vocational secondary school, increases the probability of high performance by 1.3 and 4.1 percentage points in Grade 10 respectively among average stu- dents, while vocational school decreases the probability by 1.6 and 5.1 per- centage points respectively.
It is important to note that the above results are not exclusively attribut- able to the impact of school track, as it cannot be ruled out that for example students in vocational schools take the tests less seriously, which slightly in- creases the estimated effect of this track compared with its actual effect. Nev- ertheless, earlier estimates that compared the data of students “just admitted”
and “just rejected” in order to control for unobserved characteristics such as students’ motivation and aspirations found slightly weaker but very similar trends (Hermann, 2013).
In conclusion, the results indicate that the huge differences emerging by the end of lower-secondary education between students continuing their studies in one of the three school tracks increase further over the first two years of upper-secondary school. This increase is significant, especially between vo- cational school students and students studying in the other two tracks con- cluding with a Matura.
References
Balázsi, I.–Balkányi, P.–Ostorics, L.–Palincsár, I–Rábainé Szabó, A.–Szepesi, I.–Szipőcsné Krolopp, J.–Vadász, Cs. (2014) Az Országos kompetenciamérés tar- talmi keretei. Szövegértés, matematika, háttérkérdőívek. Oktatási Hivatal, Budapest.
Dustmann, C.–Puhani, P. A.–Schönberg, U. (2012): The Long-term Effects of School Quality on Labor Market Outcomes and Educational Attainment. CReAM Discus- sion Paper, No. 08/12.
Guyon, N.–Maurin, E.–McNally, S. (2010): The effect of tracking students by ability into different schools. A natural experiment. Fondazione Eni Enrico Mattei, Nota di Lavoro, No. 152.
Hermann, Z. (2013): Are you on the right track? The effect of educational tracks on stu- dent achievement in upper-secondary education in Hungary. BWP, No. 16.
Horn, D. (2013): Diverging Performances: the detrimental effects of early selection on equality of opportunity in Hungary. Research in Social Stratification and Mobil- ity, Vol 32. pp. 25–43.
Malamud, O.–Pop-Eleches, C. (2010): General Education versus Vocational Train- ing: Evidence from an Economy in Transition. Review of Economics and Statistics, Vol. 92. No. 1. pp. 43–60.
Manning, A.–Pischke, J.-S. (2006): Comprehensive versus Selective Schooling in Eng- land and Wales: What Do We Know? IZA Discussion Paper, No. 2072.
Pop-Eleches, C.–Urquiola, M. (2013): Going to a Better School: Effects and Behavio- ral Responses, American Economic Review, Vol. 103. No. 4. pp. 1289–1324.