5.4 HORIZONTAL GENDER SEGREGATION IN HIGHER EDUCATION – STEM APPLICATIONS
Koen Declercq & Júlia Varga
Despite the significant increase in the participation of women in higher edu- cation as presented in chapter 5.1, horizontal gender segregation is still con- siderable. STEM (Science, Technology, Engineering and Mathematics) study fields are chosen by a much smaller proportion of women than men. This not only negatively influences labour market opportunities of women, but also the labour supply of STEM graduates.
The reasons for horizontal gender segregation have been broadly studied in the literature. One strand of the literature tried to explain this phenomenon by the gender skill gaps in test scores in mathematics (Ceci et al. 2009, Ceci–
Williams, 2010, Halpern et al. 2007, Hyde et al. 2008, Turner–Bowen, 1999, Wai et al. 2010). However, most of this research concluded that the gender gap in test scores in mathematics has significantly decreased over recent dec- ades and therefore, nowadays gender performance gaps explain the horizon- tal gender segregation only to a smaller extent (Hyde et al. 2008, Spelke, 2005, Goldin et al. 2006).
Other research found that labour market expectations of men and women differ from each other and can partly explain the different decisions in higher education (see for example Montmarquette et al. 2002, Varga, 2006, Boudar- bat, 2008, Arcidiacono et al. 2012). These studies found that women are less responsive to expected earnings when making their choices in higher educa- tion. This is another reason why women are less likely to choose the STEM- fields than men. According to Zafar (2013), future wage expectations explain only a small part of the gender gap in STEM fields. Gender differences in preferences are the most important explanation. Other studies arrived at the same conclusion (Turner–Bowen, 1999, Kahn–Ginter, 2017). More recent studies show that horizontal segregation in higher education – in addition to the differences in preferences – also has its roots in gender differences in risk aversion (Bertrand, 2011, Croson–Gneezy, 2009, Eckel–Grossman, 2008, Gneezy et al. 2003) and in the propensity to participate in competitions as well as in self-confidence (Reuben et al. 2014). These studies found that wom- en are more risk-averse and are less self-confident. This could also explain the choices of different fields of study as women are less likely to apply to highly competitive fields.
In connection with the explanations based on the differences in preferences, the question occurs whether preferences are constant or if they change over
time. This chapter studies whether a change in admission chances influences application decisions to STEM programmes and whether the effects differ by gender. The analysis is based on the impact evaluation of the education reform of 2012.1 In 2012 a sudden and considerable reduction took place both in the number of public-financed university places and in university places in general.
The study fields were not equally affected by this decrease. The reform implied a proportionally larger decrease in the number of non-STEM places, which led to an increase in the relative admission chances to the public-financed STEM programmes. The impact of this modification is analysed below.
The analysis is based on two administrative databases which are linked at individual level, namely the 2011 and 2012 waves of the whole sample of the Secondary School Graduation Database of the Educational Agency and the whole sample of the Higher Education Application Database of the Higher Education Application Agency. The linked data observe which sec- ondary school graduates applied for higher education studies in the given year. The data also observe the graduation results of all graduates, the type of their secondary school, the type of the settlement where it is located and the date of birth of the graduate. The data was only used for the stu- dents who graduated in the year of the higher education application i.e. in 2011 or in 2012. The analysis does not consider individuals who applied to state-accredited higher vocational education. The sample was limited to students who applied for an initial (BA) or a so-called an undivided pro- gram. The higher education application database contains information on all applications including the applicant’s number, institution, programme, the type of the financing, the level of the training type and, if the applicant was admitted to the given training programme. Furthermore, the data also include detailed information on the applicant’s ‘test scores’ (achievements in the secondary school and the results of the secondary school graduation exam), additional scores for disadvantaged applicants or applicants who had taken a language exam before.
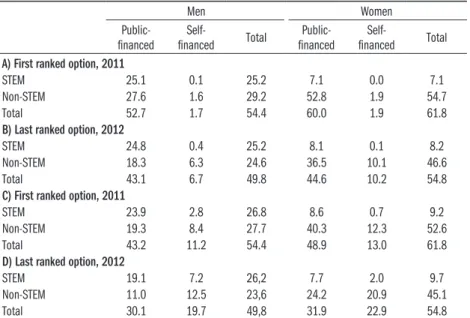
Table 5.4.1 presents the applications of 2011 and 2012, before and after the policy reform. According to the descriptive statistics, it seems that women re- acted more strongly to the changes. The share of higher education applicants decreased for both men and women, but the decrease was more outspoken for women. In 2011, one-fourth of the male graduates applied to a STEM pro- gramme as the first selected option while this proportion was only 7.1 percent among women. STEM applicants of both genders chose almost exclusively public-financed training programmes. In 2012 the proportion of men apply- ing to STEM training programmes as a first option did not change while the proportion of women increased by 1 percent. The share of men who applied for STEM training programmes as a final option decreased by 0.6 percent
while the proportion of women increased by 0.5 percent. 1 Detailed analysis see at CERS HAS.
Table 5.4.1: Application decision in higher education ranking. The share of higher education applicants compared to the total number of secondary school graduates
in the given year by gender, 2011–2012
Men Women
Public-
financed Self-
financed Total Public-
financed Self-
financed Total A) First ranked option, 2011
STEM 25.1 0.1 25.2 7.1 0.0 7.1
Non-STEM 27.6 1.6 29.2 52.8 1.9 54.7
Total 52.7 1.7 54.4 60.0 1.9 61.8
B) Last ranked option, 2012
STEM 24.8 0.4 25.2 8.1 0.1 8.2
Non-STEM 18.3 6.3 24.6 36.5 10.1 46.6
Total 43.1 6.7 49.8 44.6 10.2 54.8
C) First ranked option, 2011
STEM 23.9 2.8 26.8 8.6 0.7 9.2
Non-STEM 19.3 8.4 27.7 40.3 12.3 52.6
Total 43.2 11.2 54.4 48.9 13.0 61.8
D) Last ranked option, 2012
STEM 19.1 7.2 26,2 7.7 2.0 9.7
Non-STEM 11.0 12.5 23,6 24.2 20.9 45.1
Total 30.1 19.7 49,8 31.9 22.9 54.8
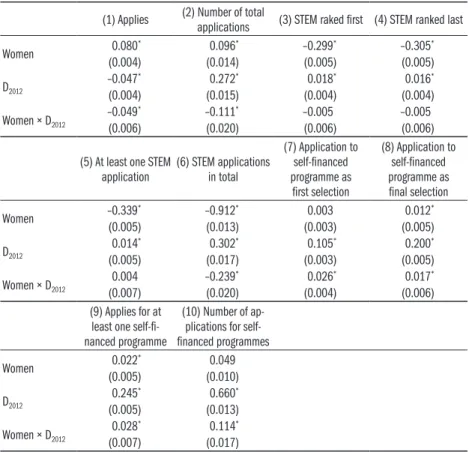
Table 5.4.2 presents the results of the simple models that evaluate how the reform affected application decisions: (1) the decision to apply to higher edu- cation, (2) the number of applications, (3) the decision to rank a STEM pro- gramme first, (4) the decision to rank a STEM programme last, (5) the deci- sion to rank at least one STEM programme, (6) the total number of STEM programs, (7) the decision to rank a self-financed programme first, (8) the decision to rank a self-funded program last, (9) the decision to rank at least one self-financed study programme and (10) the total number of self-financed options ranked. Models (2) and (6) are simple OLS regressions and the fur- ther ones are logit models.2
The results of model (1) show that women are more likely to apply to higher education. The reforms of 2012 caused a decrease in the number of students ap- plying to higher education and especially discouraged participation of women.
The following regressions show that after the reform, more men applied to STEM programmes both as their first and final selections and that men sub- mitted a higher number of such applications than women. However, there was no significant difference between men and women regarding the change in the probability of applying to at least one STEM programme. Men responded to the modifications of 2012 rather by increasing their STEM applications while women were more likely to apply to self-financed programmes after 2012 which – as the admission chances to the self-financed programmes are higher – seems to be a less risky strategy.3
2 The table only contains es- timation results of the gender variable, the dummy variable of the year of the reform (i.e. 2012) and the interaction of these the two variables.
3 The student considers if it is reasonable to invest time in the preparation for the admission exam. An important element of this consideration is the prob- ability of admission. The lower the probability for the admis- sion the riskier is the time in- vested into the preparation.
Table 5.4.2: Higher education applications – the impact of the reform (1) Applies (2) Number of total
applications (3) STEM raked first (4) STEM ranked last
Women 0.080* 0.096* –0.299* –0.305*
(0.004) (0.014) (0.005) (0.005)
D2012 –0.047* 0.272* 0.018* 0.016*
(0.004) (0.015) (0.004) (0.004)
Women × D2012
–0.049* –0.111* –0.005 –0.005
(0.006) (0.020) (0.006) (0.006)
(5) At least one STEM
application (6) STEM applications in total
(7) Application to self-financed programme as first selection
(8) Application to self-financed programme as final selection
Women –0.339* –0.912* 0.003 0.012*
(0.005) (0.013) (0.003) (0.005)
D2012 0.014* 0.302* 0.105* 0.200*
(0.005) (0.017) (0.003) (0.005)
Women × D2012 0.004 –0.239* 0.026* 0.017*
(0.007) (0.020) (0.004) (0.006)
(9) Applies for at least one self-fi- nanced programme
(10) Number of ap- plications for self- financed programmes
Women 0.022* 0.049
(0.005) (0.010)
D2012
0.245* 0.660*
(0.005) (0.013)
Women × D2012 0.028* 0.114*
(0.007) (0.017)
Note: The decision to apply to higher education was estimated on the whole sample of secondary school graduates in 2011 and 2012. Control variables are age, results of the secondary school graduation exam, and regional fixed effects. The other models were estimated on the subsample of secondary school graduates who ap- plied for higher education. The control variables in these estimations – in addition to the former ones – were an indicator for low socio-economic status and the type of the secondary school of the applicant.
* Significant at 5 percent.
A structural model was estimated to measure the extent to which secondary school graduates consider admission probabilities when making their appli- cation decisions. The model allows for gender differences in preferences for the different fields of study and gender differences in responsiveness to ex- pected admission probabilities. (For the description of the model see Annex 5.4). The estimation process consisted of two steps. First, based on the data of 2011, the probability of admission to the first ranked programme was esti- mated with a binary logit regression. Next, the probability that a high school graduate chooses a particular study program at a specific institution was esti- mated with a conditional logit model.4 Table 5.4.3 presents the results of the conditional logit model and shows significant gender differences in the choice
4 The estimation results on the first step are not published here, for the results see at CERS HAS.
between the several study fields. First, women are less likely to apply for tech- nology and ICT than men, but there is no gender difference in the choice for natural science programmes. This means that it is not the case in all STEM fields that women are less likely to choose them. Next, the estimation results show that women are more responsive to admission probabilities when mak- ing their choices in higher education. This can be related to the findings of previous studies that women are more risk-averse in their choices than men.
Table 5.4.3: Application decisions of first ranked options Evonomics,
Business Technology,
ICT Teacher
training Health Natural
Science Agricultural Constant –7.442* –8.591* –5.124* –8.329* –7.925* –7.220*
(0.085) (0.099) (0.129) (0.141) (0.173) (0.148)
Male –0.719* 1.593* –2.707* –1.185* 0.227* 0.149*
(0.043) (0.058) (0.140) (0.068) (0.084) (0.072)
+19 years 0.076 –0.209* –0.101 –0.356* –0.482* –0.083
(0.041) (0.045) (0.073) (0.065) (0.085) (0.074)
Mathematics 4.123* 5.413* 0.503* 3.270* 3.545* 2.267*
(0.111) (0.126) (0.199) (0.152) (0.192) (0.186)
Hungarian language
2.181* 1.224* 1.444* 2.921* 1.330* 1.338*
(0.137) (0.139) (0.241) (0.215) (0.246) (0.238)
History 1.718* 0.570* 0.913* 2.663* 2.120* 2.028*
(0.150) (0.154) (0.256) (0.229) (0.281) (0.263)
Budapest –0.805* –1.080* –0.689* –0.613* –0.841* –1.152*
(0.044) (0.047) (0.081) (0.067) (0.084) (0.082)
Self –0.838* –3.074* –2.881* –2.007* –4.026* –2.370*
(0.172) (0.257) (0.300) (0.303) (1.013) (0.281)
Legal, admin-
istrative Arts Humanities and
Social Sciences Self-financed
programme Probability of
admission Distance from the institution
Constant –7.283* –6.426* –7.551* – 1.756* –0.015*
(0.125) (0.108) (0.092) (0.065) (0.000)
Male 0.057 –0.121* –0.853* 0.519* –0.673* 0.000
(0.055) (0.056) (0.046) (0.098) (0.085) (0.000)
+19 years –0.084 –0.121* 0.077* 0.179* – –
(0.058) (0.057) (0.043) (0.085)
Mathematics 1.000* 1.055* 0.453* –1.708* – –
(0.146) (0.151) (0.148) (0.239)
Hungarian language
5.053* 2.229* 4.553* –2.967* – –
(0.200) (0.182) (0.148) (0.276)
History 1.371* 1.408* 1.922* –1.456* – –
(0.208) (0.197) (0.156) (0.301)
Budapest –1.279* –0.304* –0.572* 0.968* – –
(0.062) (0.056) (0.046) (0.082)
Self –0.148 –2.530* –1.277* –
(0.185) (0.222) (0.182)
Note: Robust standard errors in parentheses; * p < 0.05. The probability of ranking an option first is estimated with a conditional logit model. The model is estimated on the sample of all high school graduates of 2011. Results must be interpreted rela- tive to the base category of not applying to higher education.
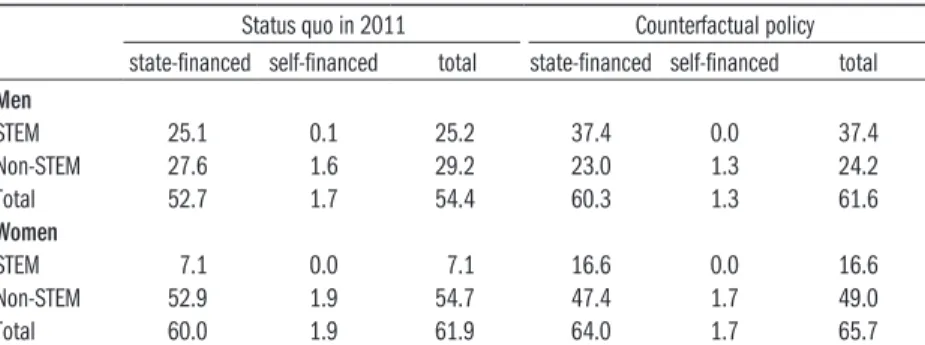
Finally, we used the model to study the possible impact of an alternative ad- mission policy in higher education. We simulated an open access policy in STEM programmes. This hypothetical policy allows all high school gradu- ates, irrespective of high school background, to start at all STEM options in higher education. This hypothetical policy stimulates enrolment in STEM programs without discouraging students to apply to other programs. Table 5.4.4 compares the outcomes of this simulation with the status quo of 2011.
Table 5.4.4: The simulated impact of the alternative higher education policy.
Counterfactual analysis: the impact of open access to STEM programs Status quo in 2011 Counterfactual policy state-financed self-financed total state-financed self-financed total Men
STEM 25.1 0.1 25.2 37.4 0.0 37.4
Non-STEM 27.6 1.6 29.2 23.0 1.3 24.2
Total 52.7 1.7 54.4 60.3 1.3 61.6
Women
STEM 7.1 0.0 7.1 16.6 0.0 16.6
Non-STEM 52.9 1.9 54.7 47.4 1.7 49.0
Total 60.0 1.9 61.9 64.0 1.7 65.7
Note: Predicted outcomes are expressed as percentages of 2011 high school graduates.
Outcomes of the counterfactual policy are expressed as percentage point changes relative to the status quo.
Under the counterfactual scenario of an open access policy in subsidized STEM programs, more men and women would apply to higher education.
More men and women would apply to STEM programs and fewer high school graduates would apply to non-STEM programs. While the relative increase in applications to STEM programs is larger for women, the increase in the total number of students applying to STEM programs is larger for men.
Our analysis shows that changes in admission standards can encourage stu- dents to apply to STEM programmes. At the same time, we show that sec- ondary school graduates do not perceive all higher education programmes as close substitutes. A certain proportion of students – and especially women – even desist from applying to higher education if the chance of admission and therefore the utility of applying decreases for their preferred programmes. The analysis also revealed that men and women not only differ in their preferenc- es for STEM fields, but women are also more responsive to admission prob- abilities when making their application decisions. The results also showed that there are no gender differences in the probability of applying to certain fields within STEM – namely natural sciences – if we control for the results in mathematics and other characteristics of our model. However, in order to identify the reasons for the considerable gender difference in the technologi- cal and IT fields further research is needed.
References
Arcidiacono, P.–Hotz, J.–Kang, S. (2012): Modelling college major choices using elicited measures of expec- tations and counterfactuals. Journal of Econometrics, Vol. 166. No. 1. pp. 3–16.
Bertrand, M. (2011): New perspectives on gender. In:
Ashenfelter O.–Layard, R.–Card D. (eds.): Handbook of Labor Economics, Vol. 4. Part B. Elsevier, pp. 1543–
1590.
Boudarbat, B. (2008): Field of study choice by commu- nity college students in Canada. Economics of Edu- cation Review, Vol. 27. No. 1. pp. 79–93.
Ceci, S. J.–Williams, W. M. (2010): Sex Differences in Math-Intensive Fields. Current Directions in Psycho- logical Science, Vol. 19. No. 5. pp. 275–279.
Ceci, S. J.–Williams, W. M.–Barnett, S. M. (2009):
Women’s underrepresentation in science: Sociocul- tural and biological considerations. Psychological Bul- letin, Vol. 35, No. 2. pp. 218–261.
Croson, R.–Gneezy, U. (2009): Gender differences in preferences. Journal of Economic Literature, Vol. 47.
No. 2. pp. 1–27.
Eckel, C.–Grossman, P. (2008): Men, women and risk aversion. Experimental evidence. In: Plott, C, R.–
Smith, V, L. (eds.): Handbook of Experimental Eco- nomics Results, Vol. 1. Elsevier, New York, pp. 1061–
1073.
Gneezy, U.–Niederle, M.–Rustichini, A. (2003): Per- formance in competitive environments. Gender dif- ferences. The Quarterly Journal of Economics, Vol.
118. No. 3. pp. 1049–1074.
Goldin, C.–Katz, L.–Kuziemko, I. (2006): The home- coming of American college women. The reversal of the college gender gap. Journal of Economic Perspec- tives, Vol. 20. No. 4. pp. 133–156.
Halpern, D. F.–Benbow, C. P.–Geary, D. C.–Gur, R. C.–
Hyde, J. S.–Gernsbacher, M. A. (2007): The Sci-
ence of Sex Differences in Science and Mathematics.
Pshyhological Science in the Public Interest, Vol. 8.
No. 1. pp. 1–51.
Hyde, J. S.–Indberg, S. M.–Linn, M. C.–Ellis, A. B.–Wil- liams, C. C. (2008): Gender Similarities Character- ize Math Performance. Science, Vol. 321. No. 5888.
pp. 494–495.
Kahn, S.–Ginther, D. (2017): Women and STEM. NBER Working Paper, No. 23525.
Montmarquette, C.–Cannings, K.–Mahseredjian, S. (2002): How do young people choose college ma- jors? Economics of Education Review, Vol. 21. No. 6.
pp. 543–556.
Reuben, E.–Sapienza, P.–Zingales, L. (2014): How stereotypes impair women’s careers in science. Pro- ceedings of the National Academy of Sciences of the United States of America, Vol. 111. No. 12. pp.
4403–4408.
Spelke, E. S. (2005): Sex Differences in Intrinsic Apti- tude for Mathematics and Science? A Critical Review.
American Psychologist, Vol. 60. No. 9. pp. 950–958.
Turner, S.–Bowen, W. (1999): Choice of major. The changing (unchanging) gender gap. Industrial and Labor Relations Review, Vol. 52. No. 2. pp. 289–313.
Varga Júlia (2006): The Role of Labour Market expec- tations and admission probabilities in students’ ap- plication decisions on higher education. The case of Hungary. Education Economics, Vol. 14. No. 3. pp.
309–327.
Wai, J.–Cacchio, M.–Putallaz, M.–Makel, M. C.
(2010): Sex differences in the right tail of cognitive abilities. A 30-year examination. Intelligence, Vol. 38.
No. 4. pp. 412–423.
Zafar, B. (2013): College major choice and the gender gap. Journal of Human Resources, Vol. 48. No. 3. pp.
545–595.
5.4 Annex
A student i applies to a study program j ε J at an institution k ε K to maximize the utility of studying. The utility of applying to a specific study option is given by
Uijk (Xi,λijk,dik) = αj+αjXi+α λijk+α λijkXi+α dik+α dikXi+εijk
Uijk (Xi,λijk,dik) = Vijk (Xi,λijk,dik)+εijk ,
0 1 2 3 4 5
with Vijk (Xi ,λijk ,dik) the deterministic part of utility. Utility depends on an alternative specific constant α0 j, and personal characteristics such as gender and high school background Xi . Utility also depends on the admission probability λijk . Students obtain a higher utility from programs for which they have a high-
er probability of being admitted. We interact this probability with gender to assess whether women are more responsive to admission probabilities when making their application decisions. Admission probabilities differ between programs but also between institutions. Given that students must pay a fee for each study program they rank after their third option, students might stra- tegically apply to a less popular institution for which they have higher admis- sion probabilities. Previous literature shows that travel distance is an impor- tant factor of participation in higher education and the decisions where and what to study. Students prefer study options located in their neighborhood.
We therefore include the travel distance dik between the location of the high school of the student and the institution as a determinant of utility. Finally, utility depends on an unobserved preference shock εijk , which is iid type 1 extreme value distributed. The probability that student i chooses for study program j at institution k is then given by the logit formula
exp Vijk (Xi,λijk,dik)
Σ
j'εj,k'εk exp(
Vijk'(Xi,λijk',dik))
Pijk = .
' ' '
In the model, students consider the probability of being admitted when ap- plying to higher education. The probability that student is admitted to study program at institution is given by
λijk (Mi,capjk) = β0j+β1j Mi+β cap2 jk+ηijk ,
and depends on a program alternative specific constant β0 j, a vector of ma- triculation exam scores Mi , and a measure of the capacity of program j at in- stitution k: capjk . Capacity of the program is defined as the ratio of admitted students relative to the total applicants in the study option. The capacity of the program serves as an exclusion restriction. Capacity influences the utility of applying to an option only indirectly through the effect on the admission probability. We assume that there is no direct effect of capacity on the utility of applying to specific options. Finally, the admission probability depends on an iid type 1 extreme value distributed error term ηijk .