BUDAPEST WORKING PAPERS ON THE LABOUR MARKET
BWP – 2018/6
Gender differences in applying for STEM programs in higher education:
evidence from a policy shift in Hungary
KOEN DECLERCQ, JORIS GHYSELS, JÚLIA VARGA
BWP 2018/6
INSTITUTE OF ECONOMICS, CENTRE FOR ECONOMIC AND REGIONAL STUDIES HUNGARIAN ACADEMY OF SCIENCES
BUDAPEST, 2018
2
Budapest Working Papers on the Labour Market BWP – 2018/6
Institute of Economics, Centre for Economic and Regional Studies, Hungarian Academy of Sciences
Gender differences in applying for STEM programs in higher education:
evidence from a policy shift in Hungary
Authors:
Koen Declercq
IRES, UCLouvain, FNRS, and LEER, KU Leuven
email: koen.declercq@uclouvain.be
Joris Ghysels
Maastricht University and VDAB email: joris.ghysels@vdab.be
Júlia Varga senior research fellow
Institute of Economics, Centre for Economic and Regional Studies, Hungarian Academy of Sciences
email: varga.julia@krtk.mta.hu
November 2018
3
Gender differences in applying for STEM programs in higher education: evidence from a policy shift in
Hungary
Koen Declercq, Joris Ghysels, Júlia Varga Abstract
We study how admission policies in higher education affect enrollment decisions of men and women and the decision to apply to STEM programs. More specifically, we investigate how an increase in the relative acceptance probability for STEM programs affects these decisions. We apply our analysis to Hungary and we evaluate a policy reform that limited access to subsidized non-STEM programs. We find that this change in the selectivity of the admission system differently affected application decisions of men and women. After the reform, fewer students applied to higher education and the reform especially discouraged the participation of women. After the reform, more men and women applied to STEM programs or non-subsidized non-STEM programs in which they have to pay tuition fees.
This last effect is stronger for women. As the reform affected the chance to be admitted to higher education, we estimate a structural model to analyze how the responsiveness to admission probabilities in application decisions differs between men and women. We find that women are more sensitive to admission probabilities. Finally, we use the model to simulate the impact of alternative admission policies on enrollment in STEM programs.
We find that an open access policy in STEM programs would stimulate more men and women to apply to these programs.
Keywords:higher education, admission, gender differences, STEM, structural model JEL: I21, I23, I24, J16, J24
Acknowledgement:
We would like to thank participants of the LEER Economics of Education Workshop in Leuven (2017), the Eden Workshops in Budapest (2017) and Maastricht (2018), and the 9th International Workshop of Applied Economics of Education in Catanzaro (2008). We would also like to thank participants of seminars in Budapest (2018) and Leuven (2018).
The project leading to this paper has received funding from the European Union's Horizon 2020 research and innovation programme under grant agreement No.
691676 (EdEN).
4
A nemek közötti különbségek a felsőoktatási STEM programokba irányuló jelentkezésekben:
egy magyarországi szakpolitikai változás hatásának elemzése
Koen Declercq, Joris Ghysels, Varga Júlia Összefoglaló
A tanulmány azt vizsgálta, hogy a felsőoktatási felvételi politika hogyan hat a férfiak és nők továbbtanulási döntésére, valamit arra, hogy az u.n. STEM képzési területekre (Természettudomány, Technológia, Mérnöki tudomány, Matematika) jelentkezzenek. Azt elemeztük, hogy a STEM programokra való bekerülési esélyek relatív növekedése milyen hatással van e döntésekre. Annak a magyarországi felsőoktatási reformnek a hatását vizsgáltuk, mely korlátozta az állami finanszírozású nem STEM képzésekre felvettek számát. Az eredmények azt mutatják, hogy a felvételi lehetőségek szelektivitása különbözőképpen hatott a férfial és nők továbbtanulási döntésére. A reform után kevesebb tanuló jelentkezett a felsőoktatásba, és a reform a nőket különösen eltántorította a felsőoktatási jelentkezéstől. A reformot követően mindkét nemből többen jelentkeztek STEM programokra és költségtérítéses nem STEM programokra is. A költségtérítéses képzésre jelentkezés különösen a nők körében nőtt meg. Mivel a reform a felsőoktatásba történő bekerülés esélyét váltiztatta meg, egy strukturális modell segítségével azt elemeztük hogy a felvételi esélyek változásához való alkalmazkodás különbözik-e nemek szerint. Az eredmények szerint a nők érzékenyebben reagáltak a felvételi esélyek változására. Végül, a modell segítségével egy alternatív felsőoktatási felvételi politika, a bekerülési korlátok eltörlésének hatását szimuláltuk. Azt találtuk, hogy a felvételi korlátok eltörlése több nőt és férfit vonzana a STEM programokba.
Kulcsszavak: felsőoktatás, felvételi, gender különbségek, STEM, strukturális modell JEL: I21, I23, I24, J16, J24
5
1. INTRODUCTIONIt is well documented that the share of women enrolled in higher education has been increasing during the last decades. Now, more women than men attend and complete higher education (Vincent and Lancrin, 2008; OECD, 2015). Nevertheless, in most countries, the difference between men and women in the choice of college majors is large and persistent. Women are less likely to study Science, Technology, Engineering and Mathematics (STEM subjects) than men. In 2015, the average share of women among new entrants in higher education in OECD countries was only 19% in ICT majors, and 25% in engineering courses, while 54% of new entrants in higher education were female (OECD, 2017). We observe a similar pattern in Hungary, the focus of our analysis. In 2011, 57% of applicants to higher education were female, but the share of women applying to STEM programs was only 23%. The underrepresentation of women in STEM fields may have negative implications for the supply of qualified labor in science and engineering. As STEM degrees seem to be very profitable private investments for college graduates (Arcidiacono, 2004), differences in the choice of the field of study seem to explain a significant part of the gender wage differential amongst graduates.1 The persistence of horizontal gender segregation may hinder the closing of the gender gap in earnings.
Previous literature has already investigated why women are less likely to enroll in STEM programs. Several explanations have been suggested. A first strand of the literature shows that students consider expected earnings when making educational choices (See for example Montmarquette et al., 2002, Varga, 2006, Boudarbat, 2008, and Arcidiacono et al. 2012). However, women expect smaller earnings gains from higher education studies than men even when controlling for the field of study. Additionally, women are less responsive to expected earnings than men and therefore they are less likely to enroll in study programs that lead to higher labor market returns such as STEM programs. Other studies investigated the role of gender differences in abilities. Paglin and Rufolo (1990) found that the difference in mathematical ability is the main reason for the difference in the major choice by gender. The findings of other research show that ability sorting is less able to explain the underrepresentation of women in STEM majors as the gender gap in
1 See for example Daymont and Andrisiani (1984), Machin and Puhani (2003), and Black et al.
(2008).
6
mathematics achievement and aptitude is small and has decreased for several decades (Friedman, 1989; Xie and Shauman 2003; Goldin et al. 2006).2
Another strand of the literature investigated the role of differences in risk aversion by gender (Bertrand, 2010; Croson and Gneezy, 2009; Eckel and Grossman, 2008; Gneezy et al., 2003) and gender differences in overconfidence and competitiveness (Reuben et al.
2015). These studies found that women are more risk-averse and are less self-confident about their academic abilities than men. This also explains gender differences in the choice of field of study and why women are less likely to apply to more competitive study programs than men.
Other research concludes that the above channels are less important in explaining gender differences in enrollment in STEM programs and investigates the role of preferences. Zafar (2013) finds that gender differences in college majors can mainly be explained by differences in preferences and tastes between male and female students and differences in beliefs about future earnings explain only a small part of the gap. Gemici and Wiswall (2014) show that gender differences in the distribution of major-specific skills, while significant, are far less important in explaining the gender gap and that differences in preferences for majors are the main driving force behind the gender gap in college major choice.
Taken together, research suggests that preferences may be an important reason for the under-representation of women in STEM fields. However, preferences are usually considered to be constant over time in previous research. This paper contributes to the literature by investigating whether changes in admission standards affect the choice of STEM programs and could thereby affect the gender composition in STEM programs. We use an exogenous shock to the likelihood of selection for a college major which was relatively favourable for STEM-programs in Hungary and investigate how women and men adapted their choices for STEM majors in response to this shock. Limiting the number of state-funded places in non-STEM programs makes applying to these programs more competitive. If women are more risk-averse, they would be more affected by such a
2 Wang et al. (2013) found that the pattern of gender differences in math and verbal ability may result in females having a wider choice of careers, in both STEM and non-STEM fields, compared with males. They found that mathematically capable individuals who also had high verbal skills were less likely to pursue STEM careers than were individuals who had high math skills but moderate verbal skills and that the group with high math and high verbal ability included more females than males.
7
policy reform and decide not to apply to higher education anymore or apply to other fields of study if they perceive programs in other fields of study as adequate substitutes.
We apply our analysis to Hungary where students are selected before enrollment by high school results and matriculation exam scores. Students submit their ranking of preferred study options and can choose between state-funded places in which they do not have to pay tuition fees or self-funded places in which they pay for the full costs of their education. As fewer students apply for self-funded places, the odds of being admitted to these programs are larger. Ranking at least one self-funded option can be a good strategy in order to increase the probability of admission.
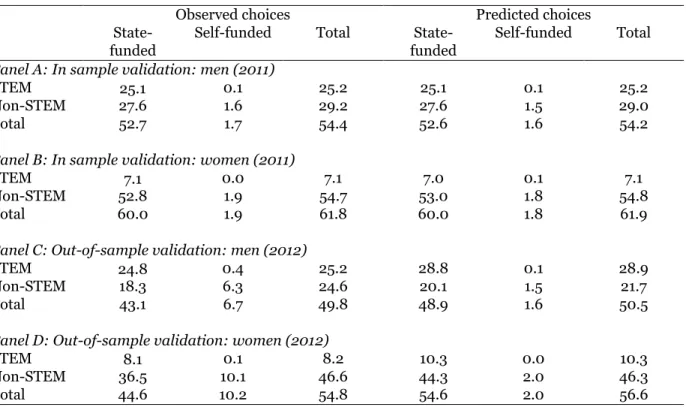
We consider multiple outcomes and evaluate the impact of the reform on (1) the decision to apply to higher education, (2) the number of study options ranked on the preference list, (3) the choice between STEM and non-STEM programs, and (4) the probability of choosing for a self-funded place.3 To uncover the behavioral mechanisms that lead to the realized outcomes, we estimate a structural model of program and institution choice. As the reform affected the chance to be admitted to higher education, we assess how responsive men and women are to the odds of being admitted to a program when making their application decisions. We estimate the model on a cohort before the policy change and externally validate the model on the cohort that was affected by the reform. We show that our model performs reasonably well in predicting major choices out-of-sample. Finally, we use the model to simulate how an alternative policy that stimulates enrollment in STEM programs without discouraging students to apply for other programs, would affect application decisions of men and women.
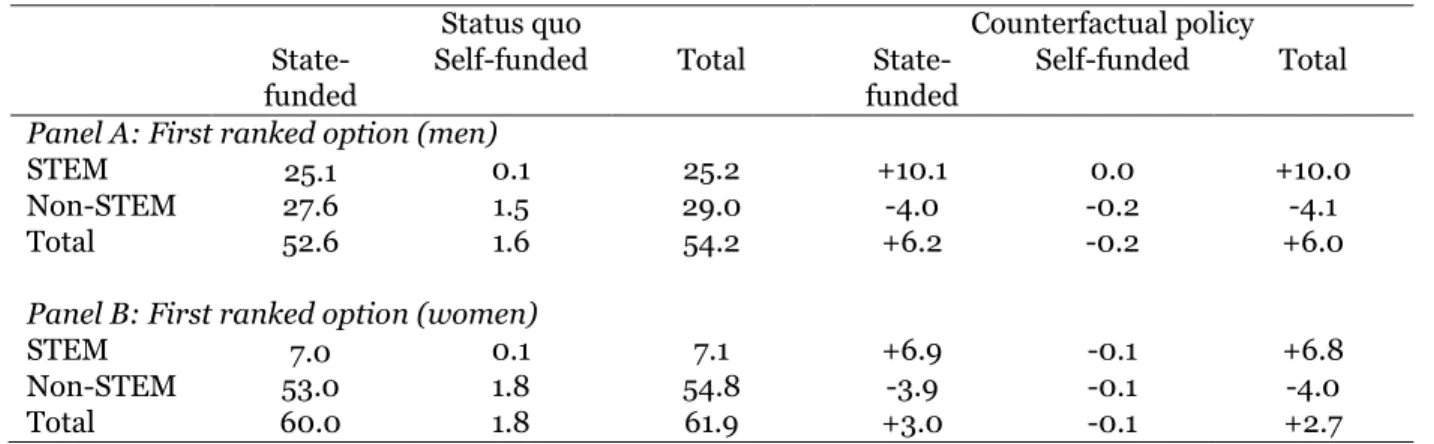
Our main finding is that admission policies differently affect application decisions of men and women. After the reform, fewer students applied to higher education. This effect is larger for women. After the reform, more men and women apply for STEM and self- funded programs. This last effect is stronger for women and after the reform, proportionally more women switched to a self-funded non-STEM program. The structural model provides further explanations for these findings and shows that women have lower preferences for STEM programs, but they are more responsive to admission probabilities when making their choices. We show that an open access policy in STEM programs would stimulate more men and women to apply to these programs. Under this alternative policy,
3 The reform reduced the number of state-funded options in which students do not have to pay tuition fees in non-STEM programs. After the reform, almost no students were admitted to state- funded programs in economics, while the number of students admitted to state-funded STEM programs was almost not affected.
8
more men than women will substitute to STEM programs. This policy will, therefore, further increase the gender gap in STEM programs.
The remainder of this paper is organized as follows. Section 2 provides an institutional overview of higher education in Hungary and the admission system and discusses the policy reform. Section 3 takes a first look at the rich register-based data, describing application decisions before and after the reform. Section 4 evaluates the causal impact of the reform. Section 5 sets up and estimates the structural model and assesses how well the model predicts choices within and out-of-sample. Finally, section 6 simulates the impact of an alternative admission policy that stimulates enrollment in STEM programs.
2. INSTITUTIONAL BACKGROUND
2.1 ADMISSION TO HIGHER EDUCATION IN HUNGARY
All high school graduates who successfully passed the matriculation exams, that is whose results exceeded the 25 % threshold, are entitled to apply to academic higher education.4 The Hungarian secondary school system is stratified with three types of secondary schools.
The academic secondary schools and the vocational secondary schools provide matriculation exams while the vocational training schools do not, that is students finishing vocational training schools are not entitled to apply for higher education studies. Students finishing their studies in academic secondary schools or vocational secondary schools have to take matriculation exams of Hungarian literature and grammar, mathematics, history, one foreign language and at least one subject of the student's choice (this can be anything that they have learned before for at least 2 years).5 The choice of the additional
4 We study application decisions to academic higher education. There are two types of academic programs: academic bachelor programs and undivided programs. Academic bachelor programs last for three or four years. After completing an academic bachelor program, students can apply or a master program. Undivided programs are for example medicine or law. These programs provide first degrees, but their duration is longer than that of the bachelor programs. The undivided programs last at least for five years (in the case of medicine 6 years). Students can also apply to study options in vocational higher education. As these options differ from academic higher education and typically take only one or two years of studying, we do not consider these options in our analysis.
5 For each high school graduate, we observe the result on all matriculation exams that this student has taken. All high school graduates of academic and vocational secondary schools take matriculation exams in mathematics, Hungarian language and history. As we observe for all potential applicants only exam scores on these three courses, our analysis considers only these three courses.
9
matriculation exams depends on the programs students apply for (e.g. if a student applies for engineering, she has to take a matriculation exam for physics).
In February, prospective students can apply for a given orientation (such as economics, education, medical studies) at a specific institution for the next academic year.6 Students may apply to as many study options as they want, but they must state their preference ranking. Students pay a fixed fee of approximately 30 euro when they apply to higher education and they are charged an additional fee for every program of about 10 euro after the third program they rank. Most applicants, therefore, limit their ranking to at most 4 programs. Higher education institutions, irrespective of being state-owned or private, offer state-funded and fee-paying places for applicants. The amount of the tuition fee is determined by higher education institutions in accordance with regulations stipulated by government decrees and differs between programs. The tuition fee corresponds approximately to the minimum monthly wage (around 300 EUR) charged for each semester (Biro, 2011), but differs between programs. Tuition fees are on average higher for STEM than for non-STEM programs although medical training is the most expensive as in most other countries. The applicants must also indicate whether they are willing to pay the contribution or whether they are applying for a state-financed place regarding each program in their lists. (For example, the first choice of a student may be a state-financed place in economics at institution A, her second choice might be a state- financed place in law in institution B, and her third choice can be a privately-financed place in economics again at institution A and so on.) When making the decision to apply to a privately-financed place, students trade off the higher costs of applying to such a study option with the higher odds of being accepted to at least one program.
The matching scheme is based on a centralized scoring system. The scores are coming from students’ secondary school grades and the results of the matriculation exams.7 Students take these matriculation exams in May and June after they have submitted their applications. Students can choose between normal or advanced matriculation exams. An advanced matriculation exam may result in extra scores, but these are more difficult to pass. Exams are centralized, but a student may have different scores for different
6 We consider only applications to full-time academic higher education. There are also some part- time programs, but almost all high school graduates apply for full-time academic programs.
7 Before 2000, the system was less centralized and universities could hold interviews (Biro, 2011).
10
programs, as only the relevant subjects are considered.8 Extra scores can be obtained if the applicant has a certificate in foreign languages, or if the applicant is from a disadvantaged family background. The specific algorithm used in the matching process is a variant of the deferred acceptance algorithm (Shorrer and Sovago, 2018). Students obtain a score for each program they applied to.
Each year, the Ministry of Human Resources determines the number of students admitted to tuition-free, state-financed places by field of study and institutions. The number of students admitted to fee paying places is also determined by the government.
Based on the scores of all students and the capacity of the program, the government announces a minimum score in July that students have to achieve in order to be admitted to the program. Each student gets at most one offer if he or she achieved the minimum admission score to one or more study programs at specific institutions. If a student achieved the minimum admission score for an institution/field specialization he or she has applied for with a better preference ranking, he or she will be refused automatically from other institutions/fields of specialization even if he or she has achieved the minimum admission score of the latter institutions, as well. Students accepted to a degree program in a certain field of study follow an established program of courses and exams. Mobility is low between programs, and it is difficult to change fields of study once accepted to a specific degree program. Students who are not admitted in a main round that ends in July can participate in the second matching round for unfilled programs at the end of the summer.9
2.2 THE POLICY REFORM
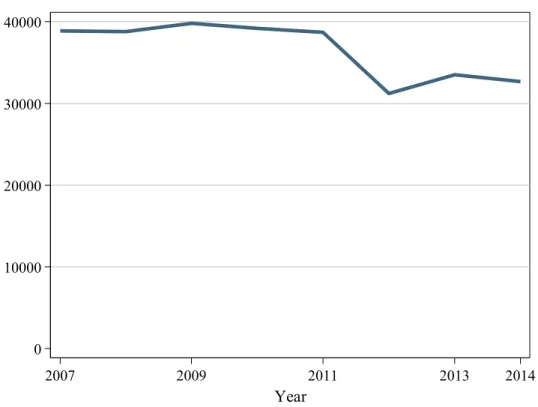
In December 2011, the Hungarian government announced that it would substantially decrease the number of state-financed places in higher education in 2012. Figure 1 shows that the total number of students admitted to full-time state-funded academic higher education for first degrees decreased from 39000 in 2011 to 31000 in 2012. The reason for this reform was that according to the government, too many students were attending higher education which leads to overinvestments in general and in some fields of studies.
The aim of the reform was to decrease the number of students in higher education,
8 For example: for computer science programs, the grades and exam scores for physics are counted, but for economics, the exam score of economics is considered instead, besides the main subjects such as mathematics, Hungarian literature and grammar and history.
9 In our analysis, we consider only applications for the first main round that ends in July.
11
especially in non-STEM programs. A further aim was to cut public expenses and increase cost-sharing in higher education in order to reduce the public debt. In more recent years, the Hungarian government again increased the number of places, but to a lower level as before the reform.
Figure 1 Number of admitted students to academic programs
0 10000 20000 30000 40000
Number of admitted
2007 2009 2011 2013 2014
Year
Note: Total number of admitted students in academic programs full-time education.
Based on own calculations.
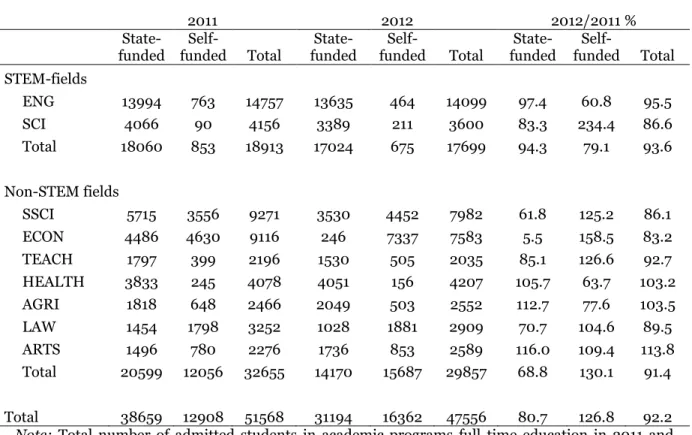
Table 1 shows the changes in the number of admitted students to STEM and non- STEM programs and by more detailed fields of study. There was a large decrease in the number of admitted students to state-funded places to non-STEM programs between 2012 and 2011. The number of admitted students in 2012 was only 69% of the number of admitted students in 2011 (or a decrease from 20599 to 14170). The decrease was much smaller for STEM programs. More than 94 percent of the number of admitted students to state-funded places in STEM programs was admitted in 2012. The number of admitted students to self-funded places moved in the opposite direction. For non-STEM programs, there was a 30% increase while for STEM programs there was a decrease of about 20%.
The fact that fewer students were admitted to state-funded non-STEM programs and that
12
the number of students admitted to state-funded STEM programs did almost not change, increased the relative probability of acceptance for state-financed STEM programs. This could have stimulated more students to apply for state-funded STEM programs.
Table 1 Number of admitted students to academic higher education
2011 2012 2012/2011 %
State-
funded Self-
funded Total State-
funded Self-
funded Total State-
funded Self-
funded Total STEM-fields
ENG 13994 763 14757 13635 464 14099 97.4 60.8 95.5
SCI 4066 90 4156 3389 211 3600 83.3 234.4 86.6
Total 18060 853 18913 17024 675 17699 94.3 79.1 93.6
Non-STEM fields
SSCI 5715 3556 9271 3530 4452 7982 61.8 125.2 86.1
ECON 4486 4630 9116 246 7337 7583 5.5 158.5 83.2
TEACH 1797 399 2196 1530 505 2035 85.1 126.6 92.7
HEALTH 3833 245 4078 4051 156 4207 105.7 63.7 103.2
AGRI 1818 648 2466 2049 503 2552 112.7 77.6 103.5
LAW 1454 1798 3252 1028 1881 2909 70.7 104.6 89.5
ARTS 1496 780 2276 1736 853 2589 116.0 109.4 113.8
Total 20599 12056 32655 14170 15687 29857 68.8 130.1 91.4
Total 38659 12908 51568 31194 16362 47556 80.7 126.8 92.2 Note: Total number of admitted students in academic programs full-time education in 2011 and 2012. Based on own calculations. The numbers in the last three columns present the number of students admitted in 2012 relative to the number of students admitted in 2011 and are expressed in percentages.
Nevertheless, there were differences by more detailed field specializations within the STEM and non-STEM groups. Between 2011 and 2012 the number of admitted students to state-funded places in Engineering and Computer Sciences (ENG) decreased by less than 3 percent while the number of students admitted to state-funded places in Natural Sciences (SCI) decreased about 17 percent. As for non-STEM programs: there were large cuts in the number of students admitted to state-funded places in Economics (ECON), Law and Administration (LAW), Humanities and Social Sciences (SSCI), and teacher training (TEACH). These are the fields where women were traditionally overrepresented. The cuts were largest in the field of economics. In 2011, 4486 students were admitted to a state- funded place in economics. After the reform, this number decreased to 246. There we
13
observe large shifts from state-financed to privately-financed programs. Before the reform, 4630 students were admitted to a self-funded program in economics. This number increased to 7337 after the reform. This shows that many students are willing to pay the tuition fee in order to attend higher education. There were also small increases in the number of students admitted to some non-STEM programs such as Health, Agricultural Sciences (AGRI), and culture and languages (ARTS).
3. APPLICATIONS TO HIGHER EDUCATION IN HUNGARY
3.1 DATA
To analyze how the reform affected application decisions, we make use of a rich administrative dataset. We observe the full sample of high school graduates from academic and vocational high schools in the matriculation examination data of the Hungarian Education Office. Our sample contains all students who took the matriculation exams in 2011 and 2012. For each student, we have detailed information on the exam results for mathematics, Hungarian language, and history. We also observe gender, date of birth, and secondary school. Based on a unique student identification number, we merge this dataset with the full sample of application-admission data of the Higher Education Admission Office.10 The application-admission dataset contains data for all applications of the students: the institution/faculty where the students made an application, name of the program, level of the program, a form of funding, and the program where the applicant was admitted.11 We omit applications to vocational higher education from the preference ranking of students because we limit the analysis to application decisions to academic higher education. In principle, students can rank as many study options as they want but we observe that only 0.7% of applicants ranks more than 6 options. The variable cost that students have to pay for each study program they rank after the third ranked program, can be a possible explanation for the fact that students do not rank more options. Because only
10 Based on a personal ID number, we could match the students in the two datasets (about 200-300 cases or 0.03 percent of applicants could not be merged.)
11 For the students who apply to higher education, we have additional information about the type of secondary school, high school results, an indicator for being from disadvantaged family background and whether the students obtained a foreign language exam certificate. However, we do not observe this information for students who do not apply to higher education. We therefore only use this information in the regressions that contain only the sample of applicants.
14
0.7% of applicants rank more than 6 options, we consider only the first 6 options to academic programs on the preference ranking in our analysis.
3.2 HIGH SCHOOL GRADUATES
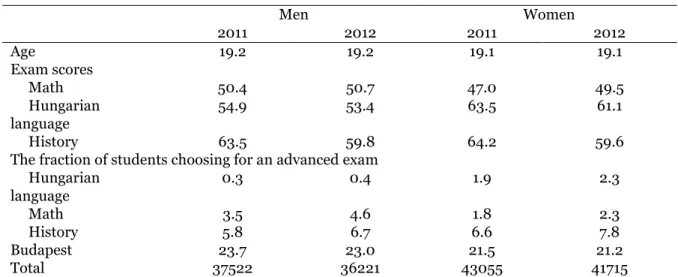
Table 2 compares the sample of students who graduated from academic and vocational secondary schools before and after the policy reform. In 2012, fewer students graduated due to a demographic decline in Hungary (T-tudok, 2015). Proportionally more women than men graduate from high school. On average, students graduate from high school at the age of 19. This average age is slightly higher for men (19.2) compared with women (19.1). Graduation age at the high school has not changed after the reform.
To graduate from high school, all students have to take matriculation exams in the following three courses: Hungarian language, mathematics and history. In Table 2, we observe that women perform better on the Hungarian language, but worse on mathematics. Exam scores are similar before and after the reform but are slightly lower for history.12 Students can choose for a normal matriculation exam or an advanced exam.
Performing well on these advanced exams increases the probability of being admitted to higher education. However, only a small fraction of students choose an advanced exam.
Women are more likely to choose for an advanced exam in the Hungarian language, but less likely to choose for an advanced exam in mathematics. After the reform, a slightly larger fraction of high school graduates choose for an advanced exam. The increased selectivity to higher education after the reform could have influenced the decision to choose for a matriculation exam of the normal level or the advanced level. Figure A1 in Appendix illustrates the distribution of the matriculation exam scores for the three courses. The distribution of exam scores looks similar before and after the policy reform and confirms the finding of Table 2 that scores of high school graduates on mathematics are slightly higher after the reform, and that the scores on Hungarian language and history are slightly lower after the reform.
12 Note that the average matriculation exam score is slightly higher than 50% for mathematics and Hungarian language, implying that a substantial fraction of the students scores below 50%. These students can still apply to academic higher education as the threshold is at 25%. Nevertheless, the fact that they performed less well decreases their chances of being admitted to higher education.
15
Table 2 High school graduates
Men Women
2011 2012 2011 2012
Age 19.2 19.2 19.1 19.1
Exam scores
Math 50.4 50.7 47.0 49.5
Hungarian language
54.9 53.4 63.5 61.1
History 63.5 59.8 64.2 59.6
The fraction of students choosing for an advanced exam Hungarian
language
0.3 0.4 1.9 2.3
Math 3.5 4.6 1.8 2.3
History 5.8 6.7 6.6 7.8
Budapest 23.7 23.0 21.5 21.2
Total 37522 36221 43055 41715
Note: Background characteristics of all students who graduate from academic and vocational secondary education. Exam scores are expressed as percentages. The fraction of students choosing for an advanced exam is expressed as a percentage of high school graduates.
Performing well on the different matriculation exams increases the probability of being admitted to higher education, but the weight attached to each exam differs between programs. Students who apply only to STEM programs might, therefore, study more for mathematics than students who apply only to language programs. The scores might, therefore, reflect both ability and study effort. Note that there is a positive weight for mathematics, Hungarian language and history for all programs in higher education.
Students, therefore, have an incentive to score well on all three courses. Students who do not apply to higher education also have an incentive to perform well on the matriculation exams because matriculation exams are required by the employers in many positions.
Finally, we also observe the location of the secondary school of students which is a proxy for the place of residence. Approximately 22% of students attended a high school in Budapest, the capital and economic center of Hungary.
3.3 APPLICANTS TO HIGHER EDUCATION
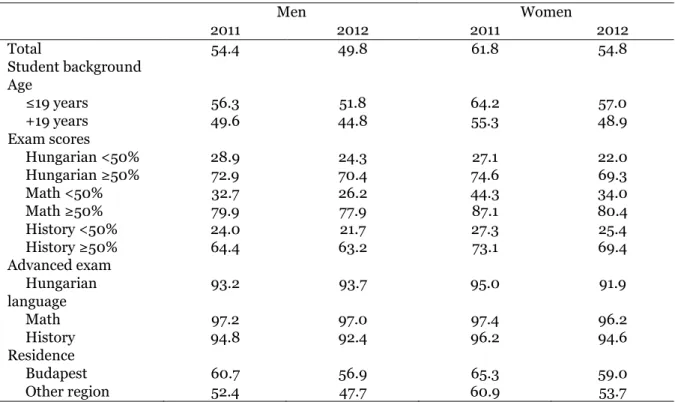
Table 3 compares the decision to apply to academic higher education before and after the policy reform. After the reform, less high school graduates applied to higher education.
Women are more likely to apply to higher education than men but were more discouraged from applying by the reform. The fraction of women applying to higher education dropped from 61.8% to 54.8% (-7.0 %points), compared with a 4.6 %points decrease for men (a
16
change from 54.4% to 49.8%). Students who are older than 19 when graduating from high school are less likely to apply to higher education. Both young and older students are less likely to apply after the reform.
Table 3 Applying to higher education
Men Women
2011 2012 2011 2012
Total 54.4 49.8 61.8 54.8
Student background Age
≤19 years 56.3 51.8 64.2 57.0
+19 years 49.6 44.8 55.3 48.9
Exam scores
Hungarian <50% 28.9 24.3 27.1 22.0
Hungarian ≥50% 72.9 70.4 74.6 69.3
Math <50% 32.7 26.2 44.3 34.0
Math ≥50% 79.9 77.9 87.1 80.4
History <50% 24.0 21.7 27.3 25.4
History ≥50% 64.4 63.2 73.1 69.4
Advanced exam Hungarian language
93.2 93.7 95.0 91.9
Math 97.2 97.0 97.4 96.2
History 94.8 92.4 96.2 94.6
Residence
Budapest 60.7 56.9 65.3 59.0
Other region 52.4 47.7 60.9 53.7
Note: Descriptive statistics are expressed as a percentage of the total number of male and female high school graduates before and after the reform.
The scores on the matriculation exams are an important factor of the decision to apply to higher education. Students who perform well, with scores above 50%, are more likely to apply for higher education. Students with low exam scores are more affected by the reform and less likely to apply to higher education. We observe a similar effect for the three courses. However, this effect differs between men and women. Men who perform well on their matriculation exams are almost not affected by the policy reform. Application decisions of men with high scores on mathematics or Hungarian language dropped by about 2 %points. However, women with high scores exhibit a larger decrease in the probability to apply to higher education of about 7 %points. We observe a similar pattern for the other two courses. Next, Table 3 shows that almost all students who choose for an advanced matriculation exam apply to higher education. However, these students are also affected by the reform as the fraction of students applying to higher education also
17
decreases for these students. While there is almost no decrease in the probability to apply to higher education for men (except for the students who choose the advanced exam for history), women who choose the advanced exams were less likely to apply after the reform.
Finally, we observe that students living in the area of Budapest are more likely to apply to higher education. Both students who live in Budapest and in the rest of Hungary are less likely to apply to higher education after the reform.
3.4 THE PREFERENCE RANKING OF STUDENTS
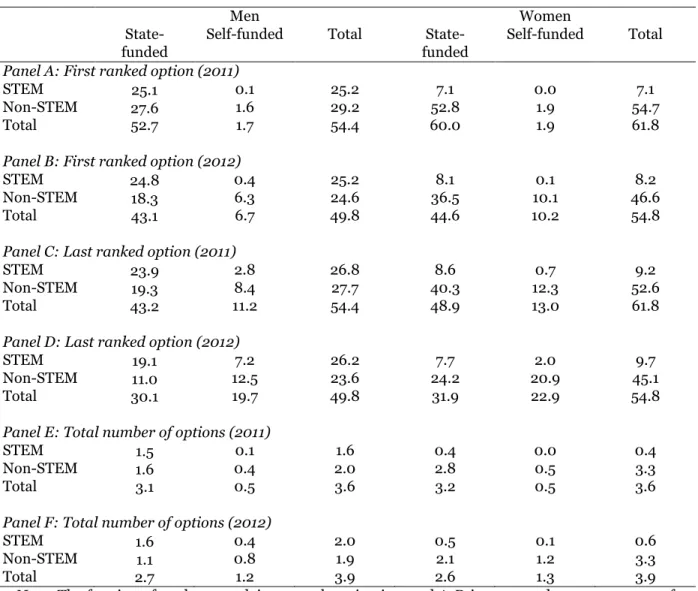
Table 4 studies the complete preference ranking and presents the first and the last option students apply to, and the total number of options students rank on their preference list.13 We consider all high school graduates before and after the reform. We distinguish between STEM and non-STEM programs and state-funded and self-funded places. The numbers are expressed as a percentage of high school graduates. Tables A1 and A2 in Appendix provide more detailed information about the specific major students apply to. The first two panels of Table 4 consider the option that students ranked first on their application file. We immediately observe large differences between men and women. Before the reform, 25.2% of male high school graduates ranked a STEM program first, while this is only 7.1% for women. After the reform, a similar fraction of male high school graduates ranked a STEM program first, but a larger fraction of female high school graduates (8.2%) now prefers a STEM program.
Most students prefer a state-funded place, both before and after the reform. However, after the reform, a larger fraction of the students applied for a self-funded place. This effect is largest for programs in economics as shown in Table A1 in Appendix. This field of study was most affected by the reform. Proportionally more women apply for a self-funded place after the reform. This can be explained by the fact that the reform made applying for state funded non-STEM programs less attractive. In these programs, women are overrepresented. Note that ranking a self-funded program first is not a rational strategy for students if there are also state-funded places in the same program, which was less likely in non-STEM programs after the reform. Students can rank as many programs as they want, and they do not have to pay an additional contribution if they rank a self- funded program if they already ranked the same state-funded program. Shorrer and
13 For students who apply to only 1 program in higher education, the last option on their preference list is the same option as the first ranked program.
18
Sovago (2018) study these mistakes in rankings in Hungary and find that the fraction of students making such mistakes has increased after the reform.
Table 4 Application decisions in higher education: ranking
Men Women
State- funded
Self-funded Total State- funded
Self-funded Total Panel A: First ranked option (2011)
STEM 25.1 0.1 25.2 7.1 0.0 7.1
Non-STEM 27.6 1.6 29.2 52.8 1.9 54.7
Total 52.7 1.7 54.4 60.0 1.9 61.8
Panel B: First ranked option (2012)
STEM 24.8 0.4 25.2 8.1 0.1 8.2
Non-STEM 18.3 6.3 24.6 36.5 10.1 46.6
Total 43.1 6.7 49.8 44.6 10.2 54.8
Panel C: Last ranked option (2011)
STEM 23.9 2.8 26.8 8.6 0.7 9.2
Non-STEM 19.3 8.4 27.7 40.3 12.3 52.6
Total 43.2 11.2 54.4 48.9 13.0 61.8
Panel D: Last ranked option (2012)
STEM 19.1 7.2 26.2 7.7 2.0 9.7
Non-STEM 11.0 12.5 23.6 24.2 20.9 45.1
Total 30.1 19.7 49.8 31.9 22.9 54.8
Panel E: Total number of options (2011)
STEM 1.5 0.1 1.6 0.4 0.0 0.4
Non-STEM 1.6 0.4 2.0 2.8 0.5 3.3
Total 3.1 0.5 3.6 3.2 0.5 3.6
Panel F: Total number of options (2012)
STEM 1.6 0.4 2.0 0.5 0.1 0.6
Non-STEM 1.1 0.8 1.9 2.1 1.2 3.3
Total 2.7 1.2 3.9 2.6 1.3 3.9
Note: The fraction of students applying to each option in panel A-D is expressed as a percentage of high school graduates of respectively 2011 and 2012. The total number of options students rank on their preference list in panel E and F is the average of all high school graduates who apply to higher education in 2001 and 2012.
The following two panels of Table 4 look at the last option ranked on the application list of students. We observe similar patterns as for the first ranked option when we look at the major decision. However, we observe that more students rank a self-funded place as their last option, especially after the reform. 11.2% of men and 13.0% of women ranked a self-funded program on the last place before the reform. This fraction increases to respectively 19.7% and 22.9% for men and women after the reform. In these self-funded
19
places, students have a higher probability of being admitted. Varga (2006) shows that students are more sensitive to their expected admission probabilities for their last ranked option than for their most preferred option. Tables A1 and A2 in Appendix show that after the reform, more students applied to a self-funded program in economics than a similar state-funded option. This can be explained by the fact that after the reform the government reduced the number of state funded places to almost 0 in economics.
The final 2 panels of Table 4 illustrate how the reform affected the total number of study options, the number of self-funded options, and the number of STEM programs for which students apply. We consider only students who applied for at least one study option.
Before the reform, students applied on average for 3.6 programs. After the reform, applicants ranked on average 3.9 options. This pattern is similar for men and women.
Students could have decided to apply to more options in order to increase their probability of being admitted in the more selective post reform period. Alternatively, the reform could have discouraged applications from students who would otherwise have ranked few options and have now decided not to apply to higher education. We also observe that the reform affected the decision to apply to STEM and self-funded options which were less affected by the policy reform. Before the reform, applicants ranked on average 0.5 self- funded places. This number increased to 1.2 for men and 1.3 for women after the reform.
Men rank more STEM programs than women before and after the reform. The increase in STEM options after the reform is larger for men.
4. EVALUATION OF THE REFORM
The descriptive statistics in the previous section already provide some first evidence about the potential effects of the reform on application decisions in higher education. In this section, we evaluate how the reform differently affected the decision to apply to higher education, the choice between STEM and non-STEM programs, and the choice between state-funded and self-funded programs of men and women after controlling for student background. To investigate the impact of the reform, we estimate the following regression equation:
The coefficient of interest identifies how women responded differently to the reform than men. In all specifications, we control for matriculation exam scores. We also control
20
for the level of the matriculation exams by including a dummy equal to one if a student took an advanced exam. We additionally control for age, socio-economic background of the students, and region fixed effects.14 We estimate the probability of applying to higher education and the probability of choosing for STEM or self-funded places by logit, and we report marginal effects. We estimate the number of options students rank by OLS. Table 5 shows only the coefficients for gender, the period after the reform, and the interaction between both variables. Tables A3-A5 in Appendix show the full regression output.
Table 5 Evaluation of the reform
Apply Total options
Coef. St. error Coef. St. error
Female 0.080* (0.004) 0.096* (0.014)
2012 -0.047* (0.004) 0.272* (0.015)
Female*2012 -0.049* (0.006) -0.111* (0.020)
STEM ranked first STEM ranked last At least one STEM Total STEM Coef. St. error Coef. St. error Coef. St. error Coef. St. error Female -0.299* (0.005) -0.305* (0.005) -0.339* (0.005) -0.912* (0.013) 2012 0.018* (0.004) 0.016* (0.004) 0.014* (0.005) 0.302* (0.017) Female*2012 -0.005 (0.006) -0.005 (0.006) 0.004 (0.007) -0.239* (0.020)
Self ranked first Self ranked last At least one Self Total Self Coef. St. error Coef. St. error Coef. St. error Coef. St. error Female 0.003 (0.003) 0.012* (0.005) 0.022* (0.005) 0.049 (0.010) 2012 0.105* (0.003) 0.200* (0.005) 0.245* (0.005) 0.660* (0.013) Female*2012 0.026* (0.004) 0.017* (0.006) 0.028* (0.007) 0.114* (0.017) Note: Robust standard errors in parentheses; * p<0.05. The decision to apply for higher education and to rank a STEM or self-funded program is estimated by a logit regression. Results are reported as marginal effects. The regressions for the total number of options that students rank are estimated by OLS. The decision to apply to higher education is estimated on the sample of all high school graduates of 2011 and 2012 (158513 observations), while the other regressions are limited to the sample of high school graduates who rank at least one option (87939 observations). All regressions control for age, matriculation exam scores, and region fixed effects. The regressions that are estimated on the sample of applicants additionally control for socio-economic background.
The complete output of the regressions is presented in Tables A3-A5 in Appendix.
The first panel of Table 5 shows how the reform affected the decision to apply to higher education and the number of study programs students rank on their preference list. Before the reform, women were 8.0 %points more likely to apply to higher education than men.
This finding confirms the higher application rates of women shown in Table 3. Next, we observe that the reform discouraged the decision to apply to higher education. After the reform, students are significantly less likely to apply to higher education. The interaction
14 We observe socio-economic status only for the sample of applicants and not for the students who did not apply to higher education. Socio-economic status is measured by a dummy variable equal to one if the per capita household income is lower than 130% of the minimum pension.
21
effect between gender and the dummy for the period after the reform reveals that the reform mostly affected the application decisions of female students. The probability to apply to higher education decreased by 4.7 %points for men, but by 9.6 %points for women. This can be explained by the fact that the reform discouraged enrollment in non- STEM programs that are typically preferred by women as shown in Table 4. The second regression of Table 5 shows how the reform affected the total number of study options students rank on the preference ranking. Before the reform, women applied to 0.10 more study options than men. After the reform, both men and women applied to more options.
However, the increase is larger for men (+0.27) than for women (+0.16), and male applicants now apply to more options than women.
The second panel of Table 5 assesses whether the reform affected the decision to apply to STEM programs. After the reform, there were less state-funded places in non-STEM programs. Students could therefore apply more to STEM programs in order to increase their chances to be admitted to higher education. We consider only the students who applied to at least one study program. The first two specifications estimate the probability of ranking a STEM program on the first and last place on the preference ranking. Before the reform, women are 29.9 %points less likely than men to rank a STEM program as their most preferred option. After the reform, both men and women are more likely to rank a STEM program (+1.8 %points). We do not find a significantly different effect of the reform between men and women. We obtain similar results when we consider the last option on the preference ranking in the second regression. The third column shows that before the reform women were 33.9 %points less likely than men to rank at least one STEM program.
The reform increased the fraction of male and female applicants applying to at least one STEM program by 1.4 %points. The last column shows that female applicants ranked on average 0.91 STEM options less than men before the reform. After the reform, male applicants ranked on average 0.33 STEM options more than before the reform. The number of STEM options ranked by female applicants increased by a smaller amount of 0.06.
The last panel of Table 7 investigates whether students were more likely to apply for self-funded places after the reform. When accepted to a self-funded place, students must pay a tuition fee. Before the reform, men and women were equally likely to rank a self- funded option on the first place of their preference list. After the reform, the probability of ranking a self-funded program first increases by 10.5 %points for men, and by 13.1
%points for women. The second regression estimates the probability of ranking a self-
22
funded program on the last position on the preference list. The increase in the probability of ranking a self-funded program is larger for men and women than for the previous outcome. The last two columns show that after the reform more men and women rank at least one self-funded program and they also rank more self-funded options than before the reform.
Tables A3-A5 in Appendix show the impact of the other control variables on application decisions. We find that matriculation exam scores significantly affect application decisions. Students who scored better on the exams or students who choose for an advanced exam are more likely to apply, rank more state-funded programs, but they are less likely to rank a self-funded program. Students who perform well on mathematics are more likely to apply to STEM programs. Finally, we find that disadvantaged students apply to less programs and are less likely to apply to self-funded programs.
5. STRUCTURAL MODEL OF APPLYING TO HIGHER EDUCATION
By decreasing the number of state-funded places in non-STEM programs, students had a lower probability of being admitted to these programs. To uncover the behavioral mechanisms that lead to the realized outcomes we found in the previous section, we estimate a structural model of program and institution choice, and we investigate whether students consider the probability of being admitted when applying. We assess whether this effect differs between men and women. We estimate the model on a cohort before the policy change and externally validate the model on the cohort that was affected by the reform.
5.1 DESCRIPTION OF THE MODEL
During the last year of secondary education, students can choose to apply for higher education in Hungary or not. A student applies to a study program at an institution to maximize the utility of studying. The utility of applying to a specific study option is given by
23
with the deterministic part of utility. Utilthe ity depends on an alternative specific constant , and personal characteristics such as gender and high school background . Utility also depends on the admission probability . Students obtain a higher utility from programs for which they have a higher probability of being admitted.15 We interact this probability with gender to assess whether women are more responsive to admission probabilities when making their application decisions. Admission probabilities differ between programs but also between institutions. Given that students have to pay a fee for each study program they rank after their third option, students might strategically apply to a less popular institution for which they have higher admission probabilities.
Previous literature shows that travel distance is an important factor of participation in higher education and the decisions where and what to study. Students have a preference for study options located in their neighborhood.16 We therefore include the travel distance between the location of the high school of the student and the institution as a determinant of utility.17 Finally, utility depends on an unobserved preference shock , which is iid type 1 extreme value distributed. The probability that student chooses for study program at institution is then given by the logit formula
In the model, students take into account the probability of being admitted when applying to higher education. The probability that student is admitted to study program at institution is given by
and depends on a program alternative specific constant , a vector of matriculation exam scores , and a measure of the capacity of program at institution : .18 Capacity of
15 Varga (2006) shows that students take into account the expected admission probabilities when applying to study programs in higher education in Hungary.
16 See for example Frenette (2010) and Kelchtermans and Verboven (2010). This last study shows that travel distance has a small effect on the participation decision, but a strong impact on the decision where and what to study.
17 As we do not observe the location of residence of the student, we use the location of the high school attended by the student as a proxy for the place of residence of the student.
18 In the estimation of the probability of admission and the utility equation, we do not distinguish between matriculation exams of the normal and the advanced level. Only a small fraction of high school graduates chooses for an advanced exam (see Table 2). Students choosing for an advanced exam in mathematics almost never rank a non-STEM program first. Therefore, it is not possible to
24
the program is defined as the ratio of admitted students relative to the total applicants in the study option. The capacity of the program serves as an exclusion restriction. Capacity influences the utility of applying to an option only indirectly through the effect on the admission probability. We assume that there is no direct effect of capacity on the utility of applying to specific options. Finally, the admission probability depends on an iid type 1 extreme value distributed error term .
We model the choice of all high school graduates in the year before the reform (2011).
In the estimation of the model, we consider only the first option on the ranking of students. In 2011, high school graduates choose between 600 study options in academic higher education. They can choose not to apply to higher education or they can apply for a specific program at a specific institution. Finally, they decide between a state-funded or a self-funded place. Estimation of the model proceeds in two steps. We first estimate the probability of acceptance to the first option of the preference list with a binary logit regression. Next, we estimate the probability of choosing for option at institution with a conditional logit model. Given the size of our dataset, where 80577 students choose between 600 options, it is not computationally feasible to estimate the model with the full dataset. We therefore use a random subsample of 50 percent of the students.
5.2 EMPIRICAL RESULTS
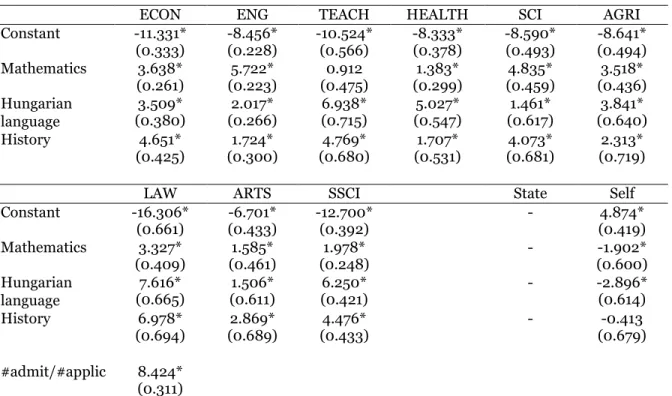
In Table 8, we estimate a binary logit regression for the probability of being admitted to the program ranked first on the preference list. We include interaction effects between matriculation exam scores with the dummies for the specific majors. We find that math, Hungarian language, and history scores significantly affect the probability of being admitted. This effect differs between programs. Performing well on mathematics is most important for science and engineering programs while performing well on the Hungarian language is most important for teaching, law and social science programs. Students have a higher probability of being admitted to a self-funded place. Test scores are less important for being admitted to a self-funded place. Finally, it is easier to be admitted to a less popular program (capacity indicator).
include dummies for the level of the exam when we estimate the probability of admission or the utility of applying to specific majors.
25
Table 9 shows the output of the conditional logit model for applying to the first option on the preference list. We obtain the following main findings that are consistent with the regression results in the previous section. Gender significantly affects the application to the several majors in higher education. Men obtain a lower utility than women in applying for non-STEM programs. Students who are older than 19 years when graduating from high school are less likely to apply to higher education. The scores of the matriculation exams significantly affect the decision to apply for programs in higher education. Scores on the mathematics exam are most important for applying to engineering, economics and science programs. Performing well in the Hungarian language has the strongest effect on applying to law and social science programs. Regarding the choice between state-funded or self- funded programs, we find that students prefer to apply to state-funded places in which they do not have to pay tuition fees. Men, older students, and students living in Budapest are more likely to apply to a self-funded place. Students who perform well on the matriculation exams are less likely to apply for self-funded places.
Table 8 Being admitted to the first ranked program
ECON ENG TEACH HEALTH SCI AGRI
Constant -11.331*
(0.333) -8.456*
(0.228) -10.524*
(0.566) -8.333*
(0.378) -8.590*
(0.493) -8.641*
(0.494) Mathematics 3.638*
(0.261) 5.722*
(0.223) 0.912
(0.475) 1.383*
(0.299) 4.835*
(0.459) 3.518*
(0.436) Hungarian
language
3.509*
(0.380) 2.017*
(0.266) 6.938*
(0.715) 5.027*
(0.547) 1.461*
(0.617) 3.841*
(0.640)
History 4.651*
(0.425) 1.724*
(0.300) 4.769*
(0.680) 1.707*
(0.531) 4.073*
(0.681) 2.313*
(0.719)
LAW ARTS SSCI State Self
Constant -16.306*
(0.661) -6.701*
(0.433) -12.700*
(0.392) - 4.874*
(0.419) Mathematics 3.327*
(0.409) 1.585*
(0.461) 1.978*
(0.248) - -1.902*
(0.600) Hungarian
language
7.616*
(0.665) 1.506*
(0.611) 6.250*
(0.421) - -2.896*
(0.614)
History 6.978*
(0.694) 2.869*
(0.689) 4.476*
(0.433) - -0.413
(0.679)
#admit/#applic 8.424*
(0.311)
Note Standard errors in parentheses; * p<0.05. The probability of being admitted to the first ranked option is estimated with a binary logit regression. The regression is estimated on the sample of all high school graduates that apply to higher education in 2011.