4 6 8 10 12 14
2008 2010 2012 2014 2016 2018
Hungary Czech Republic Slovakia Poland EU 28
2.5 THE IMPACT OF DECREASING COMPULSORY SCHOOL-LEAVING AGE ON DROPPING OUT OF SCHOOL
Zoltán Hermann
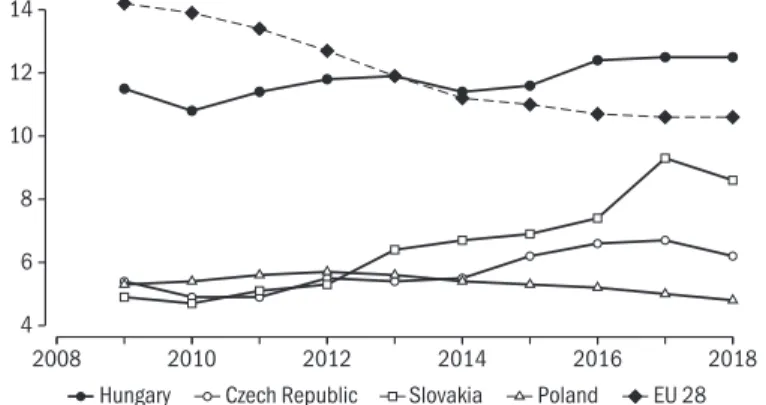
Early school leaving has profound significance for both employment and eq- uity since the lack of upper-secondary qualification (Matura and vocational training certificate in Hungary) results in immensely poor labour market prospects and often leads to persistent poverty. The proportion of early school leavers in Hungary is somewhat higher than the European average: in 2018 it was 12.5 per cent of the population aged 18–24, while the European aver- age was 10.6 per cent (EC, 2019, p. 54). The 3.4 percentage point lag of girls is indeed significant, whereas for boys the difference is only 0.4 percentage points. Compared to the other Visegrad countries, Hungary has by far the highest proportion of early school leavers (Figure 2.5.1). Moreover, while the proportion of early school leavers decreased in most European countries between 2009 and 2018, in Hungary it started to grow after 2015, making it even more challenging to achieve the target of 10 per cent set by the Euro- pean Union by 2020 and also adopted by the Hungarian government. This Subchapter explores what role the reduction of the school-leaving age from 18 to 16 in 2012 had in this increase.1
Figure 2.5.1: The share of early school leavers in the population aged 18–24 in Hungary, in the Visegrad countries and in the EU on average, 2009–2018
Note: Early school leaver: with a lower-secondary (ISCED 2) qualification at most and not in education.
Source: Eurostat.
This study analyses the process of dropping out but does not directly evalu- ate the dropout rate or early school leaving. This can only be reliably assessed when the majority of pupils have completed upper-secondary education and anyone who has not obtained an upper-secondary qualification is unlikely to obtain one. As in Hungary a significant proportion of pupils only complete
1 Act CXC of 2011 on School Education.
upper-secondary education at the age of 21–22 (Varga, ed., 2018), the im- pact of the 2012 reform cannot yet be assessed in this respect. This Subchap- ter examines changes in the proportion of those not in education and lack- ing an upper-secondary qualification at a specific point in time. Since some of the school leavers later return to continue their studies and some are not enrolled because of switching schools, this indicator cannot be regarded as a direct measure of the dropout rate. Thus the value of the indicator we use is not sufficiently informative in itself but changes to it reveal the impact of the school-leaving age reforms.
Earlier research suggests that it is advisable to examine the obtaining of qualifications and the process of dropping out together, because they may yield a different picture. After raising the compulsory school-leaving age to 18 in Hungary in the early 2000s, participation in education increased in the age group 17–18 (Varga, ed., 2018); however, the share of those acquiring an upper-secondary qualification did not increase as a result of the reform (Adamecz-Völgyi, 2018). There is no consensus in international literature re- garding the impact of raising the school-leaving age. Several studies found that raising the school-leaving age increased participation rates but did not have an impact on obtaining an upper-secondary qualification (for example Rai- mondi–Vergolini, 2019, in Italy, Mackey–Duncan, 2013, in the United States), while others found a positive effect in both areas (for example Wenger, 2002, in the United States, Cabus–De Witte, 2011, in the Netherlands). Whereas these studies investigate the impact of raising the school-leaving age, the anal- ysis below looks at the impact of lowering the school-leaving age.
Data and methods
The analysis is based on the Admin3 dataset of the Centre for Economic and Regional Studies containing linked administrative data, which contains in- dividual-level data of 50 per cent of the Hungarian population in 2003 up to 2017 (Sebők, 2019). In the dataset school enrolment status is recorded on a monthly basis, the highest qualification of young people and the results of pupils in the National Assessment of Basic Competences (NABC). The sam- ple includes participants of the assessment of Grade 8 pupils between 2010 and 2013. The descriptive analysis compares these four cohorts of pupils, while the econometric estimation only includes the 2011 and 2012 cohorts. The school- leaving age of 16 applied to those who did not attend upper-secondary school in the academic year of 2011/2012, that is they started upper-secondary stud- ies in September 2012 or later. Consequently, the school-leaving age of 18 applied to 8th graders taking the test in 2010 or 2011 and the school-leaving age of 16 applied to those in Grade 8 in 2012 or 2013. At the same time, pu- pils in Grade 8 in 2013 were also affected by in the vocational education and training reform (see Subchapter 2.4). Moreover, they cannot be observed for
sufficiently long time in the database. Therefore the econometric estimation includes only two cohorts.
This study assesses how the proportion of young people not attending school (not enrolled at a school) and lacking an upper-secondary qualification changes in these cohorts of pupils one, two, … and five years after the competence assess- ment in Grade 8. This essentially covers the educational trajectory of pupils af- ter lower-secondary education, since the large majority of them complete their lower-secondary studies in the school year of the assessment in Grade 8: grade repetition rate at this point is below 1 per cent (Varga, ed., 2018). The sam- ple comprises about 43–49 thousand pupils from each grade; the total num- ber of cases at the time of the competence assessment in Grade 8 was 184,542.
In the following, a descriptive analysis of changes in the share of those not in education and without an upper-secondary qualification and the share of school leavers with an upper-secondary qualification is provided first. Then probit models are used to evaluate the probability of being not in education and without an upper-secondary qualification and that of acquiring an upper- secondary qualification before and after the changes to the school-leaving age, controlling for the observed characteristics of pupils. We performed an analysis on the total sample and on a subsample of pupils with a disadvantaged family background2 because the latter are more likely to attend vocational education not ending in an upper-secondary school leaving examination (Matura) and to drop out of school (see for example Fehérvári, 2015).
The proportion of young people not in education and without a qualification and the proportion of school leavers with a qualification
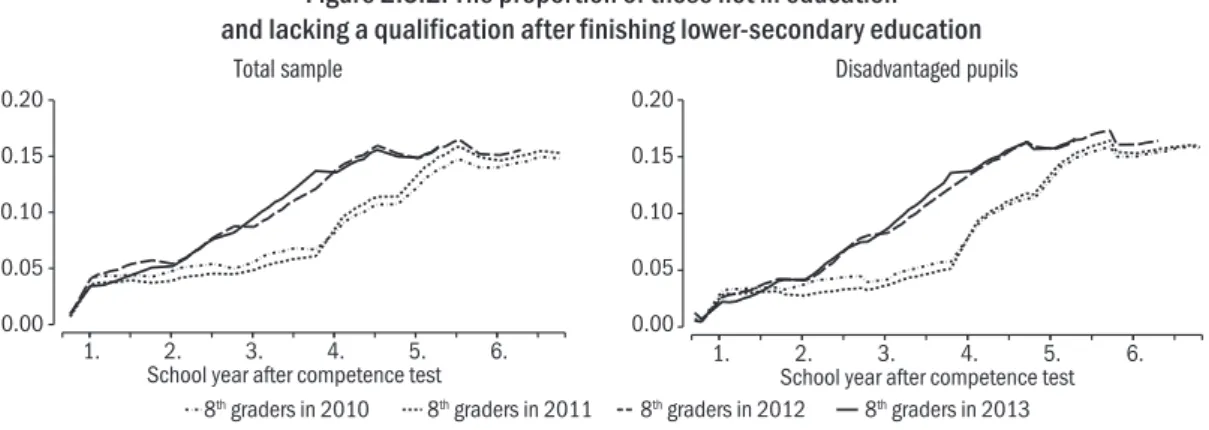
Figure 2.5.2 presents a monthly breakdown of the proportion of young people not in education and lacking a qualification, over the years after completing lower-secondary education, for two cohorts of lower-secondary pupils affect- ed by the reforms of the school-leaving age and two cohorts not affected by the reforms. The starting date is the date of the competence test taken by 8th graders in May and the first months of subsequent school years are indicated on the horizontal axis. The left-hand Figure presents proportions in the total sample. It shows that approximately 4 per cent of pupils do not attend school in September following the competence assessment, and then the difference between the cohorts affected and not affected by the reform starts to grow.
While before the reform the proportion of pupils not in education increases very slowly until the end of the third school year, a faster increase is observed from the beginning of the second school year after the school-leaving age is lowered to 16. At the end of the third school year, when the majority of pupils are aged 17–18, the share of those not enrolled in education is nearly twice as high after the reform than before it, the difference is 5–7 percentage points.
2 This sub-sample includes pu- pils whose mother or father has a lower-secondary qualification at most or they have fewer than 50 books in the household or they are officially classified as severely disadvantaged. Pu- pils defined as disadvantaged according to the above defini- tion account for 30 per cent of the total sample.
1. 2. 3. 4. 5. 6.
School year after competence test 0.00
0.05 0.10 0.15 0.20
0.00 0.05 0.10 0.15 0.20
1. 2. 3. 4. 5. 6.
School year after competence test
8th graders in 2010 8th graders in 2011 8th graders in 2012 8th graders in 2013
0.0 0.1 0.2 0.3 0.4 0.5 0.6
5th school year after Grade 8 4th school year after Grade 8
0.0 0.2 0.4 0.6 0.8
5th school year after Grade 8 4th school year after Grade 8
8th graders in 2010 8th graders in 2011 8th graders in 2012 8th graders in 2013
However, the difference starts to decrease in the fourth and fifth school years and by 5–6 years after finishing lower-secondary education the proportion of young people not in education and lacking a qualification is equally about 15 per cent both in the cohorts before and after the reform.
Figure 2.5.2: The proportion of those not in education and lacking a qualification after finishing lower-secondary education
Total sample Disadvantaged pupils
Note: The ordinal number of the school year signifies the month September.
The right-hand Figure shows the same pattern in the subsample of disadvan- taged pupils. The trends observed are essentially identical to those in the to- tal sample. The share of young people not attending school is much higher in this group: by the fifth school year it is over 30 per cent.
Figure 2.5.3 presents the share of pupils at the end of the fourth and fifth school year who have already obtained an upper-secondary qualification. In the first cohort affected by the school-leaving age of 16, the proportion of those who obtained a qualification is similar to that of the preceding years.
In the cohort of 2013, there is a slight decrease at the end of the fourth year in the total sample; however, that cohort was also affected by the vocational education and training reform (see Subchapter 2.4) – in the case of this co- hort data about the end of the fifth year is not observed in the dataset.
Figure 2.5.3: The proportion of those with an upper-secondary qualification 4 and 5 years after completing lower-secondary education
Total sample Disadvantaged pupils
On the whole, this suggests that lowering the school-leaving age resulted in considerably lower participation rates but it possibly did not have a major im- pact on obtaining an upper-secondary qualification and on the “ultimate” early school leaving rate, which is only observed after the completion of school educa- tion. In other words, apparently, dropping out following the reform primarily increased because it occurred earlier than in the cohorts preceding the reforms.
Table 2.5.1 uses probit regression models to assess the differences seen in Figures 2.5.2 and 2.5.3. Each column of the table contains estimates, at a given date, for the difference between the last cohort before the reform and the first cohort after the reform in the probability of not attending school and lack- ing an upper-secondary qualification, controlling for the effect of observed individual characteristics such as gender, age at the end of Grade 8, family background (educational attainment of parents, severe disadvantage) and pupil performance in Grade 8 (NABC test results, mathematics grade). The
“Reform” variable denotes the cohort in Grade 8 in 2012, while the reference category is the 2011 cohort. In the case of “not attending school”, the third month of the school year is considered, because in the sixth school year this is the latest date the 2012 cohort can still be observed. As for obtaining a quali- fication, the last month of the school year is taken into account.
The estimates confirm the above description. The proportion of those not attending school increased in the third and fourth school year the most fol- lowing the reform both in the total sample and among disadvantaged pu- pils, then the difference had disappeared by the sixth school year. The share of those acquiring a qualification did not decrease: the estimates even show an increase of 1–2 percentage points after controlling for individual factors.
The above analysis compared data from cohorts preceding and following the reform. The results may be interpreted as to show the impact of the reform but they are not conclusive. To what extent is this the impact of the school-leaving age? We can get closer to answering this question if taking into account that even in classes completing lower-secondary education in 2012 or later not all students were affected by the reform at each date. Pupils younger than 16 were not affected but those aged 16–17 were. Cohorts aged over 18 were in- directly affected, since some of them had already dropped out as a result of the reform. If the differences between the cohorts indicate the impact of the changes in the school-leaving age, it must be apparent in the 16–18 age group.
Figure 2.5.4 shows the proportions of young people not attending school and lacking a qualification broken down by age. It is evident that in the cohorts not affected by the reform the proportion of those not attending school starts to grow after age 18, while after the reform it increases in the 16-year-old age group and continues to grow until age 19. By that time, most of the difference between the cohorts disappear. As all cohorts of 8th graders consist of pupils of different age, the database containing data up to the end of 2017 does not
0.00 0.05 0.10 0.15 0.20
16 17 18 19
Age
8th graders in 2010 8th graders in 2011 8th graders in 2012 8th graders in 2013 0.0
0.1 0.2 0.3 0.4
16 17 18 19
Age
allow the cohorts affected by the reform to be followed beyond age 19. Nev- ertheless, Figure 2.5.4 reveals a similar picture to Figure 2.5.2 and Table 2.5.1.
Table 2.5.1: The effect of the school-leaving age reform on the status “not attending school and lacking a qualification” and on acquiring an upper-secondary
qualification, marginal effects Not attending school and
lacking a qualification Having an upper-second- ary qualification 2th school
year 3th school
year 4th school
year 5th school
year 6th school
year 4th school
year 5th school year at the end of November
(1) (2) (3) (4) (5) (6) (7)
Total sample
Reform 0.012q*** 0.0313*** 0.0385*** 0.00466*** 0.00105 0.0196*** 0.00512**
(0.00123) (0.00138) (0.00174) (0.00181) (0.00182) (0.00333) (0.00242)
N 91 310 91 295 91 280 91 262 91 240 91 268 91 251
p-average 0.0503 0.0728 0.121 0.147 0.150 0.641 0.790
Disadvantaged pupils
Reform 0.0257*** 0.0889*** 0.0930*** 0.0215*** 0.0102 0.0236*** 0.00320 (0.00304) (0.00391) (0.00559) (0.00635) (0.00643) (0.00699) (0.00693)
N 22,114 22,109 22,110 22,103 22,096 22,106 22,101
p-average 0.0717 0.127 0.235 0.304 0.313 0.464 0.608
Note: Probit estimates.
Dependent variable: Not attending school and lacking a qualification at a given date (1–5) and having an upper-secondary qualification (6–7).
Control variables: Gender, age when taking the test in Grade 8, severe disadvantage, categories of parents’ educational attainment, categories of numeracy and literacy performance levels in the competence test in Grade 8, categories of mathematics grades at the end of Grade 7 as well as the dummy variables for missing test results, parents’ educational attainment and grades.
Standard errors are shown in parantheses.
Significant at a ***1 per cent, **5 per cent, *10 per cent level.
Figure 2.5.4: The proportion of those not attending school and lacking a qualification, by age
Total sample Disadvantaged pupils
The tendency of a gradual increase after age 18 before the reform is easily ex- plained by the fact that education was compulsory until the end of the school
year, that is somewhere between the age of 18 and 19, depending on the month of birth. After the reform, when the school-leaving age applies to the actual age of pupils, although there is a break at age 16, the proportion of those not attending school also increases gradually, suggesting that they do not drop out immediately after reaching the school-leaving age.
Table 5.2.2 uses regression models similar to those in Table 5.2.1 to assess the differences in the probability of not attending school between cohorts preceding and following the reform in age groups below 16 and 16–18. Es- timates cover the period until the middle of the second school year because this is when both age groups may be observed in significant numbers. The proportion of those not attending school did not, in fact, increase as a result of the reform among pupils below 16, while in the directly affected 16–18 age group the proportion of those not in education increased. This is consistent with the interpretation that the difference between the two cohorts is due to the impact of the raised school-leaving age.
Table 2.5.2: The impact of the school-leaving age reform on not attending school and lacking a qualification in two age groups, marginal effects
Total sample Disadvantaged pupils
1th school year 2th school year 2th school year 1th school year 2th school year 2th school year
April November February April November February
Reform × be- low age 16
0.00610*** 0.00189 0.00371 –0.00542 –0.00889 0.000234 (0.0150) (0.00253) (0.00408) (0.00363) (0.00586) (0.00920) Reform × 16–
18 age group
0.0356*** 0.0186*** 0.0276*** 0.0516*** 0.0409*** 0.0628***
(0.00299) (0.00160) (0.00155) (0.00635) (0.00385) (0.00389) Note: Probit estimates.
Dependent variables: Not attending school and lacking a qualification at a given date.
Control variables: Gender, age group, severe disadvantage, categories of parents’ edu- cational attainment, categories of numeracy and literacy performance levels in the competence test in Grade 8, categories of mathematics grades at the end of Grade 7 as well as the dummy variables for missing test results, parents’ educational attain- ment and grades.
Standard errors are shown in parantheses.
Significant at a ***1 per cent, **5 per cent, *10 per cent level.
Conclusion
The results suggest that lowering the school-leaving age increased the propor- tion of young people not attending school, particularly in the 16–18 age group.
This, however, did not seem to coincide with a substantial decrease in the proportion of pupils acquiring an upper-secondary qualification, since most of the pupils who dropped out below the age of 18 as a result of the reform would have dropped out when reaching the age of 18 if compulsory school- ing age had remained unchanged. This implies that a higher school-leaving age in itself is not sufficient to reduce early school leaving: this requires multi- ple education policy measures, with school-leaving age as one of the elements.
References
Adamecz-Völgyi, A. (2018): Increased Compulsory School Leaving Age Affects Secondary School Track Choice and Increases Dropout Rates in Vocational Training Schools. CERS-IE, BWP, 2018/1.
Cabus, S. J.–De Witte, K. (2011): Does school time mat- ter? On the impact of compulsory education age on school dropout. Economics of Education Review, Vol.
30, No. 6, pp. 1384–1398.
EC (2019): Education and Training Monitor 2019. Euro- pean Commission.
Fehérvári, A. (2015): Lemorzsolódás és a korai iskolael- hagyás trendjei. Neveléstudomány, 2015/3, pp. 31–47.
Mackey, P. E.–Duncan, T. G. (2013): Does raising the state compulsory school attendance age achieve the intended outcomes? Department of Education, Wash-
ington, DC.
Raimondi, E.–Vergolini, L. (2019): ‘Everyone in School’: The Effects of Compulsory Schooling Age on Drop-out and Completion Rates, European Jour- nal of Education, Vol. 54, No. 3, pp. 471–490.
Sebők, A. (2019): The Panel of Linked Administrative Data of CERS Databank. Budapest Working Papers on the Labour Market, BWP-2019/2.
Varga, J. (ed.) (2018): A közoktatás indikátorrendszere, 2017. Authors: Hajdu, T.–Hermann, Z.–Horn, D.–Var- ga, J., MTA KRTK KTI, Budapest, 1 February.
Wenger, J. W. (2002) Does the Dropout Age Matter? How Mandatory Schooling Laws Impact High School Com- pletion and School Choice. Public Finance & Manage- ment, Vol. 2. No. 4. pp. 507–534.
K2.5 What do 17-year-olds who don’t go to school do?
János Köllő & Anna Sebők As we have seen in subchapter 2.5, the rising trend
of the share of those in formal education was bro- ken in 2012, and participation dropped to the level of ten years before by 2016.
What do 17-year-olds who don’t go to school do?
It is shown in the two panels of Figure K2.5.1. The proportion of those in employment within the age group can be seen in the left panel, distinguishing (starting with May 2000) market-based employ- ment from total employment that includes public works. It can be seen that employment rates do start to increase in parallel to the decrease of participa- tion in education; it rose from a rate of just above zero to a rate of 1.5–2%, or 2–2.5%, including pub- lic works. However, this could not offset the de- crease in educational participation: as it is shown in the right panel, the share of seventeen-year-olds not in education, employment, or training rose to a rate of 5–6 percent, from a rate of 3 percent observed before the lowering of the school leaving age.1
The rise in the share of passive 17-year-olds (NEETs) is a worrying development since the un- employment risk of this group is very high and stays so into adulthood, as early school leavers typically
do not proceed with education at later ages either.2 The average NEET rate of five percent cannot be deemed negligible, especially since it hides signifi- cant regional differences (see subchapter 6.2). The problem is not only that 17-year-olds who do not go to school do not acquire vocational or secondary school qualifications (significant numbers did not acquire them even when the school leaving age was 18 years), but the so-called “incapacitation effect”
as well, that is, the fact that youth spend their time at school. See the works of Machin et al (2011) and Adamecz–Scharle (2018) on the preventive effects of this with regard to criminal activity and teen- age pregnancy.
1 There is hardly any difference between the shares of the genders.
2 Also according to the data of the labour force survey, an average of less than six percent of seventeen-year- olds not in education, employment, or training par- ticipated in non-formal training between 2011–2018.
(The rate was calculated for a longer period because of the low number of cases.) This is approximately 0.3 percent of the entire cohort, which does not influence the proportions shown in the figure significantly.