4 LABOUR SHORTAGE AND VOCATIONAL EDUCATION 4.1 VOCATIONAL TRAINING
János Köllő
The first plans concerning the restructuring of vocational education and train- ing and higher education had emerged several years before complaints of short- age intensified. These plans – regardless of the reasons for which they were developed – however, were entirely in accordance with the criticism of edu- cation voiced by the Chamber of Commerce and Industry and other entre- preneurial forums concerning severe skilled worker shortage and also with their recommendations on increasing the importance of vocational training.
Before starting to analyse the diagnosis and therapy developed by the Cham- ber and the Ministry, it is worth discussing three important but probably less well-known facts.1
Vocational training losing importance?
Contrary to popular belief, secondary vocational education and training did not lose significance following the political changeover of the 90s, only its structure altered. Uncertified vocational training (VET) receded to the same extent as vocational secondary education (combined with a Matura and re- ferred to as VSS henceforth) expanded.2 As a result of the two trends the pro- portion of young people in an age-group entering the labour market with a vo- cational qualification has been roughly stable over the past twenty years. The proportion of young people with VET qualification dropped from 35–36 per cent to 32–33 per cent, while the share of those passing a vocational qualifica- tion in VSS (and some of them entering higher education and obtaining a de- gree) was higher in 2013 (nearly fifty per cent) than at any time since 1985, the start of the surveys of the study Hajdu et al (2015).
VET graduates in the labour market: who are they?
In the past twenty-five years, the occupational composition of VET graduates has changed considerably. A significant proportion of them already worked as unskilled or semi-skilled workers twenty years ago: according to the 1996 Wage Survey, 27 per cent of them worked as assemblers, machine operators or in elementary occupations. However, this had increased to 46 per cent by 2016 (including public works participants) in the entire economy and 52 per cent (excluding public works participants) at companies with more than one hundred employees, according to the Wage Survey.
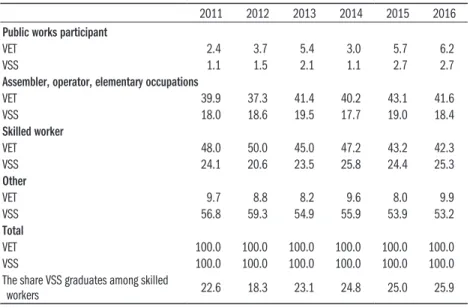
Table 4.1.1 presents the recent developments of the trend in detail. The proportion of VET graduates working in public works schemes – primarily
1 The chapter relies strongly on Hajdu et al (2015).
2 The two main school types are referred to by their better- known names: vocational school (szakiskola) and upper-second- ary vocational school (szak- középiskola). However, officially the former has been renamed as upper-secondary vocational school (szakközépiskola) and the latter as specialised upper- secondary general school or specialised gymnasium.
unskilled work – increased from 2.4 per cent to 6.2 per cent between 2011 and 2016. The share of those working in the primary labour market in el- ementary occupations, as assemblers or machine operators also rose slightly, while the share of those employed as skilled workers decreased from 48–50 per cent to 42–43 per cent. 8–10 per cent of these worked as technicians or in a clerical, office job during the whole period reviewed. Overall, the ma- jority of graduates from VET are at present employed as unskilled or semi- skilled workers.
Table 4.1.1: The occupational composition of graduates from VET and VSS in 2011–2016, percentage
2011 2012 2013 2014 2015 2016
Public works participant
VET 2.4 3.7 5.4 3.0 5.7 6.2
VSS 1.1 1.5 2.1 1.1 2.7 2.7
Assembler, operator, elementary occupations
VET 39.9 37.3 41.4 40.2 43.1 41.6
VSS 18.0 18.6 19.5 17.7 19.0 18.4
Skilled worker
VET 48.0 50.0 45.0 47.2 43.2 42.3
VSS 24.1 20.6 23.5 25.8 24.4 25.3
Other
VET 9.7 8.8 8.2 9.6 8.0 9.9
VSS 56.8 59.3 54.9 55.9 53.9 53.2
Total
VET 100.0 100.0 100.0 100.0 100.0 100.0
VSS 100.0 100.0 100.0 100.0 100.0 100.0
The share VSS graduates among skilled
workers 22.6 18.3 23.1 24.8 25.0 25.9
Source: Wage Surveys.
The figures are much better in the case of VSS graduates: the proportion of those participating in public works schemes is still very low and the propor- tion of those working as assemblers, operators and unskilled workers did not increase either. The share of those in skilled worker positions slightly increased, while the share of those in white collar jobs slightly decreased. As the final row of the table shows, the share of those with a Matura among skilled work- ers has reached 25–26 per cent in recent years.
The market value of a vocational qualification with or without a Matura
Even though employers state they primarily need vocational graduates who underwent practical training and were not burdened with the task of prepar- ing for a Matura, they do not value such employees even in manual occupa- tions as much as VSS graduates.
As Table 4.1.2 indicates, as a result of the continuously increasing minimum wage, the wage advantage of all more educated groups decreased in 2011–2016 compared to those completing 0–8 grades. However, what is more significant for our analysis is the difference between the two major groups participating in manual skilled work.
Table 4.1.2: The wage advantage of VSS graduates in various occupational groups compared to those with a lower secondary qualification at most
(0–8 grades) in 2011–2016 (percentage)
Qualification and occupation 2011 2012 2013 2014 2015 2016
Operators, assemblers and elementary occupations
VET 9.2 5.7 7.9 7.3 4.4 4.9
VSS 25.6 21.1 18.0 17.8 18.5 17.6
Skilled work
VET 12.2 9.2 11.8 13.3 10.9 10.6
VSS 25.1 24.6 23.2 20.7 20.9 21.7
Technicians, clerks, office jobs
VET 39.2 32.9 36.1 30.9 35.1 37.9
VSS 61.4 50.5 52.2 46.6 55.5 50.9
Upper-secondary general school graduates 49.3 41.9 40.0 36.5 40.6 40.2 Higher education graduates 174.8 151.2 152.3 143.8 157.1 147.6 The figures show the wage advantage of those with various qualifications working in
various occupational groups compared to those with a lower-secondary qualifica- tion at most (grades 0–8) in the primary labour market as a percentage. Wage ad- vantages were calculated by regression models, controlled for gender, labour market experience, industries and sectors (private versus public sector), not including public works schemes, as a percentage, thus if the difference in logarithm is b, the figure in the table eb. All estimated parameters are significant at a 0.01 level, and the t-values are two or three digit figures.
Source: Wage Surveys.
The wage advantage of VSS graduates in elementary occupations was 16 per- centage points over VET graduates in 2011 and was 12 percentage points at the end of the period; their wage advantage in skilled labour did not change much over the period (13 and 11 percentage points respectively) and decreased significantly only in white-collar occupations, from 21 to 13 percentage points.
We did not include public works schemes in the comparison, since wages are not set by the market in that sector.
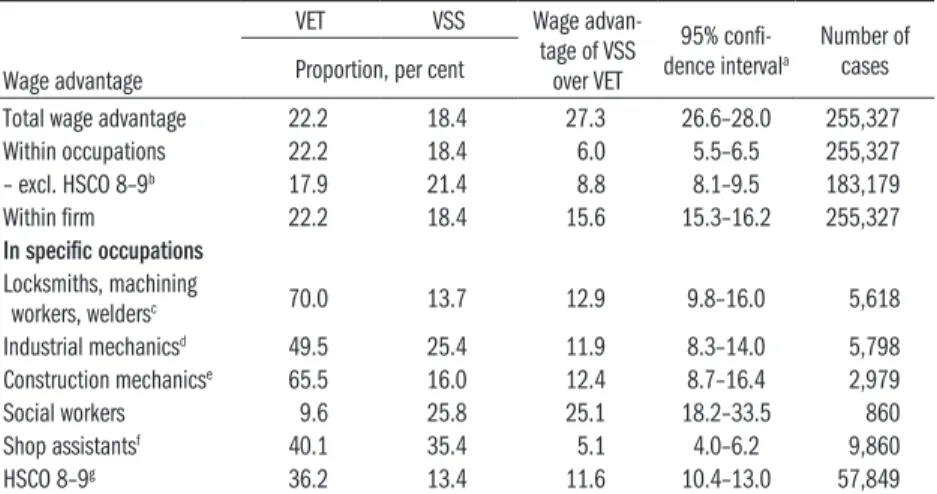
The differences at the end of the period are presented in more detail in Table 4.1.3. Overall, VSS graduates earned 27–28 per cent more than VET graduates in 2016. It was partly due to their more favourable occupational composition. When controlling for occupations (four-digit HSCO cate- gories), there is still a roughly 6 per cent wage advantage, and when focus- ing on skilled work, the advantage is 8–10 per cent. When looking at the difference between those working at the same employer, the wage advan- tage is 15–16 per cent, partly because upper-secondary vocational school
graduates are more likely to be recruited or promoted to better paid jobs at individual firms.3
Table 4.1.3: The proportions of vocational school and upper-secondary vocational school graduates and the wage advantage of the latter over the former in 2016 Wage advantage
VET VSS Wage advan-
tage of VSS over VET
95% confi-
dence intervala Number of cases Proportion, per cent
Total wage advantage 22.2 18.4 27.3 26.6–28.0 255,327
Within occupations 22.2 18.4 6.0 5.5–6.5 255,327
– excl. HSCO 8–9b 17.9 21.4 8.8 8.1–9.5 183,179
Within firm 22.2 18.4 15.6 15.3–16.2 255,327
In specific occupations Locksmiths, machining
workers, weldersc 70.0 13.7 12.9 9.8–16.0 5,618
Industrial mechanicsd 49.5 25.4 11.9 8.3–14.0 5,798
Construction mechanicse 65.5 16.0 12.4 8.7–16.4 2,979
Social workers 9.6 25.8 25.1 18.2–33.5 860
Shop assistantsf 40.1 35.4 5.1 4.0–6.2 9,860
HSCO 8–9g 36.2 13.4 11.6 10.4–13.0 57,849
a We can claim, with a less than 5% risk of error, that the wage advantage falls within these limits.
b HSCO 8–9: Assembler, machine operator, other elementary occupations.
c Locksmiths, machining workers, welders: locksmiths 50%, machining workers 22%, welders 18%, other 10%.
d Industrial mechanics: motor vehicle mechanics 54%, electrical mechanics 19%, ma- chinery repairmen 10%, other 17%.
e Construction mechanics: electrician 41%, plumbers and gas fitters 35%, other 24%.
f Shop assistants: shop assistant 81%, cashier 12%, other 7%.
g Assembler or operator 50%, in elementary occupations 50%. Excluding public works participants.
Methods: the wage advantage was estimated by regression equations, which con- tained the following control variables: gender, labour market experience and its square as well as dummy variables standing for four-digit HSCO codes and an- onymised employer codes when calculating within-occupation and within-firm wage advantages. The difference in percentage is eb if the estimated logarithmic difference is b.
Source: Wage Survey, 2016.
When observing the most popular blue-collar occupations, it is conspicuous that upper-secondary vocational school graduates are employed in this seg- ment at the same rate as their proportion in the total workforce. Their wage advantage as locksmiths, machining workers, welders as well as industrial and construction mechanics is 12–13 per cent, as social workers it is 25 per cent and even as shop assistants it is 4–6 per cent. Their wage advantage is also sig- nificant, 10–13 per cent, when working as unskilled or semi-skilled workers.
The wage advantage strongly depends on age. VET graduates entering the labour market earn somewhat more than VSS graduates of the same age but they already have a substantial wage disadvantage at the age of 25. This is
3 The confidence intervals are presented because the number of cases is low due to the break- down to occupations.
80 90 100 110
Percentage
20 30 40 50 60
Age
not a new phenomenon and does not indicate the (allegedly) improving mar- ket perception of VET graduates: similar curves are presented by Hajdu et al (2015) for other years following the political changeover.
The wage disadvantage of vocational school graduates increases by age, which indicates the lack of transferability of skills acquired in vocational schools:
because of competences improving adaptability, the Matura loses its market value at a slower pace than a vocational school certificate (Figure 4.1.1).
Figure 4.1.1: The wage of VET graduates compared to the wage of VSS graduates by single years of age in 2016
Source: Wage Survey, 2016. The smooth curve is estimated with non-linear (lowess) regression.
That the fast depreciation of the VET certificate is due to the low levels of cognitive skills is confirmed by not conclusive but important direct evidence from the ALL Survey (Adult Literacy and Lifeskills Survey), in which Hun- gary participated in 2008.4
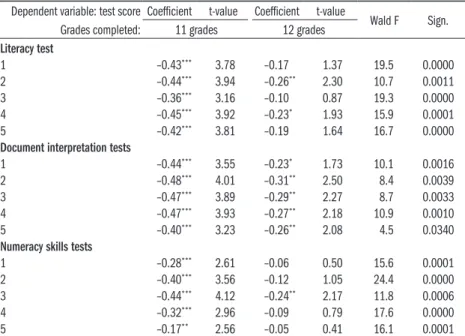
Table 4.1.4 presents how the reading, literacy, document interpretation and simple numeracy skills assessed by ALL tests change by age among Hun- garian manual workers who accomplished 11 or 12 grades. (The survey does not identify the VET qualification but typically workers with 11 completed grades have graduated from there, while those who completed 12 grades and employed as manual workers typically graduated from a VSS). The coefficients show by how many points the test results decreased, on a 0–500 scale, if the respondent is one year older.
The assessed basic skills deteriorate by age in both groups but the rate of deterioration is much greater among workers with a VET certificate. Among the former, test scores are typically 0.4–0.5 points lower when respondents are a year older, while among the VSS graduates, all but one effect are below 0.3, half of them are below 0.2 and half of the cases are not even significant at a 10 per cent level, and none of them is significant at a 1 per cent level. The
4 The evidence would be con-The evidence would be con- clusive only if instead of a cross- sectional study, we were able to follow the changes in the skills of persons with differing quali- fications for 30–40 years.
statistical tests presented in the last and the last but one column disaffirm the identity of the slope of the age-score curves in all cases.5
Table 4.1.4: Changes in ALL test scores according to age among manual workers who completed 11 or 12 grades
Dependent variable: test score Coefficient t-value Coefficient t-value
Wald F Sign.
Grades completed: 11 grades 12 grades Literacy test
1 –0.43*** 3.78 –0.17 1.37 19.5 0.0000
2 –0.44*** 3.94 –0.26** 2.30 10.7 0.0011
3 –0.36*** 3.16 –0.10 0.87 19.3 0.0000
4 –0.45*** 3.92 –0.23* 1.93 15.9 0.0001
5 –0.42*** 3.81 –0.19 1.64 16.7 0.0000
Document interpretation tests
1 –0.44*** 3.55 –0.23* 1.73 10.1 0.0016
2 –0.48*** 4.01 –0.31** 2.50 8.4 0.0039
3 –0.47*** 3.89 –0.29** 2.27 8.7 0.0033
4 –0.47*** 3.93 –0.27** 2.18 10.9 0.0010
5 –0.40*** 3.23 –0.26** 2.08 4.5 0.0340
Numeracy skills tests
1 –0.28*** 2.61 –0.06 0.50 15.6 0.0001
2 –0.40*** 3.56 –0.12 1.05 24.4 0.0000
3 –0.44*** 4.12 –0.24** 2.17 11.8 0.0006
4 –0.32*** 2.96 –0.09 0.79 17.6 0.0000
5 –0.17** 2.56 –0.05 0.41 16.1 0.0001
Note: Adult Literacy and Lifeskills Survey (ALL, 2008), Hungarian subsample, 1206 persons.
Source: Author’s calculation using the microdata of the Hungarian subsample of the ALL survey.
The left-side of the equations contained the score of one of the tests, while the right side contained the interactions of age and educational attainment level (11 or 12 grades). The coefficients show by how many points the test results decreased, on a 0–500 scale, at a given educational attainment level if the respondent is one year older. The sample includes persons who com- pleted 11 or 12 grades and were working as manual workers at the time of the survey (their ISCO1 HSCO1 code was higher than 4). The standard errors, used for the t-values were estimated using the 30 replication weights included in the survey and the jackknife method. The Wald test measures at what significance level the coefficients of the two groups may be consid- ered different.
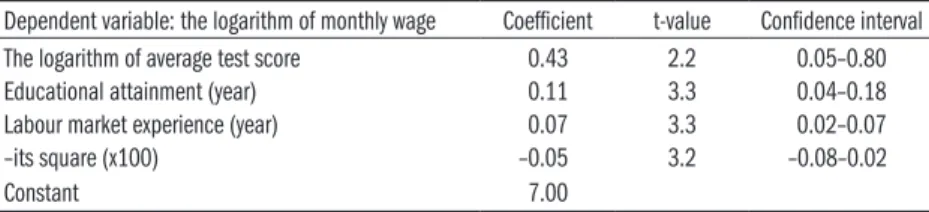
Only part of the sample lends itself for analysing how the measured cogni- tive skills are valued by the market, because data on wage is only available for half of the respondents of the Hungarian sample of ALL.6 According to the regression on available data (Table 4.1.5), the higher score was associated with higher wages, even when controlling for education attainment and age: the
5 For more details on the ALL survey, see OECD and Statistics Canada (2005, 2011), Statistics Canada (2011), Köllő (2014).
6 Data on wage is lacking more often in the case of men but its availability is independent of age and educational attainment level.
elasticity of wage to the test score is positive, with the the point estimate be- ing 0.43 (although the confidence interval is rather wide: 0.05–0.8).
Table 4.1.5: The impact of the average score achieved in ALL on monthly wages among Hungarian workers who completed 9–12 grades
Dependent variable: the logarithm of monthly wage Coefficient t-value Confidence interval
The logarithm of average test score 0.43 2.2 0.05–0.80
Educational attainment (year) 0.11 3.3 0.04–0.18
Labour market experience (year) 0.07 3.3 0.02–0.07
–its square (x100) –0.05 3.2 –0.08–0.02
Constant 7.00
Note: The number of cases is 619 and the fit of the function is 0.045. The sample in- cludes persons who completed 11 or 12 grades and were working as manual workers at the time of the survey (their ISCO1 HSCO1 code was higher than 4). The stand- ard errors, used for the t-values were estimated using the 30 replication weights in- cluded in the survey and the jackknife method. Confidence interval: we can claim, with a less than 5% risk of error, that the coefficient falls within these limits.
Source: Author’s calculation using the microdata of the Hungarian subsample of the ALL.
On the reforms of vocational education
The above findings call into question whether Hungarian companies have a considerable excess demand for VET graduates in order to fill skilled worker jobs. At present, half of vocational school graduates are employed as unskilled or semi-skilled workers. Wage levels do not indicate that firms would value VET graduates more than VSS graduates in any occupations. On the contrary, the latter are better paid even in traditional skilled manual occupa- tions (machining worker, locksmith, welder, mechanic) by 12–13 percentage points, and nor was the situation affected by the slight increase in the rela- tive wages of skilled workers with a vocational school certificate after 2011.
This applies to the workforce trained in the current system and to the cur- rent standards of vocational training, and apparently the corporate sector does not believe in securing better employees from this supply by raising wages.
The scepticism towards the average quality of vocational school graduates of the current system is highly justified. VET schools perform worse than VSS and upper-secondary general schools in developing the most important basic skills of pupils, even when controlling for test scores achieved in lower-sec- ondary education and for social background. In the case of pupils with average skills, in the standard deviation of the test scores in grade 8 (–0,5, +0,5), VET schools contribute one-third of standard deviation less to the mathematics and literacy skills of pupils than VSS schools (Hajdu et al, 2015). Grade repeti- tion and dropping out is widespread (Kertesi–Kézdi, 2010; Fehérvári, 2015).
Based on the findings, the most important question about “skilled worker shortage” is whether the current reforms to secondary vocational education
and training provide a solution to the rapid skills obsolescence of vocational school graduates and whether the individual (and society in general) loses the value provided by this school type. As the above tables suggest, this would primarily require appropriate resilience and learning skills, which are based on the basic skills necessary for learning.
How do reforms implemented in secondary vocational education after 2010 serve this purpose? These reforms included changes in the student propor- tions between VET and VSS to the advantage of the former; the shortening of VET, curtailing general education within VET; relaxing the requirements to be met by VET teachers; placing VETs under the control of the Ministry for National Economy and reducing the compulsory school age – in line with the vision that the Hungarian economy needs less general education and more
“skilled workers fit for fighting” and that the education system should be bet- ter adapted to “labour market demand”.
Hungarian reforms are modelled on the “German-style” dual VET, which is also characteristic of the Nordic countries. However, pupils enter these sys- tems with considerably more general education and their graduates are much less restricted to the world of skilled manual labour than in Hungary.
In Germany, vocational school pupils start training for their occupation after 7,155 or 7,950 hours of general education (depending on the Länder), while in Hungary they start it after 5,742 hours (Hajdu et al, 2015). For a better il- lustration of scale, in terms of the length of general education it is as if Hun- garian VET pupils attended basic (primary and lower-secondary) school for ten or eleven years instead of eight years, or after VET they attended a twelfth general upper-secondary grade and one or two more grades in college or uni- versity. Following the reduction in the number of general education lessons in VET, Hungarian pupils have had less of this education when entering the labour market, than German pupils had before starting VET (Varga, 2017).7
In Denmark, another country regarded as a role model, the three-grade, practical vocational training, with a strong participation of enterprises, is based on a 9-grade basic school and often another, preparatory, grade be- tween the two. Due to this and the quality of education, there was an enor- mous difference between Hungarian and Danish vocational school graduates already before the radical reduction of general education in Hungary. The Danish graduates of apprenticeship education and training are markedly bet- ter at writing, reading and counting and perform complex work in a much higher proportion – the more intensive adult education and training also plays a role in this. Two-thirds of them speak English, while this figure is less than one per cent for the Hungarians. The Danish vocational training is far from aiming solely at producing “skilled workers fit for fighting”: near- ly forty per cent of vocational school graduates work as technicians, clerks, office workers, low- or mid-level managers or entrepreneurs. In Hungary,
7 Varga (2017) found that fol- lowing the reforms, the total number of general education lessons of Hungarian vocational school pupils after the comple- tion of the school is still 737 or 1,532 lessons lower than the number of general education lessons German pupils had be- fore entering VET.
the proportion of the upwardly mobile is only 10 per cent (see Hajdu et al, 2015 and Table 4.1.1).
Vocational training reforms will probably increase the supply of vocational school graduates in the short run, trained to the current standards, without forcing enterprises to raise wages but in-depth curricular reforms, updating the skills of teachers and renewing the teaching staff will require a longer time.
Even if this takes place, the length of vocational training will decrease and the average standards of quality are likely to decline, especially regarding the de- velopment of skills needed for adaptation, over a lengthy transitional period.
This study does not aim at determining whether the price paid for fulfilling the current demand of employers (half of which is for skilled, the other half of which is for unskilled and semi-skilled workers) is too high. Nevertheless, it is safe to assume that there is such a price, which is paid by those concerned and also by society indirectly through deteriorating employability, lower wag- es and a faster obsolescence of skills acquired in education over a shorter or longer period.
References
Fehérvári Anikó (2015): Lemorzsolódás és a korai iskolaelhagyás trendjei. (Trends in dropping out and early school leaving), Neveléstudomány, 2015. Vol.
3. pp. 31–47.
Hajdu Tamás–Hermann Zoltán–Horn Dániel–
Kertesi Gábor–Kézdi Gábor–Köllő János–Var- ga Júlia (2015): Az érettségi védelmében. (In defence
of the Matura). BWP 2015/1.
Kertesi Gábor–Kézdi Gábor (2010): Iskolázatlan szülők gyermekei és roma fiatalok a középiskolákban.
(The children of uneducated parents and Roma youth at upper-secondary school). In: Kolosi Tamás–Tóth István György (eds.) Társadalmi Riport 2010. TÁR- KI, Budapest.
Köllő János (2014): Integrációs minták: iskolázatlan emberek és munkahelyeik Norvégiában, Olaszország- ban és Magyarországon (Patterns of integration: un- educated persons and their jobs in Norway, Italy and
Hungary). In: Kolosi Tamás–Tóth István György (eds.) Társadalmi riport, TÁRKI, Budapest, pp. 226–245.
OECD and Statistics Canada (2005): Learning a living:
First results of the Adult Literacy and Life Skills Sur- vey’. Statistics Canada and OECD, Montreal and Paris.
OECD and Statistics Canada (2011): Literacy for life:
Further results from the Adult Literacy and Life Skills Survey – Second International ALL Report. Statistics Canada and OECD. Montreal, Paris.
Statistics Canada (2011): The Adult Literacy and Life Skills Survey, 2003 and 2008. Public use microdata file user’s manual. Statistics Canada, Montreal. Avail- able on request.
Varga Júlia (2017): A közoktatás problémáinak gazdasá- gi okairól és következményeiről. (On the economic reasons and consequences of the problems of educa- tion) Presentation at the educational forum of Stádi- um 28. 27 February 2017.