1
Improving Living Conditions, Deepening Class Divisions: Hungarian Class Structure in International Comparison, 2002–2018
Ákos Huszár, Katalin Füzér
This is the accepted manuscript version of the article published in East European Politics and Societies (EEPS).
Cite as:
Ákos Huszár and Katalin Füzér (2021) “Improving Living Conditions, Deepening Class Divisions: Hungarian Class Structure in International Comparison, 2002–2018” East European Politics and Societies and Cultures, pp. 1–24. First Published December 2, 2021.
https://doi.org/10.1177/08883254211060872
Abstract
This article investigates the changing relationship of class and the living conditions of individuals in Hungary in comparison with other European countries. Our central question is to what extent class position determines the material living conditions of individuals in Hungary, how this relationship has changed, and how significant it is compared to other European countries. Our analysis is a direct test of the death-of-class thesis in one of the core fields of class analysis. Our results show that there has been a rapid and large-scale restructuring of Hungarian society after 2010, with two notable tendencies. The first is an overall improvement of material living conditions at all levels of the class structure, the other is the gradual solidification and polarisation of class structure.
Keywords: Hungary; middle class; social class; social stratification; poverty; unemployment
2 The main question of our study is to what extent class position determines the material living conditions of individuals in Hungary, how this relationship has changed in recent times and how significant it is compared to other European countries. Our results contribute to the extensive debate on the role and significance of social class by putting Hungary in the focus of analysis. After locating our approach in the debate on social class, we will present two central problems in the transformation of the Hungarian social structure before concluding with the detailed results of our research and a reflection on the potential implications for class theory in general.
Comments on the Concept of Class
Class is one of the most controversial concepts in the social sciences. This is especially true in the study of post-socialist societies where the ruling state-socialist elites claimed that their power emanated from the working classes, defined according to the class categories of Marxist- Leninist ideology, which in turn also classified their enemies. As a result, it is not surprising that after the collapse of the state-socialist regimes, the concept of class was discredited and almost completely disappeared both from public discourse and from among the categories of social science analysis.1 Paradoxically, this happened amidst the post-socialist transition when the institutions of the market economy were established, state property was privatised and a new capitalist class gradually emerged.
In recent decades, the relevance of class has been questioned not only in post-socialist societies. Observations on the individualisation and esthetization of inequalities and the general fading away of structural cleavages in society led to the notion that class had lost most of its significance or was downright dead, and the very applicability of the concept for describing structural relations in Western societies was questioned.2
Although the concept of class is highly controversial—given the historical materialist connotations regarding class formation and the historical role attached to the working class by
3 Marx and Marxist scholars3—strong arguments continue to speak for its relevance. According to the neo-Weberian tradition, class is a significant factor of social life if it meaningfully contributes to the explanation of social phenomena such as material inequalities or political behaviour.4 In this theoretical context, we can talk about a class society if class position has a strong explanatory power in several realms of social life: in other words, if we can predict on the basis of people’s class position whether they are poor or rich, sick or healthy, sad or happy and how they will vote in elections. Furthermore, in a class society, we can also predict whom they are likely marry and what social position their children can achieve. In such a society, advantages and disadvantages are distributed and reproduced primarily along the lines of social classes. Members of certain classes secure privileged positions while other classes tend to accumulate disadvantages.
Several recent studies have empirically verified that class position still has a strong impact on various fields of life in a variety of countries.5 In their recent work, Geoffrey Evans and James Tilley present a complex account of the transformation of the British class structure since the early 1950s.6 According to their results, while more than half of the British population counted as working class in the 1950s, their proportion has significantly decreased so that the majority of society is now composed of various middle-class groups. A parallel change ensued with the transformation of British politics: political parties turned away from the working class and tended more toward the middle classes, while public discourse came to rely less and less on the concept of class at all. Against the background of these transformations, however, the authors also point out that rather than diminishing, inequalities among the classes actually increased in certain areas. During the broad time period under their review, class cleavages persisted with respect to the level of education, financial circumstances, health and socio- political attitudes of the various class positions. Therefore, the relevance of class has not changed one bit since the 1950s.
4 Our study follows the neo-Weberian tradition of class analysis and investigates the relationship of class and material living conditions in Hungary. This area is of central importance to class analysis, because of its claim to provide explanations primarily for inequalities in material living conditions and life chances.7 As John Goldthorpe and Abigail McKnight argue,8 it is in economic life where the implications of class should be immediately apparent. They assume that class position not only influences the level of earnings, but also economic security through the associated risk of unemployment. They also assume that class is expected to influence economic stability through the possible short-term fluctuation of earnings, as well as the long-term economic prospects of individuals. According to their findings the preliminary assumptions were confirmed: class is a good predictor of these dimensions in the case of British society.
In our study we propose a similar question and ask: to what extent are material living conditions of individuals in Hungary predictable on the basis of social class? How has this relationship changed over time, and how significant is it compared to other European countries?
Does class matter when it comes to explaining material living conditions? If the explanatory power of class shows a weak or decreasing tendency it supports the theses of the death of class.
However, if the opposite is true it indicates the increasing relevance of class.
Relatively little immediate evidence is available on this issue in the context of recent social change in Hungary. On the one hand it is well underpinned that the life chances of individuals are strongly influenced by their class position.9 Comparative social mobility research also suggests that the association between the class position of parents and their children has been strengthened10 and an increasing proportion of individuals are choosing a partner with the same social position.11 On the other hand, Kolosi and his colleagues have more directly comparable results. They examined how social class explains income and consumption patterns between 1995 and 2005 and how it is related to material status and consumption patterns over a longer
5 period, from 1982 to 2009.12 While Kolosi and his co-author are more cautious in the first article, they later draw the more definitive conclusion that the Hungarian class structure has gradually crystallised and class position determines the income and consumption patterns to an increasing extent. These results suggest that the role of class has not diminished in the past decades in Hungary, on the contrary, its relevance has become more pronounced.
In what follows, we pursue a line of inquiry that is shaped by Goldthorpe and McKnight and is similar to the approach of Kolosi and his co-authors. Has Hungarian class society crystallised further in a more extended time frame as well as in international comparison? By posing this question we will thus examine the role of class in a field that is central for class analysis and where the stakes are therefore especially high. In fact, our analysis can be regarded as a direct test of the death-of-class thesis in one of its core fields. If class analysis were to prove unable to contribute relevant explanations in the very arena where it claims prime competence, this would amount to admitting its own irrelevance.
Class and Living Conditions in Hungary
In Hungary an analysis of material living conditions by class brings up special questions.
Hungary belongs to those Eastern European countries which began to build capitalism without capitalists in the 1990s after the collapse of the state-socialist regime.13 The transition was in many respects a real success: the institutions of parliamentary democracy and the market economy were set up and began to operate in stability, defying pessimistic expectations. There is agreement in the literature on the relevant structural processes and constraints in the period between 1990 and 2010: a neoliberal consensus guarded the globalisation and Europeanisation processes of these two decades which constituted the framework for post-socialist transformation as well. Scholars use a variety of terms but denote essentially the same basic features of Hungarian economy and society in the 1990s and 2000s when they talk about
6 embedded neoliberal capitalism, a liberal competition state or a liberal model with neopatrimonial elements to characterise the post-socialist regime prior to 2010.14
There is less consensus in the literature about the nature of transformation of Hungarian society in the period after 2010. One segment of the scholarship emphasizes corruption and the collapse of liberal institutions,15 whereas others put the emphasis elsewhere and argue that the post-2010 area constitutes a more comprehensive transformation. Those who cast their net wider argue that an accumulative state, a hybrid authoritarian state capitalism, or a neoprebendal model of post-socialist capitalism emerged in Hungary in the last decade.16 This more comprehensive position also implies a direct impact on material living conditions in general as well as on class divisions in particular. The Hungarian accumulative state contributes to the sharpening of class inequalities on the one hand by accelerating the capital accumulation and embourgeoisement of the (upper)middle classes while on the other hand by implementing neoliberal social reforms in the areas of tax policy, labour policy and the broader system of social protection.17
This second position therefore suggests a much more radical transformation of Hungarian society, which can best be assessed by joining to two research areas.
On the one hand, central to the analyses of the changing social structure of Hungarian society after 1990 was research on middle-class formation. In this discourse, the middle class appeared as a normative ideal, with its members possessing respectable incomes, wealth, good education and actively participating in public affairs. Most commentators at the time assumed that a strong and wide middle class was the basis and guarantee of a stable and democratic society, prevented the emergence of extreme inequalities and acted as a constant check on political power. These predictions were also at the heart of public expectations regarding the future of the new regime after the collapse of state-socialism.
7 Thus far, however, these scenarios proved to be illusory. According to the latest research, the Hungarian middle class is narrow and weak from a material point of view. At most one third of the population’s living standard can be regarded as middle class,18 and the boundaries of that group appear to have become more and more closed.19 On the other hand, it seems that the middle class is unable to fulfil the political role attributed to it. The Hungarian middle and upper middle class retreats from public matters into family and private life; instead of meeting the challenges of market competition, it relies on support from the state; and instead of building solidarity among social groups, it contributes to mechanisms of exclusion.20
However, if the new theoretical assumptions on the radical change of Hungarian society are correct, these would imply the significant strengthening (and maybe also the widening) of the Hungarian middle class. Our study can test this hypothesis as far as it concerns the material aspects of the middle class.
On the other hand, our study also directly contributes to the research on unemployment and poverty. There are competing explanations for these phenomena, which imply diverse policy responses.21 Individualistic explanations attempt to describe disadvantageous social position as a function of individual attributes such as behaviour, habits, competencies, potentially even biological or psychological features. Such accounts typically attribute the cause of poverty to factors such as laziness, lack of proper work attitudes and an irresponsible, licentious lifestyle.
Structural explanations, in contrast, reject the view that individual attributes sufficiently account for the rate of unemployment or poverty in any society. Structural factors—such as economic development and inequality in the distribution of socially important goods—are responsible for how widespread these phenomena are and how likely it is that individuals at various positions in the social structure end up being poor. The role of individual attributes can only be assessed against the background of these structural factors.
8 By assessing the changing strength of the explanatory power of class in relation to indicators of unemployment and poverty, the following analysis may help us to determine the role of structural factors in the development of these phenomena. In contemporary Hungary, such an analysis is all the more timely, as individualistic explanations of poverty are especially prevalent in everyday discourse as well as in the social policy arena. This discourse divides those in need into two groups: the deserving and the undeserving poor, denying help to the latter and directing assistance to the former. This trend applies to various fields of public policy, from employment and social policy to pensions and family assistance, as well as to social benefits and the local distribution of public resources.22
However, if the theoretical assumptions on the class character of Hungarian society are correct this would imply that being poor depends less and less on the individual characteristics of the members of society and more and more on their class position. Our study is able to contribute to the testing of this hypothesis to the extent that is assesses how the explanatory power of class has changed.
Thus, in addition to our broad theoretical question, we also looking for answers to two specific questions that are connected to the impact of the transformation since 2010. On the one hand have broad segments of the (upper) middle class benefited disproportionally in the wake of the comprehensive changes as it is supposed? And on the other hand to what extent does class explain poverty, or in more general terms the material living conditions of individuals in Hungary? How has this relationship changed over time and how significant it is compared to other European countries?
Data and Methods
Our analysis is based on waves one to nine of the European Social Survey (ESS), conducted biannually between 2002 and 2018 in several European countries. The database allows us to
9 situate the changes that have taken place in Hungarian society in the last almost twenty years in an international context.23
Our study measures the class position of members of society in the tradition of occupational class analysis, i.e. on the basis of the individual’s occupation and other labour market characteristics. Evidently, several other options are available for operationalising social class.
Thomas Piketty draws conclusions for the long-term transformation of social structure by analysing income and wealth distribution.24 Robert D. Putnam, on the other hand, relies chiefly on education data to underpin his broad thesis that mobility chances of children in the US have come to depend decreasingly on race and increasingly on social class over the past 50 years.25 There are also multi-dimensional approaches that mobilise several types of resources to construct social classes.26 Our occupation-based approach is warranted, first of all, by the comparative nature of our research questions. More specifically, in our study we will use the European Socio-economic Classification (ESeC) that counts today as one of the most important tools for international comparative research.27 As the sample size of ESS allows for the analysis only of rough distinctions, we used a simpler version of ESeC that contains five occupational groups.28
In the present paper we examine the changes in the effects of class on material living conditions that was analysed previously by John Goldthorpe and Abigail McKnight through the dimensions of economic security, economic stability and economic prospects.29 Of these dimensions we can study here two, with minor constraints. Goldthorpe and McKnight examined economic security with the help of the indicator of incidence of unemployment that is available in the ESS as well. The survey item we analyse tells us whether a respondent had been unemployed within the last five years and had looked for a job. Economic stability and economic prospect was examined by Goldthorpe and McKinght through the composition of income and through its distribution by age cohorts. Thus, these dimensions could be examined
10 on the basis of detailed income data that is not available in ESS. ESS provides only a variable on the income decile of respondents, but its quality is—at least in the case of Hungary—
problematic.30 In our study, therefore the assessment of income position relies on a subjective indicator instead. In this survey item, respondents provide information about their households’
ability to make ends meet: whether it is difficult, very difficult, easy or very easy for them to cover household expenses. In our analysis, we merged those who reported any difficulty into one category, and those who reported none into another. Thus, in our study we use two indicators: incidence of unemployment stands for economic security, while we use a subjective assessment to estimate the income position of individuals. If class explains the incidence of unemployment or income difficulties to a declining extent, it supports the theses on the death of class. However, if the opposite trend is observed, it indicates the increasing relevance of class.
In our work we distinguished three time periods. This solution, on the one hand allows us to work with larger samples and thus achieve more robust results. On the other hand, the periodization follows well the main economic and political changes in Hungary the first period embraces the first half of the 2000s (2002–2006), the second extends over the period of the global economic crisis (2008–2012), while the third covers the years of economic conjuncture that followed the crisis period (2014–2018). For this third period, the main social policy measures of the new government also came into force.
In what follows we explore, first how unemployment and income difficulties affected the various occupational classes in the different periods, i.e. to what extent these material disadvantages were present at different levels of the class structure in the past almost two decades. Secondly, in order to assess the changing role of class in relation to economic disadvantages we have also produced binary logistic regression estimates for all periods and for all countries that participated in ESS. Two types of regression parameters are especially
11 important for us. Firstly, the average marginal effects attributed to occupational classes: this tells us about the risk of unemployment and income difficulties along the various levels of the social hierarchy. Secondly, it is important to evaluate the overall explanatory power of our regression models as this allows us to conclude whether the significance of class has decreased—confirming the thesis on the death of class—or, on the contrary, it has increased.
We will first analyse the role of class position in experiencing unemployment, and then turn to assessing the connection between class position and income difficulties.
Incidence of Unemployment
The unemployment rate is obviously the prime factor in shaping the proportion of people in a society who have experienced unemployment. The 1990s, the first post-socialist decade, brought about massive job losses in Hungary. At that time, the rate of unemployment was 12%, but this steadily improved until the early 2000s, when it stood as low as 5–6%. Already a few years before the global economic crisis, the unemployment rate began to rise again, and in the years between 2009 and 2012 it reached the level experienced during the very first years of the transformation. In the post-economic crisis era, however, the unemployment rate began to fall again and reached a record low level. What is more, this happened parallel to a decline in the rate of economic inactivity and a similarly unprecedented rise in the rate of employment.31
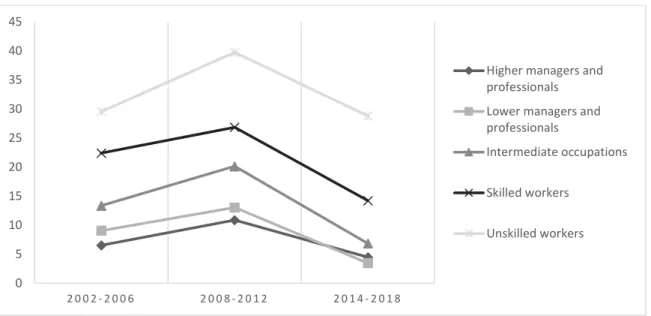
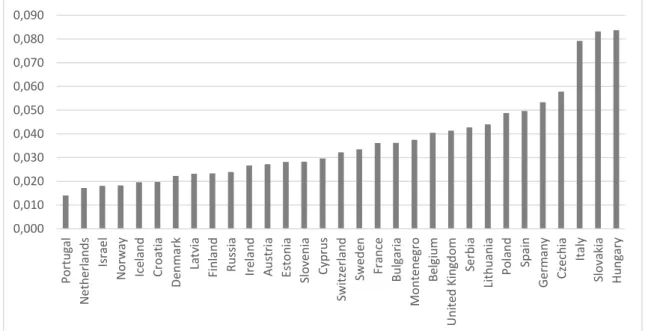
The indicator used in our analysis reflects these trends (cf. Figure 1. and 2.). The proportion of people who experienced unemployment peaked during the crisis and then rapidly decreased in the post-crisis period. In addition, the Hungarian results in the third period are quite favourable compared to the countries included in our analysis. On the basis of our data, we can also demonstrate that the problem of unemployment affected the various positions of the class structure differently. While the rate was under 10% for higher managers and highly educated professionals during most of the time under review, among unskilled workers the figure was around 30% during the first and the third period, and affected 40% of the occupational group
12 during the crisis. It should also be noted that in the post-crisis era, there has been improvement on all levels of the class structure with respect to the problem of unemployment. The greatest positive changes could, in fact, be observed in the lower-class positions: between the second and the third period there was a drop of at least 10 percentage points in the rate of incidence of unemployment among unskilled and skilled workers, as well as among those in intermediate occupations.
--- Insert Figure 1 and 2 about here ---
These results indicate that the level of unemployment significantly changed between 2002 and 2018. In what follows, we present regression analyses to estimate the contribution of class to the explanation of this phenomenon in the three periods. Specifically, we aim to answer two questions: can we predict with the same certainty in the three time periods the incidence of unemployment based on their class position? And how significant is the role of class in Hungary vis-à-vis other ESS countries? We analysed the role of class in the three periods via independent logistic regression estimates using identical parameters. On the one hand, we present McFadden pseudo R2 statistics, i.e. the explained proportion of the total heterogeneity, while also including average marginal effects attached to each class position.32 As class position can correlate with other factors in various ways in the different time periods, we applied a two-stage strategy. The explanatory variables of our first models (M1) rely only on socio-demographic attributes (gender, age, size of household, type of residence), while the second stage includes class position as well (M2).33 In terms of average marginal effects, the second model is of interest for our analysis as it indicates the chance of unemployment attached to class positions while
13 controlling for socio-demographic factors. The central question for us, however, is to what extent the explanatory power of the model increases when we include class position, i.e. how strong the independent role of class is (M2-M1). Table 1. presents the chief results of our regression analyses.34
--- Insert Table 1 and Figure 3 about here ---
Evaluating first the Pseudo R2 statistics, we can see that the explanatory power of our full models steadily increased over the course of our timeframe. The increase in the explanatory power of M2 can be attributed to the variable of occupational class in both periods. Irrespective of how the proportion of those with experience of unemployment changed, the measures indicate that the explanatory power of class constantly increased. These results confirm the conclusions drawn by Kolosi and his co-authors for the 2000s on the solidification of class structure35 and at the same time underline the increasing relevance of class in the 2010s as it is suggested.36 This increase in the Pseudo R2 statistics for Hungary suggest that the class position of individuals predicts with strengthening explanatory power the risk of unemployment. These figures in and of themselves, however, can not demonstrate how significant the role of class is.
Such significance can be more convincingly demonstrated by putting our research results for Hungary into a comparative framework (cf. Figure 3). This perspective allows us to see that the increasing relevance of class is not exceptional in Hungary. Similar trends can be observed in almost half of the ESS countries. On the other hand, we can also note that figures for Hungary were consistently among the highest in all periods. In the last period, Pseudo R2 statistics for
14 Hungary were absolutely the highest and far surpassed those of other countries (with the exception of Slovakia and Italy).
On the basis of the analysis of average marginal effects, we can also draw conclusions on where the changes of the explanatory power of class position originate. Our results capture two significant trends. On the one hand, there is a process of homogenisation in the upper part of the class structure with respect to the risk of unemployment: while the average marginal effects for the top occupational categories hardly changed in the observed time frame, the situation of those in intermediate occupations improved consistently, especially in the third period.
Tendencies are similar for skilled workers whose average marginal effects also decreased. The other important trend is the inverse of this homogenisation process: the falling behind of unskilled workers. The increasing cleavage between unskilled workers and all other occupational groups means that the problem of unemployment is increasingly concentrated among poorly educated workers who make up more than the fifth of Hungarian society.
To check the robustness of our results on the changing role of class in explaining the incidence of unemployment we applied alternative calculations (cf. Table A3 in the appendix).
For the Hungarian case we calculated regression estimates that included time period as an independent variable and the interaction term of period and class as well. These regression models can inform us in an alternative way whether the relationship of the different occupational classes have changed over time with respect to the experience of unemployment.
The main result of these calculations is that the interaction term of period and class is significant showing that the role of class has changed over time. According to the odds ratios there is no significant change from the first period to the second, but in the third period the relationship of class and the incidence of unemployment is altered. In the post-crisis period all occupational classes, except for higher managers and professionals, have lower chance to experience unemployment compared to unskilled workers, a finding that corroborates our previous results.
15 Financial Difficulties
Unlike for unemployment, we do not have any exact or time-series data for a comprehensive analysis of financial difficulties. Indicators of poverty, especially absolute poverty, can be invoked to approximate the problem. Since 2005, we have comparative statistics on this for Hungary in a European context. According to the two chief indicators, material deprivation and at risk of poverty or social exclusion (developed to monitor the EU2020 strategy) poverty slowly decreased in the mid-2000s, a trend that reversed during the global economic crisis and reached its peak in 2013. The post-crisis area was marked by a new trend of rapid improvement in most European countries. The most extensive improvement could be observed in the countries with the highest level of poverty, e.g. in Romania, Bulgaria, Hungary and Estonia.37
Our results based on ESS data on financial difficulties reflect the same trends (cf. Figure 4. and 5.): the proportion of those experiencing financial difficulties increased in the crisis period and fell to a large extent in the second half of 2010s. However, in spite of this considerable improvement, Hungary still counts as a poor country in the European context.
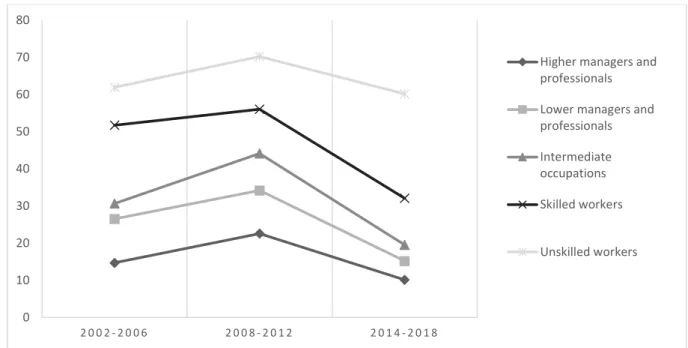
Similarly to our results on unemployment, the various class positions provide divergent life conditions for their members. The global economic crisis and the ensuing period of economic growth had a deep impact in Hungary on the (self-reported) financial position of various occupational classes. In the crisis period almost three quarters of unskilled workers and three fifths of skilled workers reported financial difficulties, and this was even the case for one fourth of those in the upper classes. The data for the next period indicate thoroughgoing changes.
Although the overall rate of those experiencing financial difficulties was still high by European standards, and three-fifth of the unskilled workers were still indigent, the figures nonetheless indicate that material living conditions for all occupational classes were the most advantageous in this most recent period.
16 ---
Insert Figure 4 and 5 about here ---
If we conceptualise the threshold of middle-class membership with the two basic aspects of material security (a job with an income that provides for basic needs),38 the post-economic crisis era is exceptional in the wider context of Hungary’s post-socialist social transformation from the perspective of middle-class formation. In no previous time period did indicators of poverty improve so much which means that for many people, a road to middle class status opened up—
or at least the possibility of securing a lower middle-class standard of living. These conclusions are also supported by research on subjective social position and mobility. In the 2010s, a greater number of respondents placed themselves on the middle or upper scales of the social ladder than at any other time since 1990. While at the end of the first and the second decades of the post-socialist transformation the vast majority of Hungarians perceived their social position to be worse than their parents’, by the mid-2010s the majority reported that their social position had improved vis-à-vis that of their parents.39
Much like our descriptive results on income difficulties in various class positions, our regression analyses also corroborate the presence of a large-scale social transformation. The explanatory power of class position (the Pseudo R2 statistics in Table 2) grew a little from the first period to the second, but then increased sharply after the global economic crisis. These results indicate that the significance of class strengthened, both in terms of unemployment and with respect to financial difficulties. What is more, similarly to our results on unemployment, in the case of financial difficulties too, figures for Hungary are comparatively outstanding in an ESS context (cf. Figure 6). This also implies that in explaining poverty, greater emphasis should be placed on structural factors such as class.
17 ---
Insert Table 2 and Figure 6 about here ---
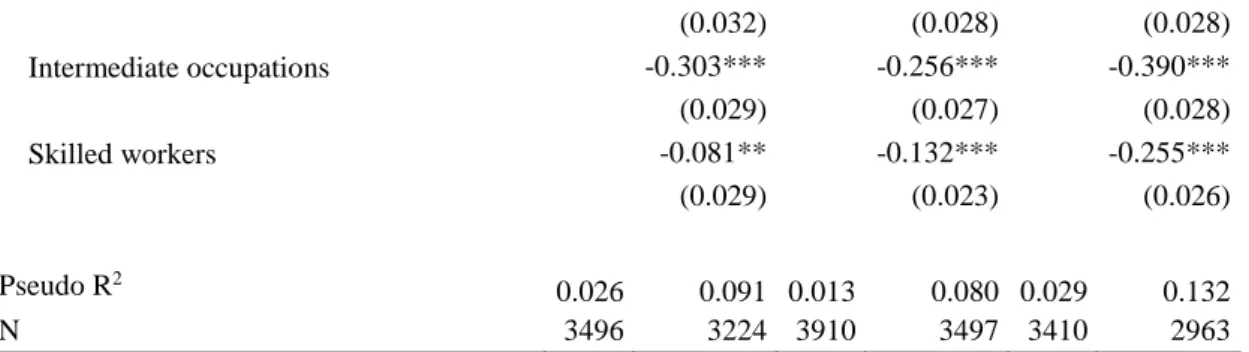
Changes in the average marginal effects (cf. Table 2) indicate processes similar to those that we identified in the case of unemployment. Here, too, a triple structuration of society is detectable: homogenisation of the upper classes with respect to financial difficulties and the clear detachment of the positions of skilled and unskilled workers. The decisive process in the case of this indicator is again the falling behind of unskilled workers.
In the case of income difficulties we also conducted regression analyses with alternative parameters that contained the interaction term of class and period to check the robustness of our results (cf. Table A4 in the appendix). These investigations confirm our previous calculations.
No significant difference can be found between the first two periods, but in the third one the role of class has changed in explaining income difficulties. These results also show that in the second half of 2010s, all occupational classes, except for higher managers and professionals, have less chance to have financial difficulties compared to unskilled workers.
Conclusions
In recent decades not only has the empirical relevance of the concept of class been questioned, but it has become discredited and worn out from the dictionary of social sciences in the post- socialist countries of Eastern Europe. Paradoxically all this came about, when these states began to build capitalism after the collapse of state-socialism. In our study by examining the relationship between class and material living conditions we sought to answer the question of what role class played in the stratification of Hungarian society and how has it has changed in the last decades. Is class really dead or, on the contrary, its significance is growing?
18 Our findings confirm earlier research results presented by Tamás Kolosi and his co-authors for the first two decades of post-socialist transformation.40 We too find that in the course of the transformation the explanatory power of class gradually increases and the class structure becomes polarised. After 2010, however, two significant tendencies are apparent that shows the rapid and large-scale restructuring of Hungarian society. The first is an overall improvement of material living conditions at all levels of the class structure. The other is the extreme polarisation of the class structure, a process that started before 2010, but has gained new momentum in recent years. Thus, as a result of these two processes a definite improvement of living conditions can be observed in Hungary, but the distribution of advantages and disadvantages is increasingly shaped by class.
On the one hand, poverty and social exclusion were on the rise in the period of the global economic crisis, but this trend reversed in the second half of the 2010s. In Hungary, similarly to many other European countries, the post-crisis period brought about a decline in the share of people who experienced unemployment or financial difficulties. This trend was detected at all levels of the class structure and the last period registered the best results for each and every occupational class during the whole of the observed time period, i.e. since 2002. These data also reveal that in the second half of the 2010s, the rate of people affected by any form of poverty was lower than at any other point during the almost three decades of post-socialist transformation. This has made it possible for large groups of society to free themselves from daily livelihood struggles and enter the middle class, or at least its lower segment. The growing Hungarian middle class is still weak by European standards, but for many people, the recent progress has implied that their social position improved or that they were able to take one step forward. It is a question, however, to what extent and for how long the Covid-19 crises stopped and reversed this process?
19 On the other hand, the increasing significance of class persisted and in effect extremely strengthened in the second half of the 2010s. In that period, it was more likely than it has been at the beginning of the 2000s to predict whether someone is poor or has experienced unemployment on the basis of their class position. What is more, the explanatory power of class for Hungary stands out in a European context. In contemporary Hungary, whether people have a job or are unemployed, whether they find it easy or difficult to make ends meet depends increasingly on their background and social position. These findings indicate that, as it was suggested,41 the social policy of the accumulative state combined with the polarising effect of market forces produced a concentration of advantages and disadvantages that is unprecedented both in the context of Hungarian post-socialist transformation as well as in European comparison.
Returning to the central question of our paper: contrary to the death of class thesis the role of class has increased in Hungary in the recent period, and based on our international comparative results, it may seem surprising how much. However, as the present analysis examined the role of class only in one field, further research is to show the exact significance of class on other areas of social life beyond material living conditions.
20 Tables and figures
Figure 1. The percentage of those who were unemployed during the last five years and looked for a job by class in Hungary, 18–64 year-olds, %
Figure 2. The percentage of those who were unemployed during the last five years and looked for a job in the ESS countries, 18–64 years old, 2014–2018, %
Table 1. Logistic regression models on the incidence of unemployment in Hungary (average marginal effects)
2002–2006 2008–2012 2014–2018
M1 M2 M1 M2 M1 M2
0 5 10 15 20 25 30 35 40 45
2 0 0 2 - 2 0 0 6 2 0 0 8 - 2 0 1 2 2 0 1 4 - 2 0 1 8
Higher managers and professionals Lower managers and professionals
Intermediate occupations
Skilled workers
Unskilled workers
10 11 12 12 13 13 14 14 14 14 15 15 16 17 18 18 18 18 18 19 19 19 20 20
23 24 25 25
29 31 31
0 5 10 15 20 25 30 35
Iceland Norway Slovakia Switzerland Hungary Sweden Austria United Kingdom Germany Czechia Netherlands Belgium Cyprus Slovenia Russia Estonia Denmark Ireland Poland Lithuania Israel Bulgaria Croatia Finland France Italy Latvia Portugal Montenegro Spain Serbia
21
Control variables Yes Yes Yes Yes Yes Yes
Occupational Class (ref.: Unskilled workers)
Higher managers and professionals -0.231*** -0.270*** -0.225***
(0.028) (0.025) (0.023)
Lower managers and professionals -0.205*** -0.246*** -0.234***
(0.025) (0.024) (0.022)
Intermediate occupations -0.164*** -0.176*** -0.204***
(0.024) (0.025) (0.023)
Skilled workers -0.090*** -0.123*** -0.132***
(0.025) (0.022) (0.022)
Pseudo R2 0.026 0.080 0.020 0.083 0.021 0.105
N 3507 3228 3937 3519 3494 3020
Note: The dependent variable of the models: 0- was not unemployed, 1- was unemployed. M1 denotes the first model, containing only socio-demographic explanatory variables (gender, age, household size and settlement type), and M2 denotes the second which also contains the variable of occupational class.
Significance levels: * p <0.05, ** p <0.01, *** p <0.001
Figure 3. The explanatory power of logistic regression models on the incidence of unemployment in the ESS countries, 2014–2018, (M2 Pseudo R2 – M1 Pseudo R2)
Note: The dependent variable of the models: 0- was not unemployed, 1- was unemployed. M1 denotes the first model, containing only socio-demographic explanatory variables, and M2 denotes the second, which also contains the variable of occupational class. M2-M1 represents the difference in explanatory power between the two models, that is, how much the explanatory power is increased by the occupational class variable.
Figure 4. The percentage of those reporting income difficulties by class in Hungary, 18–64 years old, %
0,000 0,010 0,020 0,030 0,040 0,050 0,060 0,070 0,080 0,090
Portugal Netherlands Israel Norway Iceland Croatia Denmark Latvia Finland Russia Ireland Austria Estonia Slovenia Cyprus Switzerland Sweden France Bulgaria Montenegro Belgium United Kingdom Serbia Lithuania Poland Spain Germany Czechia Italy Slovakia Hungary
22 Figure 5. The percentage of those reporting income difficulties in the ESS countries, 18–64 years old, 2014–2018, %
Table 2. Logistic regression models on income difficulties in Hungary (average marginal effects)
2002–2006 2008–2012 2014–2018
M1 M2 M1 M2 M1 M2
Control variables Yes Yes Yes Yes Yes Yes
Occupational Class (ref.: Unskilled workers)
Higher managers and professionals -0.450*** -0.459*** -0.470***
(0.035) (0.030) (0.028)
Lower managers and professionals -0.336*** -0.358*** -0.428***
0 10 20 30 40 50 60 70 80
2 0 0 2 - 2 0 0 6 2 0 0 8 - 2 0 1 2 2 0 1 4 - 2 0 1 8
Higher managers and professionals Lower managers and professionals Intermediate occupations Skilled workers
Unskilled workers
8 8 8 11 12 12 13 13 13 14 15 16
20 20 21 23 23 25 25 25 26 26 27 27 30 31 33 34 40
51 63
0 10 20 30 40 50 60 70
Denmark Sweden Norway Iceland Netherlands Switzerland Germany Slovenia Croatia Austria Finland United Kingdom Poland Belgium Ireland France Estonia Spain Slovakia Lithuania Montenegro Czechia Serbia Portugal Italy Latvia Hungary Israel Cyprus Russia Bulgaria
23
(0.032) (0.028) (0.028)
Intermediate occupations -0.303*** -0.256*** -0.390***
(0.029) (0.027) (0.028)
Skilled workers -0.081** -0.132*** -0.255***
(0.029) (0.023) (0.026)
Pseudo R2 0.026 0.091 0.013 0.080 0.029 0.132
N 3496 3224 3910 3497 3410 2963
Note: The dependent variable of the models: 0- living comfortably or coping on current income, 1- finding it very difficult or difficult on current income. M1 denotes the first model, containing only socio- demographic explanatory variables (gender, age, household size and settlement type), and M2 denotes the second which also contains the variable of occupational class. Significance levels: * p <0.05, ** p
<0.01, *** p <0.001.
Figure 6. The explanatory power of logistic regression models on income difficulties in the ESS countries, 2014–2018, (M2 Pseudo R2 – M1 Pseudo R2)
Note: The dependent variable of the models: 0- living comfortably or coping on current income, 1- finding it very difficult or difficult on current income. M1 denotes the first model, containing only socio- demographic explanatory variables, and M2 denotes the second, which also contains the variable of occupational class. M2-M1 represents the difference in explanatory power between the two models, that is, how much the explanatory power is increased by the occupational class variable
0,000 0,020 0,040 0,060 0,080 0,100 0,120
Denmark Iceland Montenegro Russia Serbia Finland Israel Latvia Norway Ireland Belgium Croatia France Sweden Netherlands Bulgaria United Kingdom Slovakia Czechia Poland Germany Austria Estonia Lithuania Slovenia Switzerland Portugal Spain Italy Cyprus Hungary
24 Appendix
I. Occupational class structure in Hungary and in the ESS countries
Our analysis is based on the European Socio-economic Classification (ESeC), which follows John Goldthorpe’s ideas on class structure.42 ESeC has been widely tested and counts today as one of the most important tools for international comparative research.43
In creating the class scheme for our analysis, we directly relied on the program written by Eric Harrison and David Rose for waves one to five of the ESS, based on the three-digit codes of the ISCO88 occupational nomenclature. In 2012, i.e. in the sixth wave, ESS started to use ISCO08 so we used the new program adapted by Eric Harrison to the new occupational codes.44
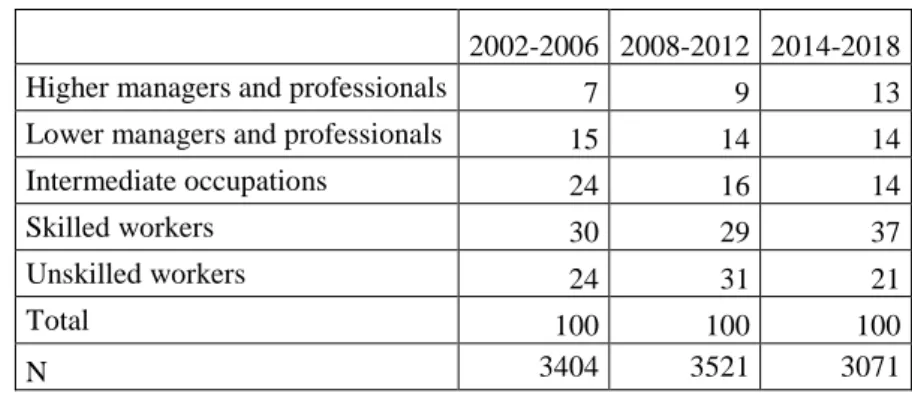
As the sample size of the ESS allows only for a rough analysis of class structure, we developed a five-category version of the original nine ESeC class categories developed by Harrison and Rose. Although the robustness of our results do not reach the level of analyses based on population censuses it is consistent with recent large-scale surveys (cf. Table A.1).45 Our results based on the ESS also highlight the special features of the Hungarian occupational structure: even in comparison to the other Visegrád countries (Poland, the Czech Republic and Slovakia, the proportion of upper managerial and professional occupations is smaller, whereas the share of working-class positions is greater (cf. Table A.2).
Table A1. Changes in the occupational structure in Hungary, 18–64 years old, %
2002-2006 2008-2012 2014-2018
Higher managers and professionals 7 9 13
Lower managers and professionals 15 14 14
Intermediate occupations 24 16 14
Skilled workers 30 29 37
Unskilled workers 24 31 21
Total 100 100 100
N 3404 3521 3071
Table A2. The occupational structure in ESS countries, 18–64 years old, 2014–2018, %
25
Higher managers
and professionals
Lower managers
and professionals
Intermediate occupations
Skilled workers
Unskilled
workers Total N
Austria 20 15 20 34 12 100 4528
Belgium 19 24 19 22 16 100 3555
Bulgaria 13 12 10 42 23 100 1346
Switzerland 28 20 20 25 7 100 3297
Cyprus 17 17 22 32 12 100 516
Czech Republic 18 15 17 35 14 100 4794
Germany 19 20 26 24 11 100 5681
Denmark 23 18 19 29 12 100 1047
Estonia 21 18 17 30 14 100 4244
Spain 17 16 20 31 16 100 3855
Finland 20 17 17 34 12 100 3914
France 18 19 24 24 15 100 4043
United Kingdom 20 21 19 27 12 100 4546
Croatia 10 12 23 34 21 100 1158
Hungary 13 14 14 37 21 100 3071
Ireland 21 17 22 29 12 100 5189
Israel 19 18 23 30 11 100 3563
Iceland 25 22 23 25 6 100 697
Italy 16 14 23 30 18 100 2971
Lithuania 14 13 11 42 20 100 4155
Latvia 16 16 20 29 18 100 672
Montenegro 19 16 23 26 16 100 703
Netherlands 23 21 27 20 10 100 3848
Norway 26 22 18 27 7 100 3084
Poland 17 18 12 40 14 100 3386
Portugal 14 14 22 31 19 100 2374
Serbia 15 12 21 31 21 100 1296
Russia 10 12 15 43 20 100 1612
Sweden 22 21 21 28 8 100 3386
Slovenia 18 19 24 25 15 100 2559
Slovakia 24 15 14 32 14 100 730
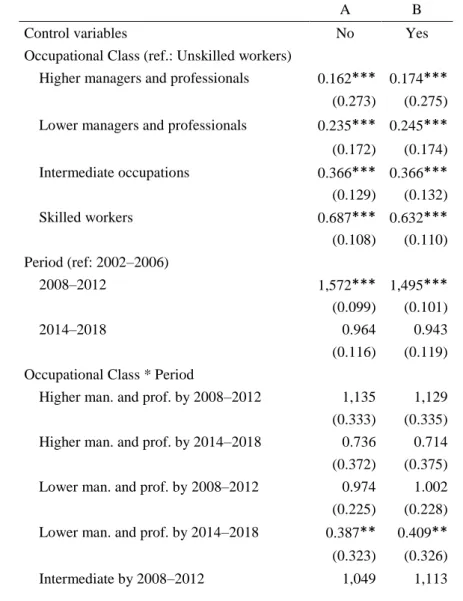
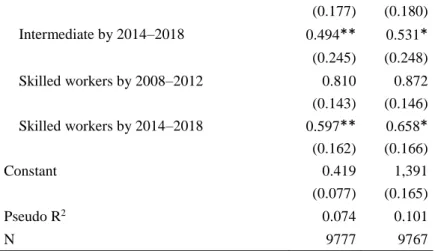
26 II. Regression models with interaction terms: robustness check
To check the robustness of our results on the changing role of class in explaining the incidence of unemployment and income difficulties we applied alternative calculations. For the Hungarian case we calculated regression estimates that included time period as an independent variable and the interaction term of period and class as well. These regression models can inform us in an alternative way whether the relationship of the different occupational classes have changed over time with respect to the experience of unemployment and income difficulties.
Table A3. Logistic regression models on the incidence of unemployment in Hungary, 2002–
2018.
A B
Control variables No Yes
Occupational Class (ref.: Unskilled workers)
Higher managers and professionals 0.162*** 0.174***
(0.273) (0.275) Lower managers and professionals 0.235*** 0.245***
(0.172) (0.174) Intermediate occupations 0.366*** 0.366***
(0.129) (0.132)
Skilled workers 0.687*** 0.632***
(0.108) (0.110) Period (ref: 2002–2006)
2008–2012 1,572*** 1,495***
(0.099) (0.101)
2014–2018 0.964 0.943
(0.116) (0.119) Occupational Class * Period
Higher man. and prof. by 2008–2012 1,135 1,129 (0.333) (0.335) Higher man. and prof. by 2014–2018 0.736 0.714 (0.372) (0.375) Lower man. and prof. by 2008–2012 0.974 1.002 (0.225) (0.228) Lower man. and prof. by 2014–2018 0.387** 0.409**
(0.323) (0.326)
Intermediate by 2008–2012 1,049 1,113
27 (0.177) (0.180)
Intermediate by 2014–2018 0.494** 0.531*
(0.245) (0.248)
Skilled workers by 2008–2012 0.810 0.872
(0.143) (0.146) Skilled workers by 2014–2018 0.597** 0.658*
(0.162) (0.166)
Constant 0.419 1,391
(0.077) (0.165)
Pseudo R2 0.074 0.101
N 9777 9767
Note: The dependent variable of the models: 0- was not unemployed, 1- was unemployed. The first regression model (A) examines the effect of class and period on the incidence of unemployment without control variables, while the second (B) model contains the variables of gender, age, household size and settlement type as well. Significance levels: * p <0.05, ** p <0.01, *** p <0.001. (Standard error in parentheses.)
Table A4. Logistic regression models on income difficulties in Hungary, 2002–2018.
A B
Control variables No Yes
Occupational Class (ref.: Unskilled workers)
Higher managers and professionals 0.106*** 0.118***
(0.197) (0.198) Lower managers and professionals 0.223*** 0.239***
(0.123) (0.124) Intermediate occupations 0.272*** 0.280***
(0.105) (0.107)
Skilled workers 0.659*** 0.706***
(0.096) (0.097) Period (ref: 2002–2006)
2008–2012 1,449*** 1,459***
(0.098) (0.099)
2014–2018 0.931 0.929
(0.108) (0.110) Occupational Class * Period
Higher man. and prof. by 2008–2012 1,170 1,125 (0.247) (0.249) Higher man. and prof. by 2014–2018 0.700 0.692 (0.271) (0.272) Lower man. and prof. by 2008–2012 0.990 0.906 (0.168) (0.170) Lower man. and prof. by 2014–2018 0.531** 0.505**
(0.200) (0.201)
Intermediate by 2008–2012 1,235 1,196