Measurement of arterial elasticity in healthy children and renal transplant patients –
Reference values of pulse wave velocity in children and young adults Theses
Orsolya Cseprekál MD
Semmelweis University School of Clinical PhD Studies
Tutor: Prof George S Reusz MD, PhD, DSc, Member of HAS Official reviewers:
Botond Csiky MD PhD László Wágner MD PhD Comprehensive exam committee
László Rosivall MD PhD DSc, Member of HAS István Kiss MD PhD med habil
László Szabó, MD PhD med habil, Member of HAS
Budapest 2011
2 Background
The main goal of the clinician should be to discover early, subclinical signs of cardiovascular (CV) diseases and to prevent the development of the overt disease and its consequences. Thus there is an increasing need to find parameters that can be measured by non- invasive methods and which have an individual predictive value to forecast early arterial damage to be able to characterize the elevated CV risk in children and youngsters.
In large adult studies hard end points are used to evaluate the magnitude of the effect of an individual risk factor or the efficacy and the value of a therapeutic intervention. Hard end points are virtually lacking in the paediatric population. Thus, it is necessary to find simple measures of intermediary end points. Aortic (central) pulse wave velocity (PWV) is a sensitive marker of arterial stiffness and cardiovascular outcome. Age and mean arterial pressure (MAP) are the major determinants of PWV in adults, but information about its determining factors in the paediatric population are lacking. It is well-known that during growth, not only aging but the changes of body size have to be taken into account. The diameter of the aorta is changing with growth, and according to Moens-Korteweg equation (PWV2=Eincxh/2xrxρ, where Einc=Young modulus, h-arterial wall thickness, 2r-diameter of the vessel lumen, ρ-blood density) it has a decisive influence on the change of arterial elasticity.
Chronic kidney disease (CKD) is an important factor influencing arterial stiffness and the progression of athero- and arteriosclerosis. Children with CKD follow a pathological growth curve as a result of growth hormone resistance, disturbed calcium phosphate metabolism, renal osteodysthrophy, altered lipid – carbohydrate and protein metabolism.
Thus we should aim to create a reference database of PWV for the further prospective clinical studies in the paediatric population and to develop the method of choice for primary and secondary prevention of CV diseases.
3
A multitude of various methods and techniques have been used to assess PWV in adults, as the most widely used applanation tonometry devices (PulsePen (PP); DiaTechne Inc. Milan, Italy) and Sphycmocor (SC), Atcor Medical, Sidney, Australia)), or computerized oscillometric methods (Vicorder (Vic); Skidmore Medical Bristol, UK).
During our work on non-invasive cardiovascular monitoring in children we have conducted three studies to find the answer to the following questions:
Aims
1. To study the role of body dimension on the arterial elasticity measured as PWV in healthy and CKD (transplanted and uremic) children; to find the basis of standardization of the method.
2. To determine universal reference values of PWV in children.
3. To compare the non-invasive methods using different devices to measure PWV.
Patients
1. Assessment of factors influencing PWV in healthy and CKD children
Transplanted patients (n=25) (age 15,1 (95% CI= 13,5-16,7) years; males 15; 46,7 (40,9-52,5) kg, 149 (142-155) cm, PWV 5,46 (5,12-5,8); were examined. The healthy control group of this part of the study was composed of 188 healthy children.
2. Reference values in children
A total of 1008 healthy normotensive children and youngsters (age 15,2 years [range 6,5 – 19,9]; 495 males) was investigated in the frame of an international cooperation.
4
3. Comparison of three devices to measure PWV in children
Healthy or hospital in-patient children and young volunteers (n=98, 39 males) were measured by three devices (PulsePen (PP), Sphygmocor (SC) and Vicorder (Vic))
Methods
1. Assessment of factors influencing PWV in healthy and CKD children
PWV was measured by applanation tonometry using PP, interfaced with a computer. The probe was connected to a hand held ECG unit. The pressure and the electrocardiographic signals were transmitted to a computer. The pulse wave was calibrated by measuring blood pressure immediately before each recording.
Aortic PWV was defined as the distance of the sampling sites divided by the time difference between the rise delay of the distal and proximal pulse according to the R wave belonging to the ECG qRs complex and is calculated by the software.
Omron M742E and Omron 705IT were used to measure blood pressure manually.
To compare the healthy children and patients with different age and body size, the following methods were used:
(a) First, age (A), height and weight (H/W) and age and height (A/H) matched controls were chosen pair wise to each individual CKD patient from the pool of 188 healthy children and compared pair wise to assess the difference of PWV.
(b) More universally height-age standard-deviation (SDS-Z) score of the 188 healthy children was assessed: six groups were created, the mean PWV values for each group was calculated and used as reference (6- <8, 8- <10, 10- <13, 13- <16, 16-
<19, and 19- <21-years) Thereafter the height age of the patients was assessed by means of standard growth charts.
Height-age was defined as the age corresponding to the 50th percentile height value identical to the patients’ height.
Standard deviation scores (PWV-Z) normalized for height-age in the patient population were calculated.
5
(c) Finally as a simple age independent variable PWV normalized to body size was examined.
2. Universal reference values for children
Age and height normalized healthy reference values of the 1008 healthy population were calculated by LMS method. Using LMS method, the distribution of a given variable can be characterized by the calculation of median (M), variation coefficients (L – ratio of standard deviation and the mean, SD/mean) and the skewness (S). Method of the calculation of normalized parameters:
Cα(t)=M(t)x[1+L(t)xS(t)x zα]1/L(t) Where M(t), L(t), and S(t) or Cα
(t) for a given age or height (t) zα – standard deviation score value of the given percentile α=50, zα=0; α=75, zα=0,674; α=90, zα=1,282; α=95, zα=1,645; α=97, zα=1,881.
3. Comparison of three devices to measure PWV in children
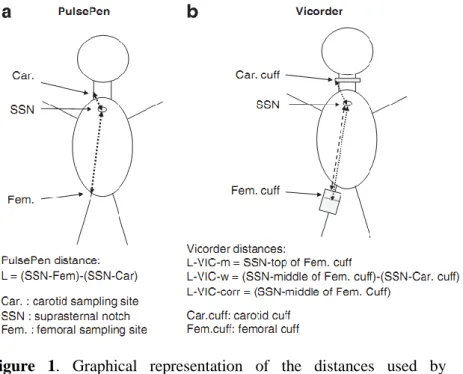
PP and SC based on the principle of applanation tonometry and Vic, an oscillometric device – were compared to each other. The principle of measurement of the PP and SC devices is similar; the measurements were performed as described above. Vic records the carotid and femoral pulse wave simultaneously by an inflatable neck and femoral cuff working on the basis of the volume displacement method. Transit time is calculated by a cross correlation algorithm centred on the peak of the second derivative of pressure wave.
Path length was defined in three ways, shown on Figure 1.
6
Figure 1. Graphical representation of the distances used by PulsePen/Sphygmocor and Vicorder
Results
1. Assessment of factors influencing PWV in healthy and CKD children
(a) Pairwise comparison of age (group A), height and weight (H/W) and height and age (H/A) matched CKD and healthy pairs The data are as follows:
group A - age 14,8 (12,9 – 16,1 ) years, weight 56,6 (50,2 – 62,9)* kg, height 163 (157 – 170 )* cm, PWV 5,14 (4,69 – 5,58) m/s, PWV Z -0,37 (-0,75 – 0,01) *, PWV/h 3,16 (2,96 – 3,35) * 1/sec), group H/W; age 14,8 (12,9 – 16,1 ) years, weight 56,6 (50,2 – 62,9)* kg, height 163 (157 – 170 )* cm, PWV 5,14 (4,69 – 5,58) m/s, PWV Z -0,37 (-0,75 – 0,01) *, PWV/h 3,16 (2,96 – 3,35) * 1/sec)
7
group: H/A; age 15,03 (13,5 – 16,6) & years, weight 44,5 (39,3 – 49,6) ß kg, height 152 (145 – 158)ß cm, PWV 4,88 (4,57 – 5,19) * m/s, PWV Z 0,07 (-0,168 – 0,31) *, PWV/h 3,21 (3,03 – 3,38) * 1/sec).
Data are shown as mean (95% CI) (*p<0,05 - control vs. Tx; # p<0,05 - A vs. H/W; & p<0,05 - A/H vs. H/W; ß p<0,05 - A/H vs.
A)
Tx patients were smaller and lighter than A, furthermore, they were older than the H/W controls. There was no difference between the anthropometric data of Tx and A/H. The PWV of Tx patients did not differ from A; however, they had increased PWV values compared to H/W and A/H. The PWV-Z of Tx (1,01 (0,51-1,52) differed from the corresponding PWV-Z of all control groups. There was no difference between the PWV-Z values of A, H/W and A/H groups.
(b) Basis for standardisation of the method in children
In the group of 188 healthy children there was a linear correlation of PWV with age (r=0,6), weight (0,44), height (0,51), SBP (0,45), and DBP (0,27) (p=0,0001) and a negative correlation with heart rate (-0,29; p=0,001). By multivariate regression analysis only age remained the major determinant of PWV (ß=0,76; p=0,001).
PWV/height was proved to be age independent (PWV/h, r=−0,09 (−0,23 –0,06), p=NS). = NS). PWV/h of Tx (3,72 (3,48-3,97) 1/sec) differed significantly from A, H/W and A/H as well as from the whole control group. There was no difference between PWV/h of A, H/W and A/H. There was a highly significant correlation between values of PWV- Z and PWV/h (r = 0,88 /0,79–0,94/ p < 0,000001).
2. Universal reference values for children
Reference values were calculated for boys and girls separately.
Univariate regression analysis revealed a strong positive correlation among age, height, weight, SBP, DBP, MAP, and PWV (r=0,47; 0,44; 0,39; 0,43; 0,33; and 0,43; p<0,00001).
8
Conversely, there was a negative correlation between heart rate and PWV (r =0,08; p<0,02). By multiple regression analysis, age, height, and MAP (ß= 0,21; 0,16 and 0,24 and SE of ß=0,04; 0,039 and 0,029 respectively; p<0,001) proved to be major determinants of PWV in the healthy population. LMS values were determined and percentile boundaries were calculated and plotted according to sex, age, and height (Table and Figure 2.) A close correlation was found between PWV Z for age and for height (r=0,95;
p<0,00001).
9
Figure 2. Percentile curves according to age and height for males and females
10
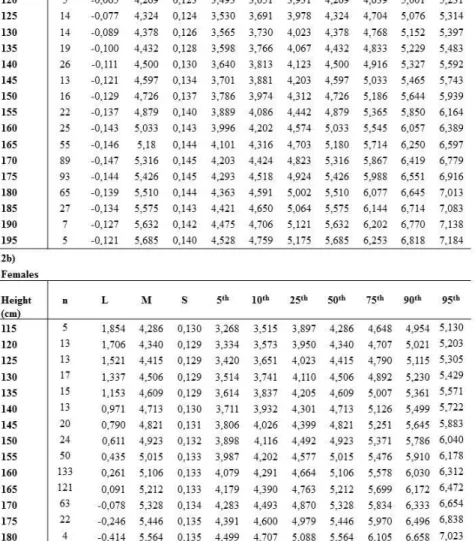
Table. LMS values and specific percentile limits for PWV according to age (1a and 1b)
11
Table LMS values and specific percentile limits for PWV according to height (2a and 2b) for males and females
12
Coming back to the problem of growth deficit: PWV of 25 Tx patients were compared to A and A/H matched healthy controls.
Using the standardized data presented PWV and PWV Zage differed significantly only form A/H, while PWV/h and PWV Zheight differs from both three control groups.
3. Comparison of three devices to measure PWV in children
Mean PWV values measured by the three instruments are: PP 6,12 (1,00) m/s, SC 5,94 (0,91) m/ s, VIC (L-m) 5,38 (0,72), VIC (L-w) 5,56 (0,69) m/s, VIC (L-corr) 6,14 (0,75) m/s. PWV by PP and SC did not differ significantly. PWV determined by VIC was significantly lower using the distances L-VIC-m and L-VIC-w than the PWV determined by SC and PP (p<0,05). Following path length correction (L-VIC-corr), there was no difference in PWV measured by VIC compared with PP and SC.
PWV measured by three different devices correlated to each other significantly (PP-SC r=0,76; SC-VIC(L-m) 0,72; SC-VIC(L-w) 0,71; SC-VIC (L-corr) 0,72; PP-VIC (L-m) 0,71; PP-VIC(L-w) 0,68; PP-VIC(L-Corr) 0,71; p<0,0001). After a path length correction, the relationship between those three devices can be described with the following equations:
PWVPP=1,64+0,76xPWVSC; r = 0,76; p = 0,0001
PWVPP=0,67+0,89xPWVVIC(L-corr); r = 0,71; p = 0,0001 PWVSC=0,16+0,93xPWV VIC(L-corr); r=0,72; p=0,0001 The mean and the standard deviation difference according to the Bland-Altman analysis were as follows (mean (SDD)): there was an excellent concordance between PP and SC (0,12 (0,77)).
Between PP and Vic (L-w) or SC and Vic (L-w) there were acceptable concordance (0,53 (0,73) and (0,43 (0,73)). After a path length correction, the concordance became excellent in both cases. (SC -0,17 (0,74) and PP -0,03 (0,72). Slight but significant proportional error was found between Vic (L-corr) and PP (a), or SC (b), which can be described with the following equations:
a) PWV (delta)= -1,78+0,29 x PWV (mean); r=0,33; p=0,003
13
b) PWV (delta)= -2,45 + 0,38 x PWV (mean); r=0,36; p=0,001 The mean difference and the SDD of the path length between the applanation tonometry devices and VIC (using path length L- VIC-corr) was -12,1 (4,4 cm), what caused the proportional error.
There was a significant proportional bias on the Bland–Altman analysis that could be expressed by the following equation (using path length L-VIC-corr): Path length (delta)=1,4–0,25 x path length(mean); r =0,36; p=0,0005.
14 Discussion
The main results of this study are that (1) PWV is a simple to perform, non-invasive method that can be used in children to assess PWV. PWV is influenced by the body dimensions in children, thus standardization is mandatory to assess the effects of growth retardation. (2) We have presented normal values for PWV in children and youngsters (3) we have assessed devices based on different measuring principles and proved the universal applicability of the methods to children.
CKD children are growth retarded compared to their healthy pairs. PWV of the transplant children is similar to the healthy population, however, this does not mean, that their PWV is normal, as they are growth retarded, and this mask the real effect of the disease process on their arteries. The fact is that using age and height matched healthy controls the difference in PWV becomes significant proving the combined effect of ageing, growth and the disease process on arterial stiffness. By using PWV-Z and the PWV/h ratio, a significant difference between Tx and all the control groups could be demonstrated. Thus controls either matched for both age and height or PWV normalized for height-age (i.e. PWV-Z) should be used to evaluate PWV of children with growth retardation of any cause. PWV-Z provides a more universal parameter to avoid the bias caused by growth retardation. As the PWV-Z and PWV/h are closely related, PWV/h is an alternative, simple, age-independent measure of PWV.
In the frame of an international collaboration, data of 1008 children were collected. As PWV shows non Gaussian distribution, the skewed distribution invalidates the calculation of conventional SD score (Z) based on arithmetic means and SDs because of the distortion of the data. LMS method is applicable for defining PWV abnormalities independent of age and of body size in diseased paediatric population, and the statistical basis of the PWV percentiles provided here is superior to all previously used estimates. Further, the age and height normalized reference database represents a
15
suitable tool for use in longitudinal studies as an intermediary CV end point.
According to international guidelines, non-invasive methods for assessing CV risk in the paediatric population need to be standardized. The applanation tonometry devices (PP and SC) are invasively validated, interchangeable. PWV measured by Vic is lower at the high level of PWV values recorded by applanation tonometry. This proportional error is due to the fact that the femoral sampling point of the Vic is distal to that of applanation tonometry and that distance is proportionally higher of longer total distances (12,1 (4,4) cm) The distorsion is irrelevant at the average PWV value of 6 m/s. After a path length correction, PWV measured by the three devices are interchangeable.
16 New observations
1. Age is the major determinant of PWV in children. During the growth process body height has a significant influence on PWV.
PWV normalized for height (PWV-Z), or PWV/height (as an alternative, simple, age independent variable) provides a universal parameter to avoid the bias of growth retardation.
2. This study is the first to provide distribution independent age and height specific reference values for PWV in children and teenagers. PWV Z height or PWV/height is applicable in the clinical practice in patients with growth retardation. The age and height normalized reference database represents a suitable tool for use in longitudinal studies as an intermediary CV end point.
3. After a path length correction, PulsePen, Sphygmocor and Vicorder are interchangeable. The reference database can be used for measurements performed by these devices.
17 4. Publications
Impact factors: 21.005 Citations: 23
Independent citations: 16
Original articles related to the paper:
Cseprekál O, Kis É, Schäffer P, Othmane T, Fekete BC, Vannay Á, Szabó AJ, Remport A, Szabó A, Tulassay T, Reusz GS Pulse wave velocity in children following renal transplantation. Nephrol Dial Transplant 2009;24:(1)pp. 309- 315.
IF: 3.306 Equally contributed
Reusz GS, Cseprekal O, Temmar M, Kis E, Cherif AB, Thaleb A, Fekete A, Szabo AJ, Benetos A, Salvi P Reference Values of Pulse Wave Velocity in Healthy Children and Teenagers.
Hypertension 56:(2) 2010;pp. 217-U75.
IF: 6.908 Equally contributed
Kis E, Cseprekal O, Kerti A, Salvi P, Benetos A, Tisler A, Szabo A, Tulassay T, Reusz GS Measurement of pulse wave velocity in children and young adults: a comparative study using three different devices. Hypertens Res 2011 Jul 28. doi:
10.1038/hr.2011.103 IF: 2.353
Original articles not related to the paper:
Kis E, Cseprekal O, Biro E, Kelen K, Ferenczi D, Kerti A, Szabo AJ, Szabo A, Reusz GS Effects of bone and mineral metabolism on arterial elasticity in chronic renal failure.Ped Nephr 2009;24:(12) pp. 2413-2420.
IF: 2.425 Equally contributed
Kis E, Cseprekal O, Horvath Z, Katona G, Fekete BC, Hrapka E, Szabo A, Szabo AJ, Fekete A, Reusz GS. Pulse wave velocity in end-stage renal disease: Influence of age and body dimensions. Pediatr Res 2008;63:(1) pp. 95-98.
IF: 2.604 Equally contributed