Electronic Supplementary Information
A mineralogically-inspired silver-bismuth hybrid material: an efficient heterogeneous catalyst for the direct synthesis of nitriles from terminal alkynes
S. B. Ötvös,
a,b* R. Mészáros,
aG. Varga,
c,dM. Kocsis
a,c,d,Z. Kónya,
e,fÁ. Kukovecz,
fP.
Pusztai,
fP. Sipos,
d,gI. Pálinkó,
c,d* and F. Fülöp
a,b*
a Institute of Pharmaceutical Chemistry, University of Szeged, Eötvös u. 6, H-6720 Szeged, Hungary
b MTA-SZTE Stereochemistry Research Group, Hungarian Academy of Sciences, Eötvös u. 6, H-6720 Szeged, Hungary
c Department of Organic Chemistry, University of Szeged, Dóm tér 8, H-6720 Szeged, Hungary
d Material and Solution Structure Research Group, Institute of Chemistry, University of Szeged, Aradi Vértanúk tere 1, H-6720 Szeged, Hungary
e MTA-SZTE Reaction Kinetics and Surface Chemistry Research Group, Hungarian Academy of Sciences, Rerrich B. tér 1, H-6720 Szeged, Hungary
f Department of Applied and Environmental Chemistry, University of Szeged, Rerrich B. tér 1, H-6720 Szeged, Hungary
g Department of Inorganic and Analytical Chemistry, University of Szeged, Dóm tér 7, H-6720 Szeged, Hungary
E-mail: otvossandor@pharm.u-szeged.hu (S.B. Ötvös); palinko@chem.u-szeged.hu (I. Pálinkó); fulop@pharm.u-szeged.hu (F. Fülöp)
Electronic Supplementary Material (ESI) for Green Chemistry.
This journal is © The Royal Society of Chemistry 2018
S1
Table of Contents
1.Additional characterization data: as-prepared AgBi HM sample ... S2 2.Additional reaction optimization data ... S5 3. Additional characterization data: used AgBi HM sample ... S6 3. Analytical data of the reaction products ... S7 5.Collection of NMR and MS spectra ... S10 6. References ... S27
S2 1. Additional characterization data: as-prepared AgBi HM sample
Fig. S1 UV–vis–near IR DRS spectra of materials A–D. (A: hydrolyzed Bi(NO3)3·5H2O, B: hydrolyzed mixture of Ag2O–Ag2CO3–AgNO3, C: Bi(NO3)3·5H2O–AgNO3 mixture co-hydrolyzed at 130 °C and D: Bi(NO3)3·5H2O–
AgNO3 mixture co-hydrolyzed at 100 °C.)
Fig. S2 EPR spectra of of materials A–D. (A: hydrolyzed Bi(NO3)3·5H2O, B: hydrolyzed mixture of Ag2O–
Ag2CO3–AgNO3, C: Bi(NO3)3·5H2O–AgNO3 mixture co-hydrolyzed at 130 °C and D: Bi(NO3)3·5H2O–AgNO3
mixture co-hydrolyzed at 100 °C.)
300 400 500 600 700
Reflection (a.u.)
Wavelength (nm) 365
385
495
491 381
A B C D
S3
Fig. S3 IR spectra for materials A–D. (A: hydrolyzed Bi(NO3)3·5H2O, B: hydrolyzed mixture of Ag2O–Ag2CO3– AgNO3, C: Bi(NO3)3·5H2O–AgNO3 mixture co-hydrolyzed at 130 °C and D: Bi(NO3)3·5H2O–AgNO3 mixture co-hydrolyzed at 100 °C.)
Table S1 The observed vibrations by IR spectroscopy for samples A–D. (A: hydrolyzed Bi(NO3)3·5H2O, B:
hydrolyzed mixture of Ag2O–Ag2CO3–AgNO3, C: Bi(NO3)3·5H2O–AgNO3 mixture co-hydrolyzed at 130 °C and D: Bi(NO3)3·5H2O–AgNO3 mixture co-hydrolyzed at 100 °C)
Sample Vibration (cm–1)
a b c d e f g h i j
A – 312 430 472 780 815 – 1030 1320 1455
B 280 – – – 720 800 – 1070 1310 1395
C 280 – 377 – – – 846 – 1380 –
D 280 – 377 472 780 814 845 1030 1380/1310 1450
a Ag–O (carbonate) bending vibration[1]
b Bi–O–Bi vibration of the BiO6 octahedral unit[2]
c ν2 totally symmetric bending vibration of the Bi–O bonds in the BiO3 units[3]
d Bi–O bending vibrations of the BiO6 units[3]
e ν4 in-plane deformation vibration mode of the carbonate or the nitrate ion[3, 4]
f ν2 out-of-plane bending vibration mode of the nitrate or the carbonate ion[3, 4]
g ν1 symmetric stretching vibrations of Bi–O bonds in BiO3 units[3]
h ν1 symmetric vibration of the nitrate or the carbonate ion[3, 4]
i ν3 antisymmetric vibration of the nitrate or the carbonate ion[3, 4]
j ν3 antisymmetric vibration of the nitrate or the carbonate ion[3, 4]
Table S2 The composition of materials A and C by ICP–AES measurements assuming the O2CO3 unit, the theoretical formula of the Bi subcarbonate is in parentheses. (A: hydrolyzed Bi(NO3)3·5H2O, C:
Bi(NO3)3·5H2O–AgNO3 mixture co-hydrolyzed at 130 °C.)
Sample Ag content (w%) Bi content (w%) Formula
A – 77.9 (82.0) Bi1.6O2CO3 (Bi2O2CO3)
C 6.1 62.7 Ag0.17Bi0.88O2CO3
S4 (a) (b)
Fig. S4 The Ag3d (a) and Bi4f (b) XPS spectra of material C (the Bi(NO3)3·5H2O–AgNO3 mixture co-hydrolyzed at 130°C) and materials A (hydrolyzed Bi(NO3)3·5H2O) and B (the hydrolyzed mixture of Ag2O–Ag2CO3–AgNO3).
Fig. S5 The AFM (atomic force microscopy) image of the AgBi HM a) (b)
Fig. S6 The enlarged TEM (a) and the SAED (b) images of the AgBi HM.
S5 2. Additional reaction optimization data
Fig. S7 Investigation of the effects of the reaction temperature on the AgBi HM-catalyzed nitrogenation of p-methoxy phenylacetylene with TMSN3 (see Scheme 1 in the manuscript). Reaction conditions:
1 equiv. (0.25 M) alkyne, 2 equiv. TMSN3, 10 mol% catalyst, solvent: DMSO, 1 h or 24 h reaction time.
Fig. S8 Investigation of the effects of H2O as an additive on the AgBi HM-catalyzed nitrogenation of p- methoxy phenylacetylene with TMSN3 as nitrogen source (see Scheme 1 in the manuscript). Reaction conditions: 1 equiv. (0.25 M) alkyne, 2 equiv. TMSN3, 2 equiv. H2O, 10 mol% catalyst, solvent: DMSO, 80
°C, 0.5‒72 h reaction time.
S6 3. Additional characterization data: used AgBi HM sample
Fig. S9 The Raman spectrum of the used catalysts sample.
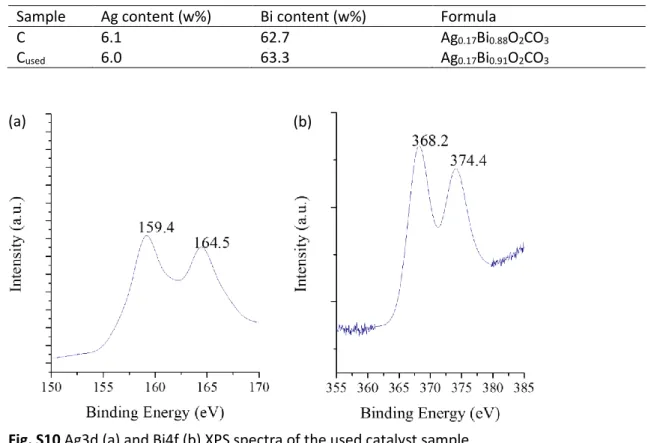
Table S3 The composition of the as-prepared vs. the used catalyst samples (materials C and Cused) by ICP-AES measurements
Sample Ag content (w%) Bi content (w%) Formula
C 6.1 62.7 Ag0.17Bi0.88O2CO3
Cused 6.0 63.3 Ag0.17Bi0.91O2CO3
Fig. S10 Ag3d (a) and Bi4f (b) XPS spectra of the used catalyst sample.
(a) (b)
S7 4. Analytical data of the reaction products
4-methoxybenzonitrile
1H NMR (400.1 MHz, CDCl3): δ = 7.56‒7.59 (d, J= 8.95 Hz, 2H); 6.93‒6.96 (d, J= 8.95 Hz, 2H); 3.86 (s, 3H). NMR data is in agreement with the literature reference.[5] MS (EI): m/z = 133 (M+), 118, 103, 90, 76, 63.
benzonitrile
1H NMR (400.1 MHz, CDCl3): δ = 7.64–7.70 (d, J= 7.58 Hz, 2H); 7.59–7.63 (t, J= 7.87 Hz, 1H); 7.46‒
7.52 (t, J= 7.58 Hz, 2H). NMR data is in agreement with the literature reference.[5] MS (EI): m/z = 103 (M+), 86, 76, 63, 50, 39.
4-methylbenzonitrile
1H NMR (400.1 MHz, CDCl3): δ = 7.53–7.55 (d, J= 8.10 Hz, 2H); 7.26–7.28 (d, J= 8.10 Hz, 2H); 2.42 (s, 3H). NMR data is in agreement with the literature reference.[5] MS (EI): m/z = 117 (M+), 90, 63, 51, 39.
4-bromobenzonitrile
1H NMR (400.1 MHz, CDCl3): δ = 7.63–7.65 (d, J= 8.42 Hz, 2H); 7.52–7.54 (d, J= 8.42 Hz, 2H). NMR data is in agreement with the literature reference.[5] MS (EI): m/z = 181 (M+), 102, 75, 51.
4-(tert-butyl)benzonitrile
1H NMR (400.1 MHz, CDCl3): δ = 7.57–7.60 (d, J= 8.50 Hz, 2H); 7.47–7.49 (d, J= 8.50 Hz, 2H); 1.33 (s, 9H). NMR data is in agreement with the literature reference.[5] MS (EI): m/z = 159 (M+), 144, 116, 104, 89, 77, 63.
S8 4-methoxy-2-methylbenzonitrile
1H NMR (400.1 MHz, CDCl3): δ = 7.50–7.52 (d, J= 8.31, 1H); 6.75–6.79 (m, 2H); 3.84 (s, 3H); 2.51 (s, 3H). NMR data is in agreement with the literature reference.[6] MS (EI): m/z = 147 (M+), 132, 117, 104, 90, 77, 63.
2,4,5-trimethylbenzonitrile
1H NMR (400.1 MHz, CDCl3): δ = 7.32 (s, 1H); 7.06 (s, 1H); 2.45 (s, 3H); 2.27 (s, 3H); 2.23 (s, 3H).
13C NMR (100.6 MHz, CDCl3) δ = 142.6; 139.6; 135.2; 133.5; 131.9; 119.0; 110.2; 20.4; 20.2; 19.4.
MS (EI): m/z = 145 (M+), 130, 115, 103, 89, 77, 63.
thiophene-3-carbonitrile
1H NMR (400.1 MHz, CDCl3): δ = 7.94–7.95 (d, J= 2.58 Hz, 1H); 7.42–7.44 (q, J= 8.31 Hz, 1H); 7.30–
7.32 (d, J= 5.2 Hz, 1H). NMR data is in agreement with the literature reference.[7] MS (EI): m/z = 109 (M+), 82, 64, 58, 45.
2-phenoxyacetonitrile
1H NMR (400.1 MHz, CDCl3): δ = 7.33–7.37 (t, J= 8.28 Hz, 2H); 7.07–7.11 (t, J= 7.95 Hz, 1H); 7.00–
6.96 (d, J= 7.95 Hz 2H); 4.76 (s, 2H). NMR data is in agreement with the literature reference.[8]
MS (EI): m/z = 133 (M+), 105, 93, 77, 65.
cyanomethyl benzoate
1H NMR (400.1 MHz, CDCl3): δ = 8.04–8.08 (d, J= 7.43 Hz, 2H); 7.61–7.65 (t, J= 7.63 Hz, 1H); 7.46–
7.51 (t, J= 7.63 Hz, 2H); 4.97 (s, 2H). NMR data is in agreement with the literature reference.[9]
MS (EI): m/z = 161 (M+), 105, 77.
S9 cyanomethyl 4-nitrobenzoate
1H NMR (400.1 MHz, CDCl3): δ = 8.33–8.35 (d, J= 7.46 Hz, 2H); 8.24–8.26 (d, J= 7.46 Hz, 2H); 5.02 (s, 2H). NMR data is in agreement with the literature reference.[9] MS (EI): m/z = 206 (M+), 176, 150, 120, 104, 92, 76, 64.
nonanenitrile
1H NMR (400.1 MHz, CDCl3): δ = 2.30–2.37 (t, J= 7.25 Hz, 2H); 1.61–1.71 (m, 2H); 1.40–1.48 (m, 2H); 1.26–1.33 (m, 6H); 0.86–0.92 (m, 3H). NMR data is in agreement with the literature reference.[5] MS (EI): m/z = 111, 97, 83, 71, 57, 44, 28.
heptanenitrile
1H NMR (400.1 MHz, CDCl3): δ = 2.30–2.37 (t, J= 7.25 Hz, 2H); 1.60–1.69 (m, 2H); 1.41–1.49 (m, 2H); 1.29–1.35 (m, 4H); 0.85–0.93 (m, 3H). NMR data is in agreement with the literature reference.[5] MS (EI): m/z = 96, 83, 55, 44, 28.
glutaronitrile
1H NMR (400.1 MHz, CDCl3): δ = 2.52–2.58 (t, J= 7.16 Hz, 4H); 2.01–2.09 (m, 2H). NMR data is in agreement with the literature reference.[10] MS (EI): m/z = 66, 54, 40, 28.
2-cyclohexylacetonitrile
1H NMR (400.1 MHz, CDCl3): δ = 2.20–2.26 (d, J= 6.58 Hz, 2H); 1.63–1.86 (m, 6H); 1.00–1.34 (m, 5H). NMR data is in agreement with the literature reference.[5] MS (EI): m/z = 96, 83, 67, 55.
S10 5.Collection of NMR and MS Spectra
S11
S12
S13
S14
S15
S16
S17
S18
S19
S20
S21
S22
S23
S24
S25
S26
S27 6. References
1 C. B. Wang, G. Deo and I. E. Wachs, J. Phys. Chem. B, 1999, 103, 5645-5656.
2 B. Suresh, M. S. A. Reddy, S.S. Reddy, Y. Gandhi, Y. V. Kumar and N. Veeraiah, Spectrochim. Acta A, 2015, 141, 263-271.
3 G. Zhao, Y. Tian, H. Fan, J. Zhang and L. Hu, J. Mater. Sci. Technol., 2013, 29, 209-214.
4 C. Sun, D. Mei, J. Xu and Y. Wu, J. Alloys Compd., 2017, 702, 410-417.
5 T. Shen, T. Wang, C. Qin and N. Jiao, Angew. Chem. Int. Ed., 2013, 52, 6677-6680.
6 U. Dutta, D. W. Lupton and D. Maiti, Org. Lett., 2016, 18, 860-863.
7 J. R. Coombs, K. J. Fraunhoffer, E. M. Simmons, J. M. Stevens, S. R. Wisniewski and M. Yu, J. Org.
Chem., 2017, 82, 7040-7044.
8 J. Zhang, W. Wu, X. Ji and S. Cao, RSC Adv., 2015, 5, 20562-20565.
9 H. Wang, Y. Shao, H. Zheng, H. Wang, J. Cheng and X. Wan, Chem. Eur. J., 2015, 21, 18333-18337.
10 D. J. Quinn, G. J. Haun and G. Moura-Letts, Tetrahedron Lett., 2016, 57, 3844-3847.


![arXiv:2111.09702v1 [math.CO] 18 Nov 2021](data:image/gif;base64,R0lGODlhAQABAIAAAP///wAAACH5BAEAAAAALAAAAAABAAEAAAICRAEAOw==)