Supporting Information
Mechanochemical and wet chemical syntheses of CaIn-layered double hydroxide and its performance in a transesterification reaction compared to those of other Ca
2M(III) hydrocalumites (M: Al, Sc, V, Cr, Fe, Ga) and Mg(II)-, Ni(II)-, Co(II)- or Zn(II)-based hydrotalcites
Márton Szabados,
a,bAnna Adél Ádám
a,b, Péter Traj,
a,bSzabolcs Muráth,
c,dKornélia Baán
e, Péter Bélteky
e, Zoltán Kónya,
e,fÁkos Kukovecz,
ePál Sipos,
b,gand István Pálinkó
a,b*aDepartment of Organic Chemistry, University of Szeged, Dóm tér 8, Szeged, H-6720 Hungary
bMaterial and Solution Structure Research Group, Interdisciplinary Excellence Centre, Institute of Chemistry, University of Szeged, Aradi vértanúk tere 1, Szeged, H-6720 Hungary
cMTA-SZTE Biocolloids Research Group, Rerrich B. tér 1, Szeged, H-6720, Hungary
dInterdisciplinary Excellence Centre, Department of Physical Chemistry and Materials Science, University of Szeged, Rerrich B. tér 1, Szeged, H-6720, Hungary
eDepartment of Applied and Environmental Chemistry, University of Szeged, Rerrich B. tér 1, Szeged, H- 6720 Hungary
fMTA-SZTE Reaction Kinetics and Surface Chemistry Research Group, Rerrich B. tér 1, Szeged, H-6720 Hungary
gDepartment of Inorganic and Analytical Chemistry, University of Szeged, Dóm tér 7, Szeged, H-6720 Hungary
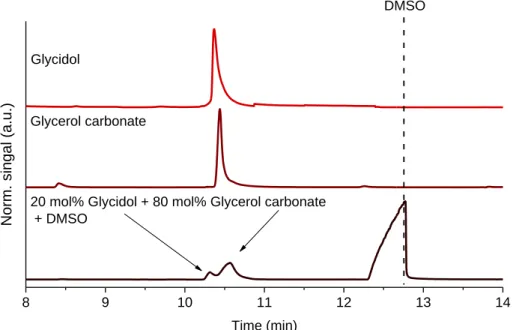
8 9 10 11 12 13 14
Norm. singal (a.u.)
Time (min) Glycerol carbonate
Glycidol
20 mol% Glycidol + 80 mol% Glycerol carbonate + DMSO
DMSO
Fig. S1 The advantageous effect of DMSO on the separation of glycidol and glycerol carbonate.
Correponding author: István Pálinkó
E-mail address: palinko@chem.u-szeged.hu (I. Pálinkó)
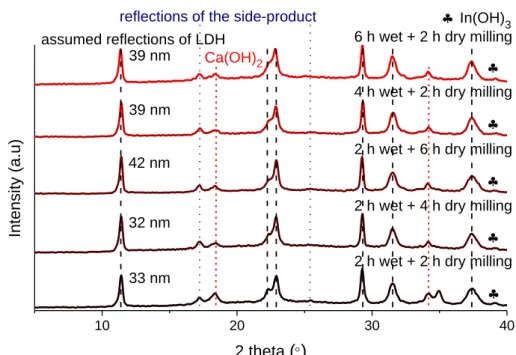
10 20 30 40 4 h wet + 2 h dry milling
2 h wet + 6 h dry milling
2 h wet + 4 h dry milling
2 h wet + 2 h dry milling 6 h wet + 2 h dry milling
39 nm 39 nm
32 nm 42 nm
33 nm
Intens ity (a.u)
2 theta (
)
assumed reflections of LDH
reflections of the side-product Ca(OH)2
In(OH)3
Fig. S2 X-ray powder diffraction patterns for the solids prepared with the purely mechanochemical technique at different wet and dry grinding times (400 l saturated NaCl solution).
10 20 30 40
800 l
600 l
500 l 400 l 900 l 42 nm
35 nm
38 nm 41 nm
33 nm
Ca(OH)2
Intens ity (a.u)
2 theta (
)
In(OH)3 LDH
side-product
Fig. S3 X-ray powder diffractogram patterns for the samples synthesized by the purely
mechanochemical technique at varied amounts of the saturated NaCl solutions (2 h dry and
2 h wet milling).
10 20 30 40
24 h stirring at 85C
12 h stirring at 85C
12 h stirring at 25C 32 nm
38 nm 39 nm
21 nm
side-product LDH
Intens ity (a.u)
2 theta (
)
Ca(OH)236 h stirring at 85C
In(OH)3
Fig. S4 X-ray powder diffraction patterns for the materials at varied stirring time and temperature prepared by the mechanochemically-aided route (2 h dry grinding, 5 ml 0.4 M NaCl solution).
10 20 30 40
25 nm 22 nm
Intens ity (a.u)
26 nm
19 nm
17 nm side-product
2 theta (
)
4 h
2 h 1 h 0.5 h 6 h LDH
Fig. S5 X-ray powder diffraction patterns for the samples at varying stirring time (room
temperature, 2:1 Ca:In initial molar ratio, 3 M base).
10 20 30 40 26 nm
Intens ity (a.u)
31 nm
22 nm
14 nm side-product
75C
50C
25C
5C
2 theta (
)
LDHFig. S6 XRD patterns for the materials prepared at various temperatures (2 h stirring, 2:1 Ca:In initial molar ratio, 3 M base).
4000 3500 3000 2500 2000 1500 1000
0 5
Absorbance (a.u.)
Wavenumber (cm-1) 1635
Fig. S7 Infrared spectrum of the CaCl
2×2H
2O starting reagent.
Fig. S8 TEM (the first), SEM (the second) and elemental map (the last four) images for the
CaIn-hydroxide-chloride side-product.
0.0 0.2 0.4 0.6 0.8 1.0 0
5 10 15 20 25 30
Quantity adsorbed gas (cm3/g STP)
Relative pressure (p/p0)
Adsorption Desorption CaAl-layered double hydroxide
1 10 100 1000
0.0000 0.0002 0.0004 0.0006
CaAl-layered double hydroxide
dV(r) cm3/nm/g
Pore diameter (nm)
0.0 0.2 0.4 0.6 0.8 1.0
0 50 100 150 200 250
Quantity adsorbed gas (cm3/g STP)
CaSc-layered double hydroxide Adsorption Desorption
Relative pressure (p/p0)
1 10 100
0.000 0.001 0.002
dV(r) cm3/nm/g
CaSc-layered double hydroxide
Pore diameter (nm)
0.0 0.2 0.4 0.6 0.8 1.0
0 5 10 15 20 25 30 35 40
CaV-layered double hydroxide
Quantity adsorbed gas (cm3/g STP)
Relative pressure (p/p0)
Adsorption Desorption
1 10 100 1000
0.0000 0.0004 0.0008
CaV-layered double hydroxide
dV(r) cm3/nm/g
Pore diameter (nm)
0.0 0.2 0.4 0.6 0.8 1.0
0 10 20 30 40 50 60 70 80
Relative pressure (p/p0) Quantity adsorbed gas (cm3/g STP)
CaCr-layered double hydroxide Adsorption Desorption
1 10 100 1000
0.0000 0.0004 0.0008 0.0012
dV(r) cm3/nm/g
Pore diameter (nm) CaCr-layered double hydroxide
0.0 0.2 0.4 0.6 0.8 1.0 0
10 20 30 40 50 60 70 80
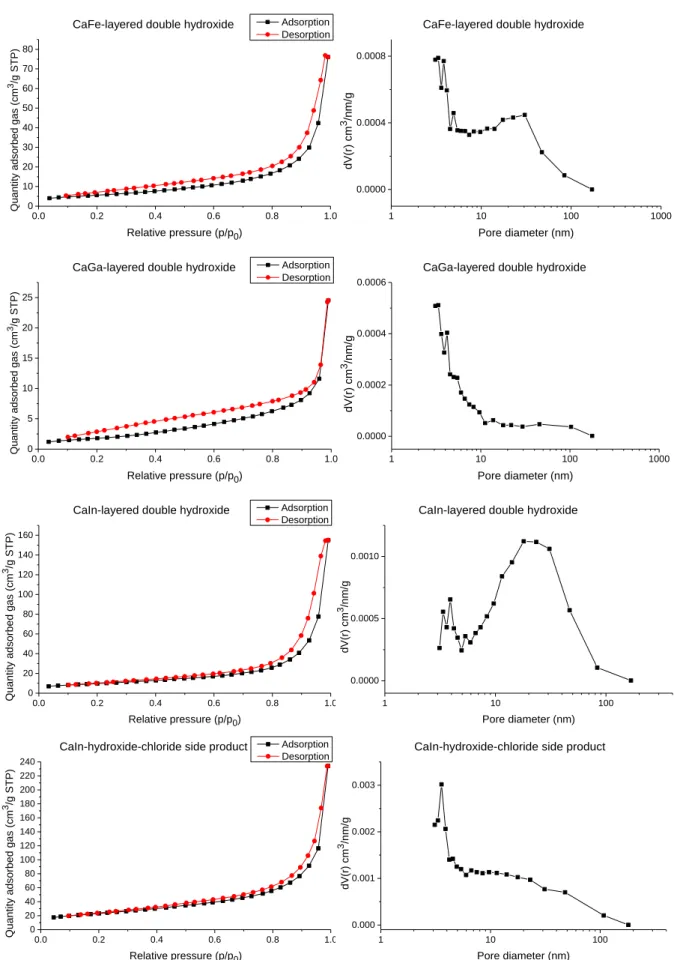
Adsorption Desorption CaFe-layered double hydroxide
Quantity adsorbed gas (cm3/g STP)
Relative pressure (p/p0)
1 10 100 1000
0.0000 0.0004 0.0008
dV(r) cm3/nm/g
CaFe-layered double hydroxide
Pore diameter (nm)
0.0 0.2 0.4 0.6 0.8 1.0
0 5 10 15 20 25
Quantity adsorbed gas (cm3/g STP)
CaGa-layered double hydroxide Adsorption Desorption
Relative pressure (p/p0)
1 10 100 1000
0.0000 0.0002 0.0004 0.0006
CaGa-layered double hydroxide
dV(r) cm3/nm/g
Pore diameter (nm)
0.0 0.2 0.4 0.6 0.8 1.0
0 20 40 60 80 100 120 140 160
Adsorption Desorption
Quantity adsorbed gas (cm3/g STP)
CaIn-layered double hydroxide
Relative pressure (p/p0)
1 10 100
0.0000 0.0005 0.0010
CaIn-layered double hydroxide
dV(r) cm3/nm/g
Pore diameter (nm)
0.0 0.2 0.4 0.6 0.8 1.0
0 20 40 60 80 100 120 140 160 180 200 220 240
Adsorption Desorption
Relative pressure (p/p0) Quantity adsorbed gas (cm3/g STP)
CaIn-hydroxide-chloride side product
1 10 100
0.000 0.001 0.002 0.003
CaIn-hydroxide-chloride side product
dV(r) cm3/nm/g
Pore diameter (nm)
Fig. S9 N
2adsorption-desorption isotherms (left) and the corresponding pore size distribution
plots (right) for the LDHs and the CaIn
-hydroxide-chloride side-product.
10 20 30 40 50 60 70
Intens ity (a.u)
2 theta (
)
Heat-treatedCaIn-layered double hydroxide
Heat-treated
CaIn-hydroxide-chloride side product
CaIn2
O
4 CaO
Fig. S10 X-ray powder diffraction patterns for the CaIn-LDH and the side-product after heat treatment at 900°C.
10 20 30 40 50 60 70
32 nm
after 1. use CaAl-LDH without DMSO after 2. use CaAl-LDH
after 1. use CaAl-LDH
initial CaAl-LDH after 3. use CaAl-LDH
Intens ity (a.u)
2 theta (
)
23 nm
10 20 30 40 50 60 70 17 nm
Intens ity (a.u)
2 theta (
)
after 2. use CaSc-LDH
after 1. use CaSc-LDH
initial CaSc-LDH after 3. use CaSc-LDH 15 nm
15 nm
16 nm
10 20 30 40 50 60 70
Intens ity (a.u)
2 theta (
)
after 2. use CaV-LDH
after 1. use CaV-LDH
initial CaV-LDH after 3. use CaV-LDH
6 nm
unknown reflections
10 20 30 40 50 60 70
Intens ity (a.u)
9 nm2 theta (
)
after 2. use CaCr-LDH
after 1. use CaCr-LDH
initial CaCr-LDH after 3. use CaCr-LDH
5 nm
10 20 30 40 50 60 70
Intens ity (a.u)
2 theta (
)
after 2. use CaFe-LDH
after 1. use CaFe-LDH
initial CaFe-LDH after 3. use CaFe-LDH
18 nm
10 20 30 40 50 60 70 26 nm
Intens ity (a.u)
2 theta (
)
after 2. use CaGa-LDH
after 1. use CaGa-LDH
initial CaGa-LDH after 3. use CaGa-LDH
10 20 30 40 50 60 70
20 nm
Intens ity (a.u)
2 theta (
)
after 2. use CaIn-LDH
after 1. use CaIn-LDH
initial CaIn-LDH after 3. use CaIn-LDH
20 nm 15 nm
10 20 30 40 50 60 70
Intens ity (a.u)
2 theta (
)
after 2. use Ca3In4-side-product
after 1. use Ca3In4-side-product
initial Ca3In4-side-product after 3. use Ca3In4-side-product
Fig. S11 X-ray powder diffraction curves of the initial, the used hydrocalumites and the
Ca
3In
4-side-product.
4000 3500 3000 2500 2000 1500 1000
after 1. use CaAl-LDH
Abs orba nc e (a.u.)
1490Wavenumber (cm
-1)
initial CaAl-LDH after 1. use CaAl-LDH without DMSO after 3. use CaAl-LDH2935 2870 1775
1620, interlayer water, 780
10401105
1410
4000 3500 3000 2500 2000 1500 1000
1040
Wavenumber (cm
-1)
Abs orba nc e (a.u.)
initial CaSc-LDH after 1. use CaSc-LDH after 3. use CaSc-LDH
1500 1100
2935 2870 1780
1620, interlayer water, 730
1400
4000 3500 3000 2500 2000 1500 1000
Wavenumber (cm
-1)
Abs orba nc e (a.u.)
initial CaV-LDH after 1. use CaV-LDH after 3. use CaV-LDH
1480
2920 2860 1785
1630, interlayer water, 790
10451090
1410
4000 3500 3000 2500 2000 1500 1000
Wavenumber (cm
-1)
Abs orba nc e (a.u.)
initial CaCr-LDH after 1. use CaCr-LDH after 3. use CaCr-LDH
1500
2930 2865
1635, interlayer water, 775
10501105
1395
4000 3500 3000 2500 2000 1500 1000
Abs orba nc e (a.u.)
Wavenumber (cm
-1)
initial CaFe-LDH after 1. use CaFe-LDH after 3. use CaFe-LDH1480
2930 2850
1615, interlayer water, 750
1775 104011001400
4000 3500 3000 2500 2000 1500 1000
Wavenumber (cm
-1)
Abs orba nc e (a.u.)
initial CaGa-LDH after 1. use CaGa-LDH after 3. use CaGa-LDH
1480
2925 2850
1615, interlayer water, 785
1775 105011051405
4000 3500 3000 2500 2000 1500 1000
1470
after 3. use Ca3In4-side-product
after 3. use CaIn-LDH
Abs orba nc e (a.u.)
Wavenumber (cm
-1)
after 1. use CaIn-LDHafter 1. use Ca3In4-side-product
2925 2860 1780 105010951410
Fig. S12 Infrared spectra of the initial, the used hydrocalumites and the Ca
3In
4-side-product.
300 400 500 600 700 800
0 50 100
605
Sc hu ster-Kub elk a-Mu nk f un ction (a.u.)
Wavelenght (nm)
395Fig. S13 UV–Vis diffuse reflection spectrum of the CaV-LDH.
100 200 300 400 500 600 700 800 moderate
weak
CaIn-LDH CaGa-LDH
CaCr-LDH CaFe-LDH
CaV-LDH CaSc-LDH CaAl-LDH
No rm. sig na l ( a.u.)
Temperature (C)
Ca3In4-side-product strong basic sites
Fig. S14 CO
2-TPD profiles of the hydrocalumites and the Ca
3In
4-side-product.
10 20 30 40 50 60 70 7 nm
Intens ity (a.u)
9 nm4 nm
2 theta (
)
initial MgAl-LDH after 1. use MgAl-LDH after 2. use MgAl-LDH after 3. use MgAl-LDH
10 20 30 40 50 60 70
Intens ity (a.u)
6 nm2 theta (
)
initial MgCr-LDH after 1. use MgCr-LDH after 2. use MgCr-LDH after 3. use MgCr-LDH
10 20 30 40 50 60 70
Intens ity (a.u)
8 nm
initial MgFe-LDH after 1. use MgFe-LDH after 2. use MgFe-LDH after 3. use MgFe-LDH
2 theta (
)
10 20 30 40 50 60 70
4 nm
5 nm
5 nm
Intens ity (a.u)
4 nm
initial NiAl-LDH after 1. use NiAl-LDH after 2. use NiAl-LDH after 3. use NiAl-LDH
2 theta (
)
10 20 30 40 50 60 70
after 3. use NiCr-LDH
after 2. use NiCr-LDH
after 1. use NiCr-LDH
initial NiCr-LDH
3 nm
Intens ity (a.u)
2 theta (
)
10 20 30 40 50 60 70
4 nm
Intens ity (a.u)
2 theta (
)
initial NiFe-LDH after 1. use NiFe-LDH after 2. use NiFe-LDH
10 20 30 40 50 60 70
2 theta (
)
Intens ity (a.u)
after 3. use CoAl-LDH after 2. use CoAl-LDH after 1. use CoAl-LDH initial CoAl-LDH 12 nm
10 20 30 40 50 60 70
2 theta (
)
Intens ity (a.u)
5 nm
initial CoCr-LDH after 1. use CoCr-LDH after 2. use CoCr-LDH after 3. use CoCr-LDH
10 20 30 40 50 60 70
Intens ity (a.u)
10 nm
2 theta (
)
initial CoFe-LDH after 1. use CoFe-LDH after 2. use CoFe-LDH
10 20 30 40
10 nm 7 nm
ZnFe-LDH
ZnCr-LDH
ZnAl-LDH
Intens ity (a.u)
2 theta (
)
5 nm