Supporting Information
A mineralogically-inspired silver–bismuth hybrid material: Structure, stability and application for catalytic benzyl alcohol dehydrogenations under continuous flow conditions
Rebeka Mészáros,a Sándor B. Ötvös,*bc Gábor Varga,de Éva Böszörményi,de Marianna Kocsis,de Krisztina Karádi,e Zoltán Kónya,fg, Ákos Kukovecz,f István Pálinkó*de and Ferenc Fülöp*ab
aInstitute of Pharmaceutical Chemistry, University of Szeged, Eötvös u. 6, Szeged, H-6720 Hungary.
bMTA-SZTE Stereochemistry Research Group, Hungarian Academy of Sciences, Eötvös u. 6, Szeged, H-6720 Hungary.
cInstitute of Chemistry, University of Graz, NAWI Graz, Heinrichstrasse 28, Graz, A-8010 Austria.
dDepartment of Organic Chemistry, University of Szeged, Dóm tér 8, Szeged, H-6720 Hungary.
eMaterial and Solution Structure Research Group and Interdisciplinary Excellence Centre, Institute of Chemistry, University of Szeged, Aradi Vértanúk tere 1, Szeged, H-6720 Hungary.
fDepartment of Applied and Environmental Chemistry, University of Szeged, Rerrich Béla tér 1, Szeged, H-6720 Hungary
gMTA-SZTE Reaction Kinetics and Surface Chemistry Research Group, Rerrich Béla tér 1, Szeged, H-6720 Hungary
Corresponding authors: S.B. Ötvös, I. Pálinkó and F. Fülöp
e-mail address: sandor.oetvoes@uni-graz.at (S.B. Ötvös), palinko@chem.u-szeged.hu (I. Pálinkó), fulop@pharm.u-szeged.hu (F. Fülöp)
S2
Table of Contents
1. Additional figures and tables ...S3 2. Analytical data of the reaction products ...S13 3. Collection of NMR spectra ...S16 4. References ...S36
S3 Additional figures and tables
5 10 15 20 25 30 35 40
A B C E D
Intensity (a.u.)
2/
200C 150C 100C 50C 25C A F
[002] [101] [004]
[105]
[110]
[006] [107]
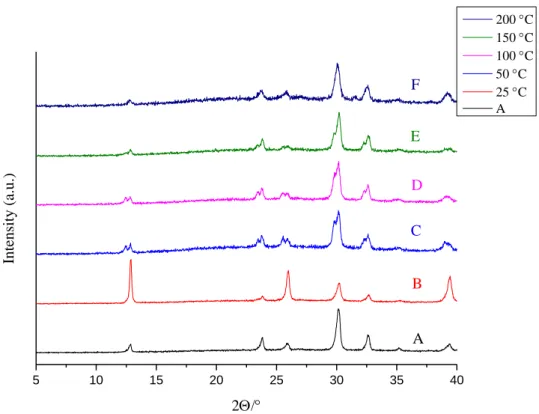
Fig. S1. XRD patterns of AgBi-HM samples: as-prepared (A), treated with acetone at various temperatures (B-F).
5 10 15 20 25 30 35 40
200 C 150 C 110 C 50 C 25 C A
Intensity (a.u.)
2
F E
D C
B
A
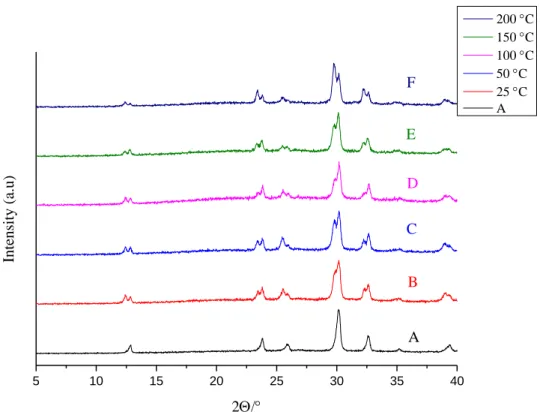
Fig. S2. XRD patterns of AgBi-HM samples: as-prepared (A), treated with DMA at various temperatures (B-F).
S4
5 10 15 20 25 30 35 40
0 1 2 3 4 5 6
Intensity (a.u.)
2
200 C 150 C 100 C 50 C 25 C A
F
E
D C
B
A
Fig. S3. XRD patterns of AgBi-HM samples: as-prepared (A), treated with toluene at various temperatures (B-F).
5 10 15 20 25 30 35 40
Intensity (a.u.)
2
200C 150C 100C 50C 25C A F
E
D C
B
A
Fig. S4. XRD patterns of AgBi-HM samples: as-prepared (A), treated with THF at various temperatures (B-E).
S5
5 10 15 20 25 30 35 40
Intensity (a.u.)
2
200C 150C 100C 50C 25C A
F
E
D C
B
A
Fig. S5. XRD patterns of AgBi-HM samples: as-prepared (A), treated with DMSO at various temperatures (B-F).
5 10 15 20 25 30 35 40
200C 150C 100C 50C 25C A
Intensity (a.u.)
2
F
E
D C
B
A
Fig. S6. XRD patterns of AgBi-HM samples: as-prepared (A), treated with CHCl3 at various temperatures (B-F).
S6
5 10 15 20 25 30 35 40
Intensity (a.u.)
2
200 C 150 C 100 C 50 C 25 C A F
E
D C
B
A
Fig. S7. XRD patterns of AgBi-HM samples: as-prepared (A), treated with iPrOH at various temperatures (B-F).
5 10 15 20 25 30 35 40
Intensity (a.u.)
2
200C 150C 100C 50C 25C A
F
E
D C
B
A
Fig. S8. XRD patterns of AgBi-HM samples: as-prepared (A), treated with CH2Cl2 at various temperatures (B-F).
S7
5 10 15 20 25 30 35 40
Intensity (a.u.)
2
200C 150C 100C 50C 25C A
F
E
D C
B
A
Fig. S9. XRD patterns of AgBi-HM samples: as-prepared (A), treated with MeOH at various temperatures (B-F).
5 10 15 20 25 30 35 40
Intensity (a.u.)
2
200C 150C 100C 50C 25C A
F
E
D C
B
A
Fig. S10. XRD patterns of AgBi-HM samples: as-prepared (A), treated with NMP at various temperatures (B-F).
S8
5 10 15 20 25 30 35 40
Intensity (a.u)
2
200 C 150 C 100 C 50 C 25 C A F
E
D C
B
A
Fig. S11. XRD patterns of AgBi-HM samples: as-prepared (A), treated with diethyl ether at various temperatures (B-F).
5 10 15 20 25 30 35 40
Intensity (a.u.)
2
200C 150C 100C 50C 25C A
F
E
D C
B
A
Fig. S12. XRD patterns of AgBi-HM samples: as-prepared (A), treated with EtOH at various temperatures (B-F).
S9
5 10 15 20 25 30 35 40
Intensity (a.u.)
2
200 C 150 C 100 C 50 C 25 C A
D E F
C
B
A
Fig. S13. XRD patterns of AgBi-HM samples: as-prepared (A), treated with H2O at various temperatures (B-F).
5 10 15 20 25 30 35 40
Intensity (a.u.)
2
200C 150C 100C 50C 25C A
E F
D C
B
A
Fig. S14. XRD patterns of AgBi-HM samples: as-prepared (A), treated with MeCN at various temperatures (B-F).
S10
5 10 15 20 25 30 35 40
Intensity (a.u.)
2
200C 150C 100C 50C 25C A
F
E
D C
B
A
Fig. S15. XRD patterns of AgBi-HM samples: as-prepared (A), treated with n-hexane at various temperatures (B-F).
5 10 15 20 25 30 35 40
Intensity (a.u.)
2
200C 150C 100C 50C 25C A
F
E
D C
B
A
Fig. S16. XRD patterns of AgBi-HM samples: as-prepared, treated with DMF at various temperatures (B-F).
S11
5 10 15 20 25 30 35 40
Intensity (a.u.)
2
200C 150C 100C 50C 25C A
F
E
D C
B
A
Fig. S17. XRD patterns of AgBi-HM samples: as-prepared (A), treated with EtOAc at various temperatures (B-F).
4000 3500 3000 1500 1000
Intensity (a.u.)
Wavenumber (cm–1) 2811
2873 2936 2645
1380 846
1013950
A B C
Fig. S18. FT-IR spectra of AgBi-HM samples: as-prepared without solvent treatment (A), treated with iPrOH at 50°C (B) and MeOH at 200°C (C).
S12 Table S1. Investigating the effects of substrate concentration on dehydrogenation reaction of 4-methylbenzyl alcohol under continuous flow conditions.
Entry Concentration (M) Conversion (%)a Selectivity (%)a
1 0.075 92 100
2 0.1 94 52
3 0.15 89 45
a Determined by 1H NMR analysis of the crude product.
Scheme S1. Possible reaction mechanism of the dehydrogenation of the 4- methylbenzylalcohol. I. step: C–H bond activation by the silver ion and O–H bond activation by the oxide surface, II. step: C–H cleavage, III. step: O–H bond cleavage.
S13 Analytical data of the reaction products
Me
H O
4-methylbenzaldehyde
1H NMR (500 MHz, CDCl3): δ= 9.96 (s, 1H), 7.78-7.76 (d, J= 8.06 Hz, 2H), 7.34-7.32, J=
8.06 Hz, 2H), 2.44 (s, 3H) ppm; 13C NMR (125 MHz, CDCl3): 191.9, 145.5, 134.3, 129.8, 129.7, 21.8 ppm
MS (EI) m/z = 120, 119, 91, 65, 51
NMR data is in agreement with the published data.1
H
Me O
3-methylbenzaldehyde
1H NMR (500 MHz, CDCl3): δ= 9.99 (s, 1H), 7.69-7.67 (d, J= 8.98 Hz, 2H), 7.45-7.41 (m, 2H), 2.44 (s, 3H) ppm; 13C NMR (125 MHz, CDCl3): 192.5, 138.9, 136.6, 135.2, 129.9, 128.9, 127.2, 21.2 ppm
MS (EI) m/z = 120, 119, 91, 65, 63, 51
NMR data is in agreement with the published data.1
MeO
H O
4-methoxybenzaldehyde
1H NMR (500 MHz, CDCl3): δ= 9.87 (s, 1H), 7.83-7.81 (d, J= 8.60 Hz, 2H), 6.99-6.98 (d, J=
8.60 Hz, 2H), 3.87 (s, 3H) ppm; 13C NMR (125 MHz, CDCl3): 190.9, 164.6, 131.9, 130.1, 114.1, 55.4 ppm
MS (EI) m/z = 136, 135, 107, 92, 77, 63, 50
NMR data is in agreement with the published data.1
S14 H
OMe O
3-methoxybenzaldehyde
1H NMR (500 MHz, CDCl3): δ= 9.98 (s, 1H), 7.47-7.44 (m, 2H), 7.40-7.39 (m, 1H), 7.19- 7.17 (m, 1H), 3.87 (s, 3H) ppm; 13C NMR (125 MHz, CDCl3): 192.1, 160.2, 137.9, 130.1, 123.5, 121.5, 112.2, 55.5 ppm
MS (EI) m/z = 136, 135, 107, 92, 77, 65, 63
NMR data is in agreement with the published data.2
Br
H O
4-bromobenzaldehyde
1H NMR (500 MHz, CDCl3): δ= 9.90 (s, 1H), 7.69-7.66 (d, J= 8.52 Hz, 2H), 7.62-7.61 (d, J=
8.52 Hz, 2H) ppm; 13C NMR (125 MHz, CDCl3): 189.9, 134.2, 131.4, 130.6, 129.9 ppm MS (EI) m/z = 185, 154, 76, 75, 74, 51
NMR data is in agreement with the published data.1
H
Br O
3-bromobenzaldehyde
1H NMR (500 MHz, CDCl3): δ= 9.96 (s, 1H), 8.01-8.00 (m, 1H), 7.82-7.80 (d, J= 7.70 Hz, 1H), 7.77-7.75 (m, 1H), 7.44-7.41 (t, J=7.66, 1H) ppm; 13C NMR (125 MHz, CDCl3): 190.8, 138.2, 137.3, 132.4, 130.7, 128.4, 123.4 ppm
MS (EI) m/z = 185, 184, 182, 156, 154, 77, 75, 74, 51 NMR data is in agreement with the published data.2
H O
Br
2-bromobenzaldehyde
S15
1H NMR (500 MHz, CDCl3): δ= 10.36 (s, 1H), 7.92-7.89 (m, 1H), 7.65-7.63 (m, 1H), 7.46- 7.41 (m, 2H) ppm; 13C NMR (125 MHz, CDCl3): 191.7, 135.3, 133.9, 133.6, 129.9, 127.9, 127.1 ppm
MS (EI) m/z = 185, 184, 182, 156, 154, 77, 76, 51 NMR data is in agreement with the published data.2
O2N
H O
4-nitrobenzaldehyde
1H NMR (500 MHz, CDCl3): δ= 10.16 (s, 1H), 8.40-8.38 (d, J= 8.62, 2H), 8.08-8.06 (d, J=
8.62, 2H) ppm; 13C NMR (125 MHz, CDCl3): 190.3, 151.2, 140.1, 130.5, 124.3 ppm MS (EI) m/z = 151, 149, 120, 105, 93, 78, 77, 51
NMR data is in agreement with the published data.1
tBu
H O
4-tert-butylbenzaldehyde
1H NMR (500 MHz, CDCl3): δ= 9.88 (s, 1H), 7.72-7.71 (d, J= 8.42 Hz, 2H), 7.46-7.44 (d, J=
8.42 Hz, 2H), 1.26 (s, 9H) ppm; 13C NMR (125 MHz, CDCl3): 192.1, 158.4, 134.1, 129.6, 125.9, 35.3, 30.8 ppm
MS (EI) m/z = 162, 147, 119, 115, 103, 91, 77, 65, 51 NMR data is in agreement with the published data.1
O2N
Me
H O
3-methyl-4-nitrobenzaldehyde
1H NMR (500 MHz, CDCl3): δ= 10.08 (s, 1H), 8.05-8.04 (d, J= 8.15 Hz, 1 H), 7.86-7.84 (m, 2H), 2.66 (s, 3H) ppm; 13C NMR (125 MHz, CDCl3): 190.5, 138.5, 134.3, 133.8, 127.8, 125.3, 20.1 ppm
MS (EI) m/z = 165, 148, 120, 92, 91, 89, 77, 65, 63 NMR data is in agreement with the published data.3
S16 Collection of NMR spectra
Me
H O
S17 Me
H O
S18 H
Me O
S19 H
Me O
S20 MeO
H O
S21 MeO
H O
S22 H
OMe O
S23 H
OMe O
S24 Br
H O
S25 Br
H O
S26 H
Br O
S27 H
Br O
S28 H
O
Br
S29 H
O
Br
S30 O2N
H O
S31 O2N
H O
S32 tBu
H O
S33 tBu
H O
S34 O2N
Me
H O
S35 O2N
Me
H O
S36 References
[1] D. Wang, P. Wang, S. Wang, Y.-H. Chen, H. Zhang, A. Lei, Nat. Commun., 2019, 10, 2796
[2]P. Thiruvengetam, R. D. Chakravarthy, D. K. Chand, J. Catal., 2019, 376, 123-133.
[3] S. K. Chittimalla, T.-C. Chang, T.-C. Liu, H.-P. Hsieh, C.-C. Liao, Tetrahedron, 2008, 64, 2586-2595.


![arXiv:2111.09702v1 [math.CO] 18 Nov 2021](data:image/gif;base64,R0lGODlhAQABAIAAAP///wAAACH5BAEAAAAALAAAAAABAAEAAAICRAEAOw==)