Prediction of Surface Roughness Parametres by New Experimentally Validated Modelling
Algorithm under Abrasive Condition
István Barányi
1, Róbert Keresztes
2, Zoltán Szakál
2, Gábor Kalácska
21 Donát Bánki Faculty of Mechanical and Safety Engineering, Óbuda University, Népszínház u. 8, H-1081 Budapest, Hungary,
E-mail: baranyi.istvan@bgk.uni-obuda.hu
2 Faculty of Mechanical Engineering, Szent István University, Páter Károly u. 1, H-2100 Gödöllő, Hungary,
E-mail: keresztes.robert@gek.szie.hu, szakal.zoltan@gek.szie.hu, kalacska.gabor@gek.szie.hu
Abstract: In the initial stage of the abrasive wear process, the microtopography of steels drastically changes until it reaches a stable state. This stage can be described by the changes of the 3 dimensional roughness parameters. To predict these parameters, a simulation algorithm has been developed which was validated by wear tests. The applied load and the length of the wear path varied in wide interval during the experiments. The 1.1191 steel specimen was worn using an ISO 6344:1998 abrasive paper with a mesh size of 1200. It was found that both the experimental and the simulation results can be modelled in the same manner, meaning that we use a single function involving different parameters, which depends on the problem to be solved.
Keywords: algorithm; surface roughness measurement; wear; abrasion; steel; design of experiment
1 Intorduction
Continuously increasing industrial production demands call forth the tribological design of component surfaces. When providing technical specifications for contacting surfaces, attempts should be made early in the design phase to optimize friction losses of components and to properly define lubrication states during operation. Surface microtopography design – optimal development thereof – is one of the most dynamically developing areas of research from the tribology and manufacturing points of view [1].
Kubiak et al. [2] stated that the roughness parameter Ra of machined surfaces influenced wear intensity and the friction coefficient. In their measurements of tests involving high roughness values, they experienced decreasing friction coefficients and increasing wear, while in case of specimens of lower roughness, they experienced increasing friction coefficients and decreasing wear intensity.
Sedlacek et al. [3] examined the wear process of steel plates in case of various Ra values and manufacturing technology processes. In the course of tests, the relationship between parameters Rku, Rsk, Rpk, and Rvk, the friction coefficient, and wear was defined in case of dry and wet friction. Measurements verified the fact that roughness parameters exert an influence on the friction coefficient.
Sukumaran et al. [4] [5] emphasize the importance of online and offline measurements in their works, and they apply roughness measurements and a high- speed imaging system to describe the wear process.
Czifra et al. [6] and Palásti-Kovács et al. [7] searched for techniques to describe topography in their work in order to describe manufactured and abraded surfaces.
In addition to traditionally applied parameters, their work involves evaluations based on fractal, slicing algorithm, peak curvature, and steepness distribution and they examine the applicability of each technique.
Reizer et al. [8] develop a model based on topography measurements to describe wear on honed surfaces, then they certify their simulation results by a model experiment and propose a topography to be realized by the honing technique.
Based on the literature it can be stated that the phase of initial wear, to be characterized by changes in microtopography parameters applied in roughness measurements, is not fully elaborated in the literature. Therefore, a new special truncation algorithm has been developed to model the wear process, validated by measurement results. The model can be used for forecasting changes in roughness parameters Sa, Sq, Ssk, and Sku subject to given abrasion conditions until the total destruction of the microtopography produced.
2 Experimental
2.1 Truncation Algorithm
In case of microtopographies, the truncation algorithm can be used for examining the progressive destruction of the peak zone by roughness parameters. After reading in the machined surface, the algorithm developed by the first author (Figure 1) specifies the material volume to be removed for the total destruction of the microtopography.
Start
Input machined microtopography
Input increment Input worn
microtopography
Filtering with polynomial filter
Filtering with polynomial filter
Calculation of truncation height
Truncation
Complementation of the microtopography in a
truncation height
Filtering with polynomial filter
STOP Output roughness
parameters
Figure 1
The flowchart of the truncation algorithm
Then the simulation model determines the truncation heights. The truncation heights can be determined by two method (Figure 2):
according to linear scale,
according to Abbott – Firestone curve.
Using the second method is a truncation can be implemented where the removed material volume fractions are constant in each step.
Figure 2
The relationship between the truncation step and the truncation height in the case of linear and constant removed material ratio method
The points removed cause ruptures in the microtopography. These ruptures are substituted by plane or by fully destroyed microtopography points (Figure 3).
In the case of plane patching the results of the algorithm cannot be used perfectly, because the end of the running in stage wear process the Sa and Sq parameters tends to 0 micron, the Ssk parameter trends to minus infinity, and the Sku parameter trends to minus infinite value in the case of oriented microtopography.
Figure 3
Microtopography patching at a given height by plane and abrasion scratches
The “virtual” microtopography (which generated from measurement results, truncated by Abbott – Firestone curve and patched by abrasion scratches) was filtered by a first-degree polynomial in both directions, retaining both the waviness and roughness characteristics of the measurements.
Afterwards, the results of the algorithm were evaluated using the parameters Sa, Sq, Ssk, and Sku in function of the destroyed volume portion, using equations (1), (2), (3), and (4).
Mj N
i
) y , x ( MN z
Sa
1 1
1
(1)
∑∑
1 1
))
2, ( 1
M(
j N
i
y x MN z
Sq
(2)∑∑
M1 j
N
1 i
3 3
q
)) y , x ( z M NS (
Ssk 1
(3)∑∑
1 1
4
4
( ( , ))
1
Mj N
i q
y x MNS z
Sku
(4)2.2 Test Pieces and the Wear Experiment
During the tests – where the initial stage of wear was described from several aspects – 1.0503 steel test pieces (supplier: BÖHLER-UDDEHOLM Hungary Kft.) were used in normalized heat treatment state. A revolving knife technology (rpm: 400, feed 0.2 mm/revolution, flan ID: DCMT 070202-HMP, supplier:
Kolroy Inc.) was applied for surface machining. The average general roughness of
the manufactured surface was Sa=3.2 micrometers; the geometrical average of deviations was Sq=4 micrometers. The average values of skewness and kurtosis parameters to characterize the distribution of points in the direction of the vertical axis were Ssk=0.739 and Sku = 2.72, respectively.
Afterwards the tribology test specimens produced were destroyed in a pin-on-plate arrangement in the first step, at 150 mm length and 25 mm/s velocity, with a contact surface of 30 mmx30mm, subject to 600 N normal force, using an abrasion cloth of 1200 fineness (type: CK721X, procurement: Fk-Technika Kft.) perpendicularly to microtopography orientation. The end of the process was defined at 10,800 mm wear route length by the total destruction of roughness valleys located in the waviness valleys produced during manufacturing. In the second half of the experiments, the force compressing the surfaces was changed between 200 N and 600 N by 100N steps; the wear route length was increased by 600 mm steps up to 4800 mm, and then by 1200 mm steps to 10,800 mm, subject to 25 mm/s wear velocity.
The surface microtopography of test specimens was measured after each test using a Mahr stylus instrument for roughness measurement. A FRW750 instrument was applied for measurements, with a nose angle of 90°, and a rounding radius of 5 micrometers. Measurements were performed on a 1mm x 1mm surface, with a 2 micrometer step in each direction. The results yielded were taken into consideration without filtering in the course of further evaluation (Figure 4).
Figure 4
Surface microtopography in three different states: manufactured, abraded with a force of 200 N along 4800 mm, abraded with a force of 600 N along 10,800 mm
3 Results
3.1 Simulation Model Results
When using the simulation model, the microtopography was divided into 100 parts in the height direction where the volume of the material quantity removed was constant. Figure 5 shows changes in the parameters defined by the algorithm.
Figure 5
Changes in parameters Sa, Sq, Sku, and Ssk as a function of the volume portion destroyed
For the mathematical description of the results yielded, a modified logistic function (5) was used in the form below by white box method [9]:
e e b f ax cx d
1 (5)
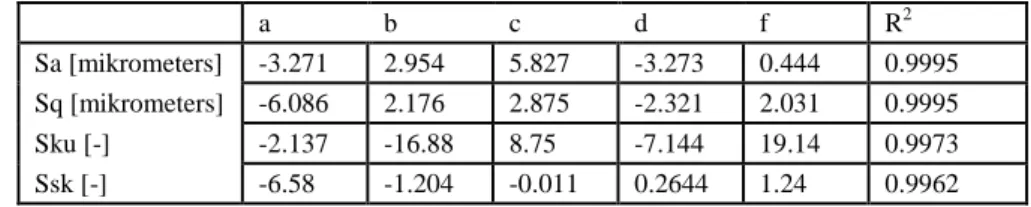
Table 1 summarizes the results of functional approximations and the value of variance.
Table 1
The coefficints of the logistic functions
a b c d f R2
Sa [mikrometers] -3.271 2.954 5.827 -3.273 0.444 0.9995 Sq [mikrometers] -6.086 2.176 2.875 -2.321 2.031 0.9995
Sku [-] -2.137 -16.88 8.75 -7.144 19.14 0.9973
Ssk [-] -6.58 -1.204 -0.011 0.2644 1.24 0.9962
3.2 Test Plan Results
A full factor test series was performed in order to validate results. Experiments were intended to answer the question whether the truncation algorithm represented a suitable approximation to the results yielded by model experiments. In order to compare results, the modified logistic function was extended into three dimensions in the following form:
e j ) g fy ( e
) b ax ) ( y , x (
f
(cy d) (hxi)
1
1
(7)The equation form was used in accordance with equation (8) for function approximation in respect of force, course, and roughness parameters:
const e
s g f
e F b a S
F i d h
s
c
1000
1000
1
1000 1
1000
(8) If the value of force (F) is substituted into the equation in [N], and course (s) in [mm], then the unit of measurement of roughness parameters depending on amplitude will be micrometers, and statistical parameters will be dimensionless.
The constant value of equation (8) defines the displacement in the direction of the vertical axis applied in function approximation, its value equals to the value of totally destroyed microtopography.
The function approximation of measurement results is shown in Figure 6 and the calculated coefficients summarized in Table 2.
Figure 6
Changes in parameters Sa, Sq, Sku, and Ssk as a function of normal force and wear route length
Table 2
Logistic function coefficients specified from the test plan
a b c d f
Sa [mikrometers] 7.375 2.601 0.6106 0.3725 0.03795 Sq [mikrometers] 72.5 31.81 0.5326 3.044 0.06937 Ssk [-] -19.42 -3.657 0.3096 -4.58 -0.7837
Sku [-] -6.063 -0.0491 -3.14 1.418 1.286
g h i const R2
Sa [mikrometers] 2.875 10.02 -1.516 0.4294 0.9397 Sq [mikrometers] 3.524 10.01 -1.224 0.5928 0.9465
Ssk [-] 27.58 -2.853 1.359 -0.715 0.852
Sku [-] 0.8471 -10.8 4.791 2.7376 0.9398
Conclusions
Using the algorithm developed, a simulation model was developed where – by defining the relationship between slicing height and roughness parameters – the impact of abrasion scratches in the peak zone can also be taken into consideration.
A modified logistic function was used to define the connection of amplitude- dependent roughness parameters with the normal force and the wear route length, under given measurement conditions. Within the abrasion wear model system, the coefficients of the 9-parameter function were determined for roughness index numbers Sa, Sq, Ssk, and Sku in accordance with the full factor test plan.
Based on the results yielded by the algorithm and measurements, respectively, it can be stated that the physical process occurs in accordance with a function of identical shape.
References
[1] Bruzzone, A. A. G., Costa, H. L., Lonardo, P. M. and Lucca, D. A.:
Advances in Engineered Surfaces for Functional Performance, CIRP Annals – Manufacturing Technololgy 57, 2008, pp. 750-769
[2] Kubiak, K. J., Liskiewicz, T. W. and Mathia, T. G.: Surface Morphology in Engineering Applications: Influence of Roughness on Sliding and Wear in Dry Fretting, Tribology International. 44, 2011, pp. 1427-1432
[3] Sedlaček, M., Podgornik, B. and Vižintin, J.: Influence of Surface Preparation on Roughness Parameters, Friction and Wear, Wear 266, 2009, pp. 482-487
[4] J. Sukumaran, M. Ando, P. De Baets, V. Rodriguez, L. Szabadi, G.
Kalacska, V. Paepegem: Modelling Gear Contact with Twin-Disc Setup, Tribology International. 49, 2012, pp. 1-7
[5] J. Sukumaran, S. Soleimani, P. De Baets, V. Rodriguez, K. Douterloigne, W. Philips, M. Ando: High-Speed Imaging for Online Micrographs of Polymer Composites in Tribological Investigation, Wear 296, 2012, pp.
702-712
[6] Czifra, Á., Goda, T. & Garbayo, E.: Surface Characterisation by Parameter- based Technique, Slicing Method and PSD Analysis, Measurement 44, 2011, pp. 906-916
[7] Palásti-Kovács, B., Néder, Z., Czifra, Á., Váradi, K.: Microtopography Changes in Wear Process, Acta Polytechnica Hungarica 1, 2004, pp. 108- 119
[8] Reizer, R., Pawlus, P., Galda, L., Grabon, W. & Dzierwa, A.: Modeling of Worn Surface Topography Formed in a Low Wear Process, Wear 278-279, 2012, pp. 94-100
[9] Pokorádi L: Introduction to Mathematichal Diagnostics I.: Theoretical Background, Debreceni Műszaki Közlemények VI: (1), 2007, pp. 65-80