A New Model for Fine Turning Forces
Richárd Horváth
Óbuda University, Donát Bánki Faculty of Mechanical and Safety Engineering, Népszínház u. 8, H-1081 Budapest, Hungary; horvath.richard@bgk.uni-obuda.hu
Abstract: Forces during turning depend not only on material properties and cutting parameters but to a great extent on the edge geometry of the tool as well, which determines chip shape (thickness and width). In fine turning it is almost exclusively the nose radius of the tool that does the cutting. The study reviews the main directions and results of researches in recent years concerning cutting force. It also presents the technology of fine cutting. Due to geometric considerations, chip characteristics are used that allow an exact description of cutting on nose radius as a function of the cutting parameters used. Dynamic tests are performed on two aluminium casting alloys and a mathematical model is constructed specifically for fine turning, using which expected forces can be estimated quite precisely during technological process planning.
Keywords: fine turning; force measuring; force model; regression; Kienzle model Abbreviations
A – chip cross section, mm2 ap – depth of cut, mm
AS12 – die-cast eutectic aluminium alloy AS17 – die-cast hypereutectic aluminium alloy b – chip width, mm
C, q, y, – constants of the regression equation ɛr – nose angle, ˚
f – feed, mm
Fc – main (tangential) force, N Ff – feed (axial) force, N Fp – passive (radial) force, N h – chip thickness, mm HB – Brinell hardness
heq – equivalent chip thickness, mm HRC – Rockwell hardness HV – Vickers hardness k –specific cutting force, N/mm2
k1,0.1 –constant value of main specific cutting force in new model, N/mm2 (where heq=0.1 mm and leff=1 mm)
k1.1 – constant value of main specific cutting force in the Kienzle model, N/mm2 (where b=1 mm and h=1 mm)
leff – the cutting length of the edge of the tool, mm rɛ - nose radius, mm
vc – cutting speed, m/min κr – side cutting edge angle
1 Introduction
The examination of the dynamic behaviour of cutting processes can be performed with two methods: models can be deduced from mathematical calculations and empirical models. An early example of the former is the work of Merchant [1], whose dynamic model for orthogonal cutting is still part of research projects nowadays. In the past decades new materials, technologies and tools have appeared and so it has become an especially important research area. Many researchers have studied the machinability of various materials in recent years.
Suresh et al. [2] investigated the dynamic characteristics of AISI 4340 steel in turning operations with chemical vapor deposition (CVD) coated (TiC/TiCN/Al2O3) hard metal tool. Based on their results they obtained linear equations for the calculation of the resultant cutting force and the specific cutting force. They also concluded that cutting force and specific cutting force are most influenced by feed, less influenced by depth of cut, while they were least affected by cutting speed. Rao et al. [3] investigated the turning of AISI 1050 tempered steel – carbon steel (hardness: 484 HV) with a ceramic insert (Al2O3+TiC; - KY1615 -). They described the main effects with empirical formulae, performed a significance test of the parameters set for the cutting force, and made statements about the optimum. Szalóki et al. [4] investigated the cutting forces and surface roughness created in case of trochoidal milling. Their examinations were carried out using 40CrMnMo7 (1.2391) steel with a monolith cemented carbide HPC shank milling cutter. In their research they used design of experiment (DOE) and as a result an empirical equation depending on cutting parameters was set up to estimate cutting force components and maximum height of roughness profile Rz.
Tállai et al. [5] tested thread formers with 5 different types of coatings on 40CrMnMo7. In their work they studied torque and wear of thread formers depending on formed length and compared the flood type and the minimal quantity lubrication (MQL). It is stated, that the increase of forming speed drastically decreases the number of machinable holes and wear condition of the forming tools can be followed by the torque measurement very well. The value of forming torque may be by 19 percent lower in case of MQL, compared to the flood type of lubrication.
In the past few years numerous researchers have studied the dynamic characteristics of hard turning. Aouici et al. [6], for example, turned AISI H11 steels of various hardness (40, 45 and 50 HRC) with a polycrystalline cubic boron nitride (CBN) tool. To calculate the individual force components, they used a quadratic equation, which contained the HRC hardness of the workpiece in addition to the usual data (vc – cutting speed, f – feed, ap – depth of cut). Their study also shows that cutting speed had the least effect on the force components.
Lavlani et al. [7] also performed hard turning. In their study they turned MDN250 material (corresponding to 18Ni(250) maraging steel) with a coated ceramic tool (TNMA 160408S01525 - CC6050). They constructed a linear model for the three
measured force components, then they also stated that cutting force was mostly affected by feed and depth of cut, while cutting speed did not influence it significantly. Bouacha et al. [8] hard turned AISI 52100 bearing steel (64 HRC) with a CBN tool. They created second order phenomenological models for the estimation of the individual force components. Gaitonde et al. [9] studied the machinability of AISI D2 cold work tool steel. They performed their experiments with conventional and Wiper geometry ceramic tools (CC650, CC650WG and GC6050WH). They only considered depth of cut and time spent cutting in their investigation. They concluded that in the case of Wiper geometry tools cutting force increased linearly as depth of cut was increased. On the other hand, cutting force in the case of a conventional geometry tools increased up to a concrete value of depth of cut of ap=0.45 mm, then started to decrease above this. Kundrák et al.
[10] examined the microhardness of hard turned surfaces. They concluded that although according to the literature, cutting force does not have a direct effect on the hardness of the surface, indirectly it still has an effect because of the thermal energy, that the mechanical energy transfers into. Since the kinematics, geometry and technological parameters of hard turning often differ from those of conventional longitudinal turning, to determine cutting force with experimental formulae, further studies are necessary. Sztankovics et al. [11, 12], for example, presented how parameters characteristic of chip cross-section can be determined in the case of rotational turning.
In order to understand the behaviour and dynamic characteristics of the material during machining, in the case of the HSC (high speed cutting) technology, Pawade et al. [13] made experiments with softened Inconel 718 steel. They presented an analytical model, which predicts specific shear energy in the shear zone. They found that shear distances increase linearly as feed increases. Their model fitted their measurement results excellently.
In recent years more and more non-ferrous and non-metallic materials have been used in industry. Studying these has also got to the forefront. The Waldorf model [14, 15] of microcutting applies to the smallest chip thicknesses, because the undeformed (theoretical) chip thickness is less than 50 μm and is comparable to the edge radius of the tool. Annoni et al. [16] examined the machinability of C38500 (CuZn39Pb3) brass (hardness 81,5 HRB) with a hard metal tool (DCGX 070202–ALH10). In the range of microcutting they successfully changed the formulae for the calculation of cutting force and feed force because according to their results, the modified model better fits the values obtained during microcutting. Gaitonde et al. [17] also examined the machinability of copper alloy (CuZn39Pb3) (66 HRB). They performed their experiments with minimal quantity lubrication (MQL) with a hard metal tool of material K10 (TCGX 16 T3 08-Al H10). They varied cutting speed, feed and the amount of minimal lubrication (ml/h), while depth of cut was kept at a constant 2 mm value. They found that there is a considerable interrelationship between the amount of the lubricant and cutting speed. Machinability is very sensitive to the change of feed, irrespective of
the amount of the lubricant. They determined optimal cutting conditions, where specific cutting force (and average surface roughness, Ra) were minimal. Zebala and Kowalczyk [18] examined WC-Co material with a Mitsubishi triangular PCD tool (TNGA 160408). The cobalt content in the workpieces was 10, 15, and 25 wt%. Their research plan was based on the L9 Taguchi method. Two empirical models were developed for the main cutting force (Fc). The first model was based on the power function; the second was based on the polynomial function according to modified RSM equations. When they compared the WC-Co with two different materials (Co contents 15 and 25 wt%), in terms of cutting force Fc, they found that there was no clear effect of Co content on the turning process. The lowest Fc values were obtained for the same cutting data. When they machined material with less Co content, higher Fc values for the same cutting data were generated. The analysis showed that depth of cut and cutting speed had the biggest influence on the Fc parameter.
Intensive research is also going on in the field of reinforced plastics and plastic- based composites. Hanafi et al. studied the turning of polyether ether ketone (PEEK) CF30 material with a TiN coated tool (WNMG 080408-TF) in dry conditions. They measured the three components of the force and determined the resultant force and specific cutting force with calculations. Empirical models were worked out depending on cutting data to predict both calculated forces. They tested the results with both response surface methodology (RSM) and Fuzzy algorithm, then compared the applicability of the two methods [19]. Fetecau and Stan [20] turned two kinds of polytetrafluoroethylene (PTFE) based composite materials: PTFE CG 32-3, containing 32% carbon and 3% graphite, and PTFE GR 15, containing 15% reformed graphite. They varied the cutting parameters (vc, f, ap) and used three polycrystalline diamond (PCD) tools of different nose radii.
They found that feed and depth of cut had the greatest effect on cutting force, while the main component of cutting force was nearly constant as a function of cutting speed and the nose radius of the insert. An empirical equation was provided for both materials examined. The equations only contain the main parameters (feed, depth of cut).
The use of light metals is also becoming more and more widespread. De Agustina et al. [21] examined the dry turning of an aluminium alloy (UNS A97075). They used two tools of different nose radii (DCMT11T304-F2, DCMT11T308-F2) and measured the cutting force components, then compared the dynamic behaviour of the two tools. They found that at low feed the two tools of different radii required quite similar force. Joardar et al. [22] dry turned aluminium composites reinforced with SiC (LM6), using a polycrystalline diamond (PCD) tool. They constructed a second order model to estimate cutting force which also included Si content as input parameter in addition to cutting speed.
The author and his colleagues have already published articles on the machinability of die-cast aluminium parts, widely used in industry. They have examined in detail the surface roughness using different edge material and edge geometry.
They built phenomenological models to estimate surface roughness parameters and determined the optimum cutting conditions [23, 24, 25, 26]. They examined the changing of the statistical parameters of surface roughness separately as a function of cutting parameters, the machined materials, tool edge material and tool geometry [27]. This paper presents a new force model – describing the conditions of fine turning – by which, the main cutting force (Fc) can be calculated easily and accurately.
2 Materials and Methods
After iron and steel, aluminium and its alloys are used most widely in industry and they are only getting more and more popular. Due to their many advantages over pure aluminium, die-cast aluminium alloys (alloys of silicon, copper and magnesium) are widely used. Based on an experimental approach this paper analyses the dynamic conditions of fine turning of two generally used aluminium casting alloys.
2.1 Materials Used
Two aluminium casting alloys, used in great quantities in industry, have been selected. These alloys combine outstanding mechanical properties with technological advantages. The greatest advantage of the AS12 eutectic alloy is its excellent castability, while the AS17 hypereutectic alloy is harder than AS12 and more wear resistant.
The composition of the AS12 eutectic alloy is (wt %): Al=88.54%; Si=11.46%, while its hardness is 67±2 HB2.5/62.5/30.
The composition of the AS17 hypereutectic alloy is (wt %): Al=74.35%;
Si=20.03%, Cu=4.57%; Fe=1.06%. Its hardness is 114±3 HB2.5/62.5/30.
The size of the workpiece used for the turning experiment was Ø110 × 40 mm.
2.2 Tools and Machine Tool Used
In their research so far the author and his colleagues have determined the optimum cutting conditions by insering into their model not only the usual cutting parameters but the edge material and edge geometry as well [23, 24, 25]. The tool used for the dynamic test was the following: polycrystalline diamond (PCD), insert code: DCGW 11T304, edge geometry: ISO, manufacturer: TiroTool. The machine tool used was an EuroTurn 12B CNC lathe, with a spindle power of 7 kW and a maximum spindle RPM of 6000 1/min.
2.3 Cutting Force Measurement
Due to the conditions of chip removal and the low hardness of the materials, cutting forces are expected to be relatively small. The author developed and adapted a dynamometer system, the exploded view of which can be seen in Fig. 1.
The sensitivity of the dynamometer was evaluated (pC/N), and its error curve was determined in the range from 0 N to 100 N. The dynamometer was connected to a KISTLER 5019 amplifier. Force data was evaluated with the DynoWare software.
The cutting experiments were performed with a tool holder specially modified for measurement of small forces.
Figure 1
Exploded view of dynamometer system
2.4 The New Force Model Adapted to the Technology of Fine Turning
The Kienzle-Victor model [28] is still an excellent model widely used for the calculation of the components of cutting force. Specific cutting force (k) was introduced and determined by series of measurement, whose value depends on chip dimensions (theoretical undeformed chip width – b and chip thickness – h).
In the case of a large chip cross-section (Figure 2), the side cutting angle of the tool (κr) provides a relationship between chip dimensions (b and h) and depth of cut (ap) and feed (f) as cutting parameters. See Eqs. (1) and (2).
Figure 2
Chip cross-section for the Kienzle-Victor dynamic model
f r
h sin (1)
r
b a
sin (2)
The main value of specific cutting force (k1.1) and the exponent of chip thickness (q) were determined experimentally. The main value of the specific cutting force mostly depends on the material and state of the workpiece and is true for chip dimensions b=1 mm and h=1 mm. The exponent also depends on the material but it is also influenced by cutting conditions. Thus the components of the cutting force can be calculated with the following general equation:
b h k
F
1.1
1q
(3)It has to be noted that the formula can only be used with correction coefficients in any case when real conditions differ from the experimental conditions (tool material, nose angle, wear, etc.)
The Kienzle-Victor method can be used well in the range of rough turning data, when depth of cut (ap) is considerably larger than the nose radius of the tool (rɛ).
Under fine turning conditions a smaller part of the side cutting edge and the whole of the nose radius takes part in chip removal. Therefore here chip geometry data h and b used by Kienzle and Victor are meaningless (Figure 2). It follows from this that characteristic k1.1 cannot be used in the case of fine turning, either. That is why two novel chip characteristics were introduced (heq – equivalent chip thickness; leff – the cutting length of the edge of the tool) (Figure 3), which can describe chip geometry in fine turning accurately.
Figure 3
Characteristic chip cross-section in fine turning
The cutting parameters set, the side cutting edge angle (κr), and the nose radius of the tool (rε) mostly determine the cutting length of the edge of the tool (leff). Based on this concept chip cross-section can be given as follows:
eff eq
p f h b h l
a
A (4)
In fine turning effective edge length can be calculated with the formula [29, 30], which depends on ap, f, κr (is given in radian), rε:
arcsin2 sin
cos 1
r r f
r
l a r
r r p
eff
(5)
The equivalent chip thickness can be calculated from cutting parameters and effective edge length with the following formula:
eff p
eq l
f
h a
(6)
In fine turning heq<<1 mm is always true so k1.1 cannot be used. Therefore it is worth introducing a method of calculation that describes chip geometry better.
This is the main value of the specific cutting force in fine turning, k1,0.1. It refers to leff = 1 mm and heq = 0.1 mm.
The newly introduced cutting force model requires the calculation of specific cutting force (determined with a dynamometer), which can be written as follows:
eff eq l h
F A k F
(7)
The obtained k values depend on heq and leff; therefore it is worth modelling them with a two-factor power function regression as below:
y eff q
eq
l
h C
k
(8)In Eq. (8) the fitting parameter C is a positive number, q and y are an empirically estimated exponents.
If the substitution heq=0.1 mm is used, the value of k1,0.1 is the following:
C q
k1,0.1 0,1 (9)
And the resulting general cutting force model is:
y eff q eq q eff
eq l k h l
h k
F 1,0.110 1 1 (10)
2.5 Design of Experiments
The experiments used in this paper embraces the technological spectrum of fine turning (f=0.03–0.15 mm; ap=0.25–0.7 mm). In the experiments cutting was performed at depth of cut ap=0.25 mm where ap<rɛ, while at the highest value a small section of the side cutting edge also takes part in chip removal.
Researchers so far have reported that cutting speed has a negligible effect on cutting force [6,7,20], therefore speed is kept high as in industrial conditions but constant (vc=1000 m/min).
In the experiments it is reasonable to calculate the chip cross-section where leff =1 mm and heq=0.1 mm, and determine the f and ap values to be set in order to achieve it. Using equations (5) and (6):
) ( 4 . 0 arcsin2 60 ) 31 ( 4 . 0 60
sin31
60 cos31 1 ) ( 4 . 0 ) (
1
mm
mm f mm
a mm l
p eff
(11)
) ( ) 1 ( 1 .
0 mm
f mm a
heq p
(12)
Equations (10) and (11) yield the following pairs of solutions:
ap=0.699415 mm; f=0.142976 mm and ap=0.125135 mm; f=0.799133 mm. It is easy to see that this requirement is fullfilled for f=0.143 mm and ap=0,7 mm.
Table 1 shows the experimental settings for both materials. The set of experiments was made so that measurement point 22 is to determine (check) k1,0.1.
Table 1 Experiment points
Measurement point ap, mm f, mm leff, mm heq, mm A, mm2 1. 0.25 0.03 0.493 0.015 0.0075 2. 0.25 0.05 0.503 0.025 0.0125 3. 0.25 0.07 0.513 0.034 0.0175 4. 0.25 0.09 0.523 0.043 0.0225 5. 0.25 0.11 0.533 0.052 0.0275
Measurement point ap, mm f, mm leff, mm heq, mm A, mm2 6. 0.25 0.13 0.543 0.060 0.0325 7. 0.25 0.15 0.554 0.068 0.0375
8. 0.5 0.03 0.743 0.020 0.015
9. 0.5 0.05 0.753 0.033 0.025
10. 0.5 0.07 0.763 0.046 0.035 11. 0.5 0.09 0.774 0.058 0.045 12. 0.5 0.11 0.784 0.070 0.055 13. 0.5 0.13 0.794 0.082 0.065 14. 0.5 0.15 0.804 0.093 0.075 15. 0.7 0.03 0.944 0.022 0.021 16. 0.7 0.05 0.954 0.037 0.035 17. 0.7 0.07 0.964 0.051 0.049 18. 0.7 0.09 0.974 0.065 0.063 19. 0.7 0.11 0.984 0.078 0.077 20. 0.7 0.13 0.994 0.092 0.091
(k1,0.1) 21. 0.7 0.143 1.001 0.100 0.1001
22. 0.7 0.15 1.004 0.105 0.105
3 Results
3.1 Results of Main Force (F
c) Measurements
The experiments were repeated twice (the arrangement of force measurement can be seen in Figure 4).
Figure 4
The layout of force measurement
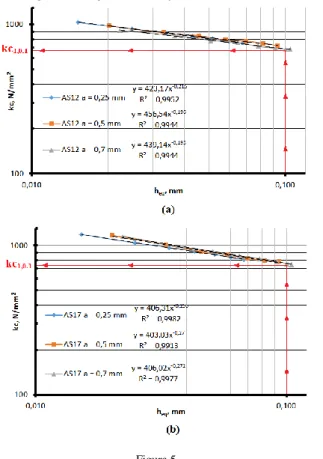
Figure 5 shows specific cutting force as a function of equivalent chip thickness. It can be seen that in fine turning, too, the values of measurement points are on a straight line if the diagram is logarithmically scaled.
Figure 5
Specific cutting force as a function of equivalent chip thickness a) in the case of AS12; b) in the case of AS17
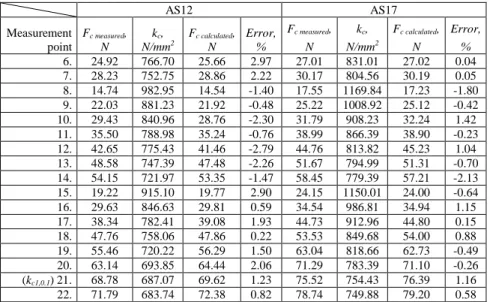
Table 2 shows the averages of these Fc values, and the values predicted by the model (chapter 3.2.) and their relative deviation in %.
Table 2
Main cutting force values of AS12 and AS17 materials
AS12 AS17
Measurement point
Fc measured, N
kc, N/mm2
Fc calculated, N
Error,
%
Fc measured, N
kc, N/mm2
Fc calculated, N
Error,
% 1. 7.77 1036.66 7.82 0.53 8.89 1185.26 8.97 0.91 2. 11.73 938.24 11.80 0.61 12.99 1039.00 13.11 0.92 3. 15.40 880.17 15.49 0.59 16.94 968.23 16.86 -0.47 4. 18.95 842.36 19.00 0.26 20.54 912.77 20.39 -0.71 5. 22.18 806.66 22.38 0.89 24.05 874.49 23.76 -1.19
AS12 AS17 Measurement
point
Fc measured, N
kc, N/mm2
Fc calculated, N
Error,
%
Fc measured, N
kc, N/mm2
Fc calculated, N
Error,
% 6. 24.92 766.70 25.66 2.97 27.01 831.01 27.02 0.04 7. 28.23 752.75 28.86 2.22 30.17 804.56 30.19 0.05 8. 14.74 982.95 14.54 -1.40 17.55 1169.84 17.23 -1.80 9. 22.03 881.23 21.92 -0.48 25.22 1008.92 25.12 -0.42 10. 29.43 840.96 28.76 -2.30 31.79 908.23 32.24 1.42 11. 35.50 788.98 35.24 -0.76 38.99 866.39 38.90 -0.23 12. 42.65 775.43 41.46 -2.79 44.76 813.82 45.23 1.04 13. 48.58 747.39 47.48 -2.26 51.67 794.99 51.31 -0.70 14. 54.15 721.97 53.35 -1.47 58.45 779.39 57.21 -2.13 15. 19.22 915.10 19.77 2.90 24.15 1150.01 24.00 -0.64 16. 29.63 846.63 29.81 0.59 34.54 986.81 34.94 1.15 17. 38.34 782.41 39.08 1.93 44.73 912.96 44.80 0.15 18. 47.76 758.06 47.86 0.22 53.53 849.68 54.00 0.88 19. 55.46 720.22 56.29 1.50 63.04 818.66 62.73 -0.49 20. 63.14 693.85 64.44 2.06 71.29 783.39 71.10 -0.26
(kc1,0.1) 21. 68.78 687.07 69.62 1.23 75.52 754.43 76.39 1.16
22. 71.79 683.74 72.38 0.82 78.74 749.88 79.20 0.58 It can be seen from the Table 2 that the cutting force requirement of the AS17 aluminium alloy is greater than that of the AS12 alloy. This can be attributed to the differences in hardness, and the hard primary silicon grains forming in the AS17 hypereutectic alloy.
3.2 Model for Main Force (F
c)
Figure 6 a) and b) displays the specific cutting forces in a logarithmically scaled diagram as a function of equivalent chip thickness. It can be seen that the set of all the measurement points fit a straight line quite well. In Figure 6 c) and d) all measurements points are handled together. But specific cutting force is studied as a function of chip cross-section. It can be seen that the scatter of the values of kc is great for both materials. It can be stated that specific cutting force depends far more significantly on the heq parameter introduced in the force model. This also explains the importance of heq.
Figure 6
Specific cutting force as a function of equivalent chip thickness and chip cross-section According to eq. (8) the equations of specific cutting force (depending on equivalent chip thickness and the cutting length) for the two materials are the following:
039 , 0 198 , 0 12
_AS
439
eq
effc
h l
k
(13)088 , 0 272 , 0 17
_AS
408
eq
effc
h l
k
(14)Equations (13, 14) yield that kc1,0.1_AS12=692 N/mm2 and kc1,0.1_AS17=762 N/mm2. After transformations based on Eqs. (7-10) we get the following equations for cutting force [31]:
961 , 0 8 , 198 0 , 0 12
_AS 692 10 eq eff
c h l
F (15)
089 , 1 728 , 272 0 , 0 17
_AS 762 10 eq eff
c h l
F (16)
3.3 Checking the Equations of F
cThe equations were checked by plotting and comparing the calculated and estimated cutting force values (Table 2) against the measured values. The deviation of calculated values from measured values in the case of AS12 is between -2.79% and 2.97%. In the case of AS17, deviation is between -2.13% and 1.42 %. The deviation of the plotted points from the x = y line shows the good usability of the equations. The Figure 7 shows for both materials that the equations (eqs. 15, 16) approximate the measured values quite well.
Figure 7
A comparison of measured and calculated roughness values in the case of (a) AS12 and (b) AS17
3.4 Models for the Feed Force (F
f) and Radial Force (F
p)
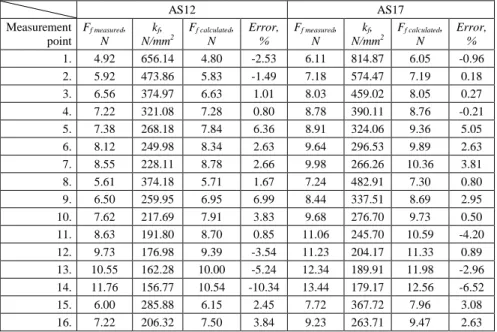
Table 3 and 4 show the averages of measured Ff and Fp values and the values predicted by the model (Table 5) and their relative deviation in%.
Table 3
Feed force values of AS12 and AS17 materials
AS12 AS17
Measurement point
Ff measured, N
kf, N/mm2
Ff calculated, N
Error,
%
Ff measured, N
kf, N/mm2
Ff calculated, N
Error,
% 1. 4.92 656.14 4.80 -2.53 6.11 814.87 6.05 -0.96 2. 5.92 473.86 5.83 -1.49 7.18 574.47 7.19 0.18
3. 6.56 374.97 6.63 1.01 8.03 459.02 8.05 0.27
4. 7.22 321.08 7.28 0.80 8.78 390.11 8.76 -0.21
5. 7.38 268.18 7.84 6.36 8.91 324.06 9.36 5.05
6. 8.12 249.98 8.34 2.63 9.64 296.53 9.89 2.63
7. 8.55 228.11 8.78 2.66 9.98 266.26 10.36 3.81
8. 5.61 374.18 5.71 1.67 7.24 482.91 7.30 0.80
9. 6.50 259.95 6.95 6.99 8.44 337.51 8.69 2.95
10. 7.62 217.69 7.91 3.83 9.68 276.70 9.73 0.50
11. 8.63 191.80 8.70 0.85 11.06 245.70 10.59 -4.20 12. 9.73 176.98 9.39 -3.54 11.23 204.17 11.33 0.89 13. 10.55 162.28 10.00 -5.24 12.34 189.91 11.98 -2.96 14. 11.76 156.77 10.54 -10.34 13.44 179.17 12.56 -6.52
15. 6.00 285.88 6.15 2.45 7.72 367.72 7.96 3.08
16. 7.22 206.32 7.50 3.84 9.23 263.71 9.47 2.63
AS12 AS17 Measurement
point
Ff measured, N
kf, N/mm2
Ff calculated, N
Error,
%
Ff measured, N
kf, N/mm2
Ff calculated, N
Error,
% 17. 8.61 175.63 8.54 -0.80 10.53 214.97 10.62 0.80 18. 9.91 157.23 9.40 -5.10 12.02 190.75 11.56 -3.81 19. 10.92 141.85 10.15 -7.10 12.52 162.63 12.37 -1.24 20. 11.82 129.89 10.81 -8.56 13.66 150.16 13.08 -4.28
(kf1,0.1) 21. 12.97 129.52 11.20 -13.59 14.74 147.22 13.50 -8.36
22. 13.46 128.16 11.41 -15.24 14.79 140.90 13.72 -7.25 Table 4
Radial cutting force values of AS12 and AS17 materials
AS12 AS17
Measurement point
Fp measured, N
kp, N/mm2
Fp calculated, N
Error,
%
Fp measured, N
kp, N/mm2
Fp calculated, N
Error,
% 1. 4.01 534.44 3.87 -3.35 5.05 673.58 5.12 1.30 2. 4.88 390.77 4.71 -3.56 6.07 486.00 5.95 -2.06 3. 5.43 310.02 5.40 -0.53 6.73 384.66 6.62 -1.63 4. 5.65 251.29 6.00 6.18 7.39 328.22 7.21 -2.34 5. 5.76 209.52 6.56 13.90 6.83 248.37 7.75 13.53 6. 6.04 185.96 7.09 17.31 7.30 224.71 8.27 13.18 7. 6.41 170.83 7.60 18.56 7.49 199.86 8.76 16.82 8. 7.94 529.18 7.67 -3.36 10.50 700.13 9.91 -5.59 9. 9.39 375.68 9.26 -1.40 12.04 481.48 11.43 -5.00 10. 10.80 308.43 10.53 -2.42 13.50 385.83 12.63 -6.49 11. 12.07 268.14 11.64 -3.55 14.44 320.96 13.65 -5.49 12. 13.08 237.88 12.64 -3.41 14.61 265.72 14.57 -0.30 13. 14.33 220.47 13.56 -5.35 15.72 241.86 15.42 -1.91 14. 15.51 206.74 14.44 -6.88 16.64 221.81 16.22 -2.49 15. 10.42 496.14 11.16 7.07 13.39 637.69 14.32 6.95 16. 12.97 370.46 13.42 3.54 15.94 455.46 16.46 3.27 17. 15.15 309.14 15.22 0.50 18.27 372.79 18.12 -0.80 18. 17.54 278.36 16.77 -4.37 20.33 322.67 19.53 -3.95 19. 18.42 239.20 18.16 -1.42 20.55 266.93 20.77 1.08 20. 20.01 219.84 19.43 -2.85 21.86 240.24 21.92 0.26
(kp1,0.1) 21. 21.37 213.50 20.22 -5.39 22.76 227.35 22.62 -0.60
22. 22.19 211.38 20.63 -7.05 23.32 222.06 22.99 -1.41 The Ff and Fp force components can be estimated similarly to Fc by the new force model, which was introduced in chapter 2.4. The deviation of calculated values from measured values in the case of Ff :
- AS12 material: between -15.24% and 6.99%. In the case of AS17, deviation is between -8.36% and 3.81%.
In the case of Fp:
- AS12 material: between -7.05% and 18.56%. In the case of AS17, deviation is between -6.49% and 16.82%.
Although the deviations of Ff and Fp (force) components are higher than in case of Fc, those accuracies meet the requirements of technological process planning.
The constants of the general equation (10) for calculating Ff and Fp are shown in Table 5.
Table 5
Constants of equations for Ff and Fp
constants of the equation of passive (radial) force,
Fp, N
constants of the equation of feed force, Ff, N
k1,0.1 q y k1,0.1 q y
AS12 112 -0.393 0.153 202 0.340 1.430 AS17 135 -0.343 0.221 226 0.248 1.440 Conclusion
In this paper the forces of cutting on a widely used eutectic and a hyper-eutectic aluminium alloy with a diamond tool were examined. A new force model was introduced for the technology of fine turning, by which the main values of cutting forces can be estimated with ease and great accuracy. The following conclusions can be drawn about the new model and the test results:
- the model does not differ significantly from the widely used Kienzle-Victor formula, but operates with chip characteristic of fine turning;
- the specific cutting force formula (8) estimates specific cutting force well for both materials examined;
- the main value of the specific cutting force introduced in the novel model in case of fine turning (k1,0.1, N/mm2, where leff = 1 mm and heq = 0.1 mm);
- the main values of the specific cutting forces for the fine turning of aluminium alloys can be calculated easily with formula (9). (In the case of AS12: kc1,0.1= 692 N/mm2; kf1,0.1=112 N/mm2; kp1,0.1=202 N/mm2. In the case of AS17: kc1,0.1= 762 N/mm2 kf1,0.1= 135 N/mm2 kp1,0.1=226 N/mm2);
- it was verified that specific cutting force mainly depends on the equivalent chip thickness;
- From the test results it can be concluded that the equation of cutting force (10) predicts the measured force components (Fc, Ff, Fp) with great accuracy.
Acknowledgement
The author wishes to thank his colleague, Sándor Sipos, for his valuable advices and comments.
References
[1] Merchant ME.: Basic Mechanics of the Metal Cutting Process, Journal of Applied Mechanics (1944) 68-75
[2] R. Suresh, S. Basavarajappa, G. L. Samuel: Some Studies on Hard Turning of AISI 4340 Steel Using Multilayer Coated Carbide Tool, Measurement 45 (2012) 1872-1884
[3] C. J. Rao , D. Nageswara Rao, P. Srihari: Influence of Cutting Parameters on Cutting Force and Surface Finish in Turning Operation, Procedia Engineering 64 (2013) 1405-1415
[4] I. Szalóki, S. Csuka, S. Sipos: "New Test Results in Cycloid-Forming Trochoidal Milling." Acta Polytechnica Hungarica 11:(2) (2014) 215-228 [5] P. Tállai, S. Csuka, S. Sipos: Thread Forming Tools with Optimised
Coatings, Acta Polytechnica Hungarica 12:(1) (2015) 55-66
[6] H. Aouici, M. A. Yallese, K. Chaoui, T. Mabrouki, J.-F. Rigal: Analysis of Surface Roughness and Cutting Force Components in Hard Turning with CBN Tool: Prediction Model and Cutting Conditions Optimization, Measurement 45 (2012) 344-353
[7] D. I. Lalwani, N. K. Mehta, P. K. Jain: Experimental Investigations of Cutting Parameters Influence on Cutting Forces and Surface Roughness in Finish Hard Turning of MDN250 Steel, Journal of materials processing technology 206 (2008) 167-179
[8] K. Bouacha, M. A. Yallese, T. Mabrouki, J.-F. Rigal: Statistical Analysis of Surface Roughness and Cutting Forces using Response Surface Methodology in Hard Turning of AISI 52100 Bearing Steel with CBN Tool, International Journal of Refractory Metals & Hard Materials 28 (2010) 349-361
[9] V. N. Gaitonde, S. R. Karnik, Luis Figueira, J. Paulo Davim: Machinability Investigations in Hard Turning of AISI D2 Cold Work Tool Steel with Conventional and Wiper Ceramic Inserts, International Journal of Refractory Metals & Hard Materials 27 (2009) 754-763
[10] J. Kundrak, A. G. Mamalis, K. Gyani, V. Bana: Surface Layer Microhardness Changes with High-Speed Turning of Hardened Steels, International Journal of Advanced Manufacturing Technology 53 (1-4) (2011) 105-112
[11] I. Sztankovics, J. Kundrak: Determination of the Chip Width and the Undeformed Chip Thickness in Rotational Turning, Key Engineering Materials 581 (2014) 131-136
[12] I. Sztankovics, J. Kundrak: Effect of the Inclination Angle on the Defining Parameters of Chip Removal in Rotational Turning, Manufacturing Technology 14 (1) (2014) 97-104
[13] R. S. Pawade, H. A. Sonawane, S. S. Joshi: An Analytical Model to Predict Specific Shear Energy in High-Speedt Urning of Inconel 718, International Journal of Machine Tools & Manufacture 49 (2009) 979-990
[14] D.-J. Waldorf, R.-E. DeVor, S.-G. Kapoor: Slip-Line Field for Ploughing during Orthogonal Cutting, Journal of Manufacturing Science and Engineering 120 (4) (1998) 693-698
[15] D.-J. Waldorf, R.-E. DeVor, S.-G. Kapoor:1999, An Evaluation of Ploughing Models for Orthogonal Machining, Journal of Manufacturing Science and Engineering 121 (1999)550-558
[16] M. Annoni, G. Biella, L. Rebaioli, Q. Semeraro: Microcutting Force Prediction by Means of a Slip-Line Field Force Model, Procedia CIRP 8 (2013) 558-563
[17] V. N. Gaitondea, S. R. Karnik, J. Paulo Davim: Selection of Optimal MQL and Cutting Conditions for Enhancing Machinability in Turning of Brass, Journal of Materials Processing Technology 204 (2008) 459-464
[18] W. Zębala, R. Kowalczyk: Estimating the Effect of Cutting Data on Surface Roughness and Cutting Force during WC-Co Turning with PCD Tool using Taguchi Design and ANOVA Analysis The International Journal of Advanced Manufacturing Technology (2014) 1-16
[19] I. Hanafi, A. Khamlichi, F. M. Cabrera , P. J. N. Lopez, A. Jabbouri: Fuzzy Rule based Predictive Model for Cutting Force in Turning of Reinforced PEEK Composite, Measurement 45 (2012) 1424-1435
[20] C. Fetecau, F. Stan: Study of Cutting Force and Surface Roughness in the Turning of Polytetrafluoroethylene Composites with a Polycrystalline Diamond Tool, Measurement 45 (2012) 1367-1379
[21] B. de Agustina, C. Bernal, A. M. Camacho, E. M. Rubio: Experimental Analysis of the Cutting Forces Obtained in Dry Turning Processes of UNS A97075 Aluminium Alloys, Procedia Engineering 63 (2013) 694-699 [22] H. Joardar, N. S. Das, G. Sutradhar, S Singh: Application of Response
Surface Methodology for Determining Cutting Force Model in Turning of LM6/SiCP Metal Matrix Composite, Measurement 47 (2014) 452-464 [23] R. Horvath, Á. Drégelyi-Kiss, Gy. Mátyási: Application of RSM Method
for the Examination of Diamond Tools, Acta Polytechnica Hungarica 11:(2) (2014) 137-147
[24] R. Horváth, Gy. Mátyási, Á. Drégelyi-Kiss: Optimization of Machining Parameters for Fine Turning Operations based on the Response Surface Method, ANZIAM Journal 55 (2014) C250-C265
[25] R. Horváth, Á. Drégelyi-Kiss: Analysis of Surface Roughness of Aluminium Alloys Fine Turned: United Phenomenological Models and Multi-Performance Optimization, Measurement 65 (2015) 181-192
[26] R. Horváth, Á. Drégelyi-Kiss: Analysis of Surface Roughness Parameters in Aluminium Fine Turning with Diamond Tool, Measurement 2013 Conference, Smolenice, Slovakia, 275-278
[27] R. Horváth, Á. Czifra, Á. Drégelyi-Kiss: Effect of Conventional and Non- Conventional Tool Geometries to Skewness and Kurtosis of Surface Roughness in Case of Fine Turning of Aluminium Alloys with Diamond Tools, The International Journal of Advanced Manufacturing Technology (2014) 1-8
[28] O. Kienzle, H. Victor: Die bestimmung von kräften und leistungen an spanenden werkzeugmaschinen, VDI-Z 94 (1952) 299-305
[29] S. R. Frey: Repetitorium: Spanende Formung Schweizer Maschinenmarkt, 32 (1980) 26-29
[30] C. Bus, N. A. L. Touwen, P. C. Veenstra, A. C. H. Van Der Wolf: On the Significance of Equivalent Chip Thickness, Annals of the CIRP, XVIV.
(1971) 121-124
[31] R. Horváth, S. Sipos, Gy. Mátyási: A New Model for Fine Turning Forces (in Hungarian) GÉP 6-7 (2014) 50-55