Solution equilibrium, structural and cytotoxicity studies on Ru(η6-p-cymene) and copper complexes of pyrazolyl thiosemicarbazones
Orsolya Dömötör, Márton A. Kiss, G. Tamás Gál, Nóra V. May, Gabriella Spengler, Márta Nové, Ana Čipak Gašparović, Éva Frank, Éva A. Enyedy
PII: S0162-0134(19)30481-7
DOI: https://doi.org/10.1016/j.jinorgbio.2019.110883
Reference: JIB 110883
To appear in: Journal of Inorganic Biochemistry Received date: 22 July 2019
Revised date: 5 October 2019 Accepted date: 6 October 2019
Please cite this article as: O. Dömötör, M.A. Kiss, G.T. Gál, et al., Solution equilibrium, structural and cytotoxicity studies on Ru(η6-p-cymene) and copper complexes of pyrazolyl thiosemicarbazones, Journal of Inorganic Biochemistry (2019), https://doi.org/
10.1016/j.jinorgbio.2019.110883
This is a PDF file of an article that has undergone enhancements after acceptance, such as the addition of a cover page and metadata, and formatting for readability, but it is not yet the definitive version of record. This version will undergo additional copyediting, typesetting and review before it is published in its final form, but we are providing this version to give early visibility of the article. Please note that, during the production process, errors may be discovered which could affect the content, and all legal disclaimers that apply to the journal pertain.
© 2019 Published by Elsevier.
Journal Pre-proof
1
Solution equilibrium, structural and cytotoxicity studies on
Ru(6-p-cymene) and copper complexes of pyrazolyl thiosemicarbazones
Orsolya Dömötör,a Márton A. Kiss,b G. Tamás Gál,c Nóra V. May,c Gabriella Spengler,d Márta Nové,d Ana Čipak Gašparović,e Éva Frank,b Éva A. Enyedya*
a Department of Inorganic and Analytical Chemistry, Interdisciplinary Excellence Centre, University of Szeged, Dóm tér 7, H-6720 Szeged, Hungary
b Department of Organic Chemistry, University of Szeged, Dóm tér 8, H-6720 Szeged, Hungary
c Research Centre for Natural Sciences Hungarian Academy of Sciences, Magyar tudósok körútja 2, H-1117 Budapest, Hungary
d Department of Medical Microbiology and Immunobiology, University of Szeged, Dóm tér 10, H-6720 Szeged, Hungary
e Rudjer Boskovic Institute, HR 10000 Zagreb, Croatia
Keywords: Solution stability; X-ray crystal structures; Cytotoxicity; Metal complexes;
Thiosemicarbazones
* Corresponding author.
E-mail address: enyedy@chem.u-szeged.hu (É.A. Enyedy).
ABSTRACT
Solution chemical properties of two bidentate pyrazolyl thiosemicarbazones 2-((3-methyl-1- phenyl-1H-pyrazol-4-yl)methylene)hydrazinecarbothioamide (Me-pyrTSC), 2-((1,3-diphenyl- 1H-pyrazol-4-yl)methylene)hydrazinecarbothioamide (Ph-pyrTSC), stability of their Cu(II) and Ru(6-p-cymene) complexes were characterized in aqueous solution (with 30% DMSO) by the combined use of UV-visible spectrophotometry, 1H NMR spectroscopy and electrospray ionization mass spectrometry in addition to their solid phase isolation. The solid phase structures of Me-pyrTSC∙H2O, [Ru(6-p-cymene)(Me-pyrTSC)Cl]Cl and [Cu(Ph- pyrTSCH‒1)2] were determined by single crystal X-ray diffraction. High stability mononuclear Ru(6-p-cymene) complexes with (N,S) coordination mode are formed in the acidic pH range, and increasing the pH the predominating dinuclear [(Ru(6-p-cymene))2(L)2]2+ complex with
2-bridging sulphur donor atoms is formed (where L- is the deprotonated thiosemicarbazone).
[CuL]+ and [CuL2] complexes show much higher stability compared to that of complexes of the reference compound benzaldehyde thiosemicarbazone. [CuL2] complexes predominate at
Journal Pre-proof
2
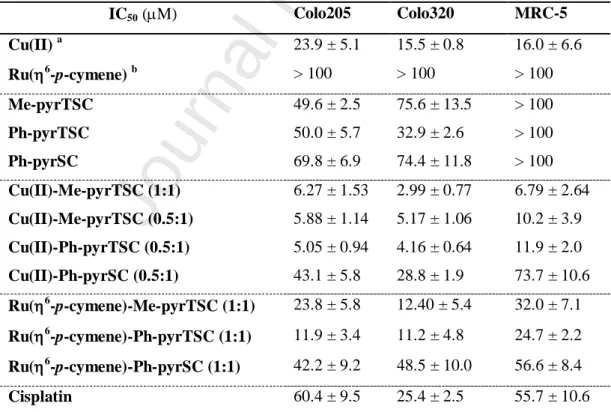
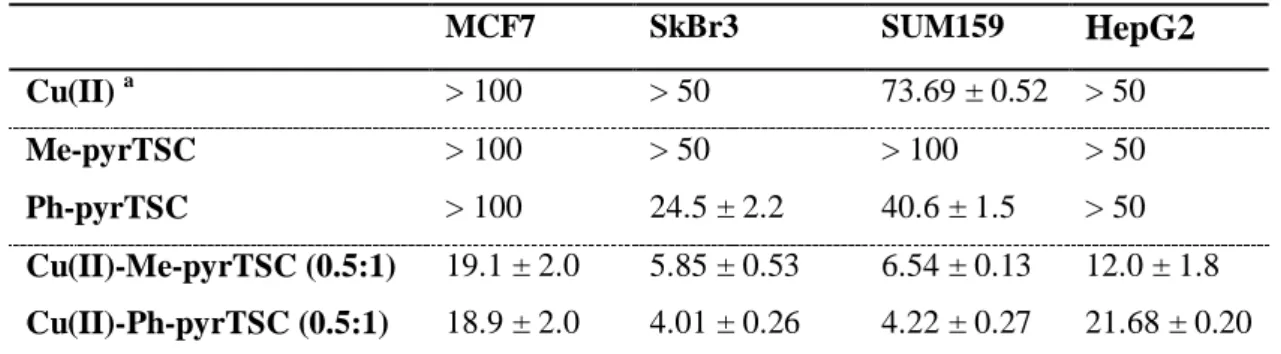
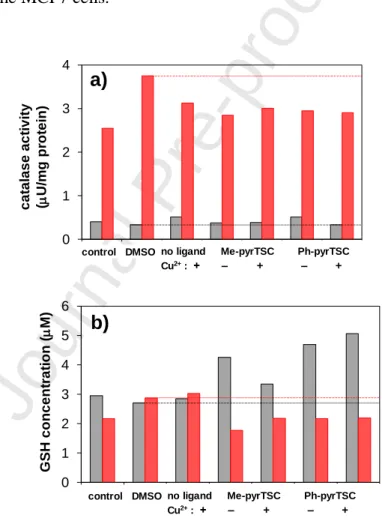
neutral pH. Me-pyrTSC and Ph-pyrTSC exhibited moderate cytotoxicity against human colonic adenocarcinoma cell lines (IC50 = 33-76 M), while their complexation with Ru(6-p- cymene) (IC50 = 11-24 M) and especially Cu(II) (IC50 = 3-6 M) resulted in higher cytotoxicity. Cu(II) complexes of the tested thiosemicarbazones were also cytotoxic in three breast cancer and in a hepatocellular carcinoma cell line. No reactive oxygen species production was detected and the relatively high catalase activity of SUM159 breast cancer cells was decreased upon addition of the ligands and the complexes. In the latter cell line the tested compounds interfered with the glutathione synthesis as they decreased the concentration of this cellular reductant.
1. Introduction
Thiosemicarbazones (TSCs) are versatile compounds and known for their wide pharmacological activity including anticancer properties [1,2]. Triapine (3-aminopyridine-2- carboxaldehyde thiosemicarbazone) is the best-known representative of this family and was extensively investigated in numerous clinical phase I and II trials in mono or combination therapies [3,4]. Two new promising TSCs, namely N'-(6,7-dihydroquinolin-8(5H)-ylidene)-4- (pyridin-2-yl)piperazine-1-carbothiohydrazide (COTI-2, an orally available third generation TSC) and di-2-pyridylketone-4-cyclohexyl-4-methyl-3-thiosemicarbazone (DpC) also entered human clinical studies in the last years [5,6]. These compounds belong to the family of -N- pyridyl TSCs, therefore are considered as tridentate ligands with a typical (Npyridyl,N,S) coordination mode with strong affinity towards various metal ions including Fe(II/III) and Cu(II) [7]. The anticancer properties of Triapine are connected to the inhibition of the iron- containing ribonucleotide reductase enzyme and the formation of redox-active iron complexes in the cells is suggested to be a crucial step of the mechanism of action [8]. On the other hand, other essential metal ions (especially copper) besides iron have been associated with the mechanism of action of TSCs [9-11]. -N-pyridyl- and salicylaldehyde-type TSCs are able to form mono-ligand Cu(II) complexes with high solution stability at physiological pH with (Npyridyl,N,S‒) and (O‒,N,S‒) coordination modes, respectively [12-14]. Till now numerous Cu(II) complexes of TSCs were developed for anticancer activity [15,16] and generation of reactive oxygen species (ROS) is often assumed to be the mode of action [17,18], although it is not true in all cases [7,19]. In addition to Cu(II) other metal ions such as Pd(II), Ga(III), half-sandwich organometallic ions [15,20-23] can also form complexes with TSCs owing significant cytotoxicity via different mechanisms of action and multiple targets.
Journal Pre-proof
3
For understanding of the anticancer activity of TSCs and their metal complexes and for investigation of structure-activity relationships the knowledge on their solution speciation and the most probable solution structures under physiological conditions is of primary importance. The anticancer TSC compounds are often characterized only in solid phase or in organic solvents, and information about their behaviour in aqueous solution is still limited.
Although solution speciation of numerous Cu(II) and Fe(II)/III) complexes of -N-pyridyl- and salicylaldehyde-type TSCs was determined in our previous works [12-14,24], no available stability data are published for the complexes of bidentate TSCs so far. In this work our aim was to reveal the differences of the complex formation with Cu(II) ions between two bidentate pyrazolyl TSCs Me-pyrTSC, Ph-pyrTSC (Chart 1) and tridentate TSCs, and to characterize the complexation of these ligands with the half-sandwich organometallic [Ru(6-p-cymene)(H2O)3]2+. The bis-ligand Pd(II) complexes of them were reported to be rather cytotoxic against MCF7 breast cancer cell lines (IC50 = 0.57-1.24 M) [25], but no cytotoxicity data were published for their Cu(II) and Ru(6-p-cymene) complexes.
Chart 1. Chemical structures of the investigated 2-((3-methyl-1-phenyl-1H-pyrazol-4- yl)methylene)hydrazinecarbothioamide (Me-pyrTSC), 2-((1,3-diphenyl-1H-pyrazol-4- yl)methylene)hydrazinecarbothioamide (Ph-pyrTSC) and 2-((1,3-diphenyl-1H-pyrazol-4- yl)methylene)hydrazinecarboxamide (Ph-pyrSC) in their neutral forms (HL).
Therefore, solution speciation, solid phase structures of Cu(II) and Ru(6-p-cymene) complexes of the selected bidentate pyrazolyl TSCs were investigated by different methods such as UV-visible (UV-vis) spectrophotometry, 1H , 13C NMR and electron paramagnetic resonance (EPR) spectroscopy, electrospray ionization mass spectrometry (ESI-MS) and X- ray crystallography. Additionally, anticancer activity via cytotoxicity assays, ROS production, catalase activity and L-glutathione (GSH) levels were also monitored.
N N
N H
HN NH2
O N
N
N H
HN NH2
S N
N
N H
HN NH2
S
Me-pyrTSC Ph-pyrTSC Ph-pyrSC
Journal Pre-proof
4 2. Experimental
2.1. Chemicals
All solvents were of analytical grade and used without further purification. All solvents used for the ligand synthesis were distilled shortly prior to use. [Ru(6-p-cymene)(-Cl)Cl]2, benzaldehyde thiosemicarbazone (Bz-TSC), CuCl2, KCl, HCl, KOH, NaH2PO4, Na2HPO4, dimethyl sulfoxide (DMSO), EDTA, 4-(2-hydroxyethyl)-1-piperazineethanesulfonic acid (HEPES), maltol, 3-(4,5-dimethylthiazol-2-yl)-2,5-diphenyltetrazolium bromide (MTT), N- acetyl-cysteine (NAC), 2,7-dichlorodihydrofluorescein diacetate (DCFH-DA), 2,2'-dinitro- 5,5'-dithiodibenzoic acid (DTNB) and 4,4-dimethyl-4-silapentane-1-sulfonic acid (DSS) were purchased from Sigma-Aldrich in puriss quality. Milli-Q water was used for sample preparation. CuCl2 stock solution was made by the dissolution of anhydrous CuCl2 in water and its exact concentration was determined by complexometry through the EDTA complex.
The exact concentration of aqueous stock solution of Ru(6-p-cymene) prepared by the dissolution of [Ru(6-p-cymene)(-Cl)Cl]2 was determined by pH-potentiometric titrations in the presence of 0.2 M chloride ions employing stability constants for [(Ru(6-p- cymene))2(-OH)i](4-i)+ (i = 2 or 3) complexes [26]. The stock solution of Bz-TSC and Ph- pyrSC was prepared on a weight-in-volume basis dissolved in DMSO, while the purity of Me- pyrTSC and Ph-pyrTSC was checked by 1H NMR spectroscopy in DMSO-d6 using maltol as internal standard.
2.2. Synthesis of Me-pyrTSC, Ph-pyrTSC and Ph-pyrSC
Compounds Me-pyrTSC, Ph-pyrTSC and Ph-pyrSC were prepared according to the literature [27,28] with some modifications. The synthetic route (Scheme S1) and characterization of the products are found in the Supplementary Information. General procedure for the synthesis of hydrazones (2a and 2b): phenylhydrazine (1.18 mL, 12.0 mmol) and a catalytic amount of acetic acid (0.1 mL) were added to a solution of acetone (1a, 0.74 mL, 10.0 mmol) or acetophenone (1b, 1.17 mL, 10.0 mmol) in ethanol (EtOH) (10 mL). The reaction mixture was kept at reflux temperature for 1 h and then cooled to 25 °C. The progress of the reaction was monitored by thin-layer chromatography (TLC) (ethyl acetate (EtOAc)/hexane=10:90).
The resulting precipitate was filtered off and washed with a small amount of ice-cold methanol, then dried under vacuo. The product decomposes at room temperature or above and should be kept in a refrigerator.
Journal Pre-proof
5
Synthesis of 4-formyl pyrazoles (3) (Vilsmeier-Haack reaction): To an ice-cold solution of 2a (0.74 g, 5.0 mmol) or 2b (1.05 g, 5.0 mmol) in N,N-dimethylformamide (DMF, 20 mL), cold phosphoryl chloride (POCl3, 3 equiv.) was added dropwise, and the mixture was first stirred at 0 °C for 10 min and then was heated to 60 °C and kept at this temperature for 3 h.
The progress of the reaction was monitored by TLC (EtOAc/hexane = 20:80). After cooling, the mixture was poured into ice-cold water (100 mL), neutralized with NaOH aqueous solution, and the precipitate was filtered in vacuo, washed with water and crystallized from EtOH.
Synthesis of Me-pyrTSC and Ph-pyrTSC: To a solution of 3a (186 mg, 1.0 mmol) or 3b (248 mg, 1.0 mmol) in EtOH (5 mL), a catalytic amount of glacial AcOH (0.1 mL) and thiosemicarbazide (109 mg, 1.2 equiv.) were added, and the reaction mixture was irradiated with microwave (MW) (80 °C) for 5 min (alternatively 2 h under reflux is sufficient). The completion of the reaction was determined by TLC (EtOAc/hexane = 40:60). The crude product was poured into ice cold water. The solid thus obtained was filtered in vacuo, washed with ice-cold water and purified by column chromatography (silica gel, EtOAc/hexane=30:70 to EtOAc using gradient elution).
Procedure for the synthesis of Ph-pyrSC: To a solution of 2b (248 mg, 1.0 mmol) in EtOH (5 mL), semicarbazide hydrochloride (134 mg, 1.2 equiv.) and NaOAc (98 mg, 1.2 equiv.) were added, and the reaction mixture was irradiated with MW (80 °C) for 5 min (alternatively 2 h under reflux is sufficient). The completion of the reaction was determined by TLC (EtOAc/hexane = 40:60). The crude product was poured into ice-cold water. The solid thus obtained was filtered in vacuo, washed with ice-cold water and purified by column chromatography (silica gel, EtOAc).
Reactions under MW-irradiation were carried out with a CEM Discover SP equipment using dynamic control program with a maximum power of 200 Watts. Reactions were monitored by thin layer chromatography on Kieselgel-G (Merck Si 254 F) layers (0.25 mm thick). Flash chromatography: Merck silica gel 60, 40–63 μm. Melting points were determined on an SRS Optimelt digital apparatus.
2.3. Synthesis of Ru(η6-p-cymene) and Cu(II) complexes of Me-pyrTSC and Ph-pyrTSC
[Ru(η6-p-cymene)(Me-pyrTSC)Cl](Cl) and [Ru(η6-p-cymene)(Ph-pyrTSC)Cl](Cl) complexes: Me-pyrTSC (0.062 mmol) or Ph-pyrTSC (0.062 mmol) and [Ru(η6-p-cymene)(- Cl)Cl]2 (0.031 mmol) were dissolved in 2.0 mL ethanol, then 4.5 mL water was added.
Solvent mixture was evaporated at room temperature for 5 days. Complexes were re-
Journal Pre-proof
6
crystallized from CH2Cl2, and the complex was obtained as dark red solid powder (yield: 27%
for Me-pyrTSC and 23% for Ph-pyrTSC complexes, respectively). The isolated complexes were characterized by ESI-MS, 1H and 13C NMR spectroscopy and UV-vis spectrophotometry; see experimental data and spectra (Figures S1-S3) in SI.
[Cu(Me-pyrTSCH‒1)2] and [Cu(Ph-pyrTSCH‒1)2]: The ligand Me-pyrTSC (0.084 mmol) or Ph-pyrTSC (0.084 mmol) was dissolved in DMSO (3.0 mL), then 0.7 mL 0.05 M HCl and CuCl2 solution (86.39 M in water, 0.042 mmol) was added, and the pH was adjusted to pH
~ 6 by the addition of 0.1 M KOH (0.8 mL). Pale brownish precipitate was formed. The precipitate was decanted, washed with 5-5 mL water four times and dried at 80 °C overnight.
Formed complexes (yield: 29% for Me-pyrTSC and 25% for Ph-pyrTSC) were characterized by ESI-MS, EPR spectroscopy and UV-vis spectrophotometry, see experimental data and spectra (Figures S4-S6) in SI.
2.4. Crystallographic structure determination
Single crystals suitable for X-ray diffraction experiment of ligand Me-pyrTSC∙H2O (I), complexes [Ru(6-p-cymene)(Me-pyrTSC)Cl]Cl (II) and [Cu(Ph-pyrTSCH‒1)2] (III) were grown from ethanol:CH2Cl2 (1:1) (I) or ethanol:water (3:7) (II) or DSMO:CH2Cl2 (2:5) (III) solvent mixtures containing Ru(6-p-cymene) and Me-pyrTSC at 1:1 (II), or Cu(II) and Ph- pyrTSCS at 1:2 (III) metal-to-ligand ratio, respectively. Single crystals were mounted on loops and transferred to the goniometer. X-ray diffraction data were collected at low temperature (128, 153 and 108 K for crystals I, II and III respectively) on a Rigaku RAXIS-RAPID II diffractometer using Cu-Kradiation for crystal I and Mo-K radiation for crystals II and III.
Numerical (for crystal I) or empirical (for crystal II and III) absorption correction [29] were carried out using the program CrystalClear [30]. Sir2014 [31] and SHELXL [32] under WinGX software [33] were used for structure solution and refinement, respectively. The structures were solved by direct methods. The models were refined by full-matrix least squares on F2. Refinement of non-hydrogen atoms was carried out with anisotropic temperature factors.
Hydrogen atoms were placed into geometric positions (except for water hydrogens). They were included in structure factor calculations but they were not refined. The isotropic displacement parameters of the hydrogen atoms were approximated from the U(eq) value of the atom they were bonded to. For crystal I the collection of high angle data was limited because of the use of copper wavelength. For crystal II disordered structures were detected therefore some non- hydrogen atoms were also treated with isotropic displacement parameters. In case of crystal III
Journal Pre-proof
7
the platelet crystal shape prevented the collection of high quality data. The summary of data collection and refinement parameters are collected in Table S2. Selected bond lengths and angles of compounds were calculated by PLATON software [34]. The graphical representation and the edition of CIF files were done by Mercury [35] and PublCif [36] softwares. The crystallographic data files for the complexes have been deposited with the Cambridge Crystallographic Database as CCDC 1942252-1942254.
2.5. Solution studies: pH-potentiometry, UV-visible and 1H NMR spectroscopy, ESI-MS The pH-potentiometric titrations for the determination of the exact concentration of the HCl and KOH solutions, the overall stability constant of [((Ru(6-p-cymene))2(-OH)3]+ species were carried out at 25.0 ± 0.1 oC in DMSO:water 30:70 (v/v) as solvent. Ionic strength of 0.10 M (KCl) was used in order to keep the activity coefficients constant. The titrations were performed with carbonate-free KOH solution of known concentration (0.10 M). An Orion 710A pH-meter equipped with a Metrohm combined electrode (type 6.0234.100) and a Metrohm 665 Dosimat burette were used for the titrations. The electrode system was calibrated to the pH = −log[H+] scale in the DMSO/water solvent mixture by means of blank titrations (strong acid vs. strong base: HCl vs. KOH), similarly to the method suggested by Irving et al. [37] in pure aqueous solutions. The average water ionization constant pKw was 14.55 ± 0.02, which corresponds well to the literature data [12-14,38]. The pH-potentiometric titrations were performed in the pH range 2.0 − 12.5 using 10 cm3 sample volumes. The concentration of the [(Ru(6-p-cymene)(H2O)3]2+ was 2 mM. Samples were deoxygenated by bubbling purified argon through them for approximately 10 min prior to the measurements.
Argon was also passed over the solutions during the titrations. Calculation of the stoichiometry and stability constants of the complexes was performed with the computer program HYPERQUAD [39].
An Agilent Cary 8454 diode array spectrophotometer was used to record the UV-vis spectra in the 200 to 950 nm window. The path length was varied between 1 and 50 mm.
Equilibrium constants and the molar absorbance spectra of the individual species were calculated with the computer program PSEQUAD [40]. The spectrophotometric titrations were performed on samples containing the ligands with or without metal ions in the pH range from 2 to 12.5 at 25.0 ± 0.1 °C in DMSO:water 30:70 (v/v) at an ionic strength of 0.10 M (KCl).
The concentration of the ligands was in the range 2‒ 160 M; the metal-to-ligand ratios were varied between 1:0.25 ‒ 1:5.
Journal Pre-proof
8
Distribution coefficient (D7.4) values of ligands were determined by the traditional shake-flask method in n-octanol/buffered aqueous solution at pH 7.40 (20 mM phosphate buffer, 0.10 M KCl) at 25.0 ± 0.2 °C as described previously with some modifications [41].
The ligands were dissolved at 50 M concentrations in n-octanol pre-saturated with buffer solution. The aqueous solution and n-octanol (1:1 ratio) were gently mixed with 360° vertical rotation (~20 rpm) for 3 h to avoid emulsion formation, and the mixtures were centrifuged at 5000 rpm for 3 min. After separation, UV-vis spectra of the compounds in the n-octanol phase were compared to those of the original n-octanol solutions and D7.4 values were calculated as follows: Absorbance (n-octanol phase after separation) / (Absorbance (original n-octanol solution) ‒ Absorbance (n-octanol phase after separation)).
1H and 13C NMR spectroscopic studies for the ligands and the Ru(6-p-cymene) complexes were carried out on a Bruker Avance III HD Ascend 500 Plus instrument. Spectra were recorded in CDCl3, in DMSO-d6 or in a 30% (v/v) DMSO-d6/H2O mixture using 0.5 ‒ 2 mM ligand concentrations varying the metal-to-ligand ratios, the pH (2 ‒ 12) or the chloride ion content. In the latter case DMSO-d6 was used as reference (δ = 2.65 ppm) and
WATERGATE method was used to suppress the solvent resonance.
ESI-MS measurements were performed using a Waters Q-TOF Premier (Micromass MS Technologies, Manchester, UK) mass spectrometer equipped with electrospray ion source.
Samples contained 20-50 M complex dissolved in methanol or 5 M Ru(6-p-cymene) organometallic cation and 5‒ 20 M ligand in 2% (v/v) ethanol/water solvent mixture. pH was adjusted by small amount of formic acid, HCl or KOH.
2.6. In vitro cell studies
Cell lines and culture conditions: All cell culture reagents were obtained from Sigma-Aldrich and plastic ware from Sarstedt (Germany). Human colonic adenocarcinoma cell lines Colo 205 doxorubicin-sensitive and Colo 320/MDR-LRP multidrug resistant, overexpressing ABCB1 (MDR1)-LRP, ATCC-CCL-220.1 (Colo 320) and CCL-222 (Colo 205) were purchased from LGC Promochem, Teddington, UK. MRC-5 human embryonal lung fibroblast cell line (ATCC CCL-171) was purchased from LGC Promochem, Teddington, UK. In addition, hepatocellular carcinoma cell line (HepG2) and three subtypes of breast cancer cell lines: the hormone-responsive MCF7, the HER2-positive SkBr3 and the triple-negative SUM159 cancer cell lines were also used. The cells were cultured in Roswell Park Memorial Institute (RPMI) 1640 medium for Colo and MRC-5 or in Dulbecco’s modified Eagle’s
Journal Pre-proof
9
medium (DMEM) for HepG2 and breast cancer cell lines supplemented with 10% heat- inactivated fetal bovine serum, 2 mM L-glutamine, 1 mM sodium pyruvate and 100 mM HEPES. The cells were incubated at 37°C, in a 5% CO2, 95% air atmosphere. All cell lines were detached with Trypsin-Versene (EDTA) solution for 5 min at 37 °C.
MTT and EZ4U assays: Me-pyrTSC, Ph-pyrTSC, Ph-pyrSC and their copper(II) and Ru(6-p-cymene) complexes were dissolved in a 90% (v/v) DMSO/H2O mixture first using 10 mM ligand and 0, 5 or 10 mM metal ion concentrations. The metal salts without ligands were also tested. Cisplatin (Teva) was used as a positive control. Then stock solutions were diluted in complete culture medium, and two-fold serial dilutions of compounds were prepared in 100 L of RPMI 1640, horizontally. The semi-adherent colonic adenocarcinoma cells were treated with Trypsin-Versene (EDTA) solution. They were adjusted to a density of 1×10⁴ cells in 100 L of RPMI 1640 medium, and were added to each well, with the exception of the medium control wells. The final volume of the wells containing compounds and cells was 200 L. The culture plates (Colo205, Colo320, MRC-5) were incubated at 37°C for 72 h; at the end of the incubation period, 20 L of MTT solution (from a stock solution of 5 mg/mL) were added to each well. After incubation at 37°C for 4 h, 100 L of SDS solution (10% in 0.01 M HCI) were added to each well and the plates were further incubated at 37˚C overnight. The EZ4U assay kit (Biomedica, Wien, Austria) was used according to manufacturer’s instructions in the case of cell lines HepG2, MCF7, SkBr3 and SUM159.
Samples and cells were prepared in the similar way as in case of the traditional MTT assay.
After the 24 h incubation the compounds were diluted in a volume of 100 µL medium, then the culture plates were incubated at 37 C for 24 h; at the end of the incubation period, 20 µL of MTT solution was added to each well and incubated for 2 h incubation. The cell growth was determined using both methods by measuring the optical density (OD) at 450 nm (ref.
620 nm) with a Multiscan EX ELISA reader. Inhibition of the cell growth (expressed as IC50: inhibitory concentration that reduces by 50% the growth of the cells exposed to the tested compounds) was determined from the sigmoid curve where 100 - ((ODsample ‒ ODmedium control) / (ODcell control ‒ ODmedium control))×100 values were plotted against the logarithm of compound concentrations. Curves were fitted by GraphPad Prism software [42] using the sigmoidal dose-response model (comparing variable and fixed slopes).
Reactive oxygen species production assay: The ROS measurement was performed in MCF7 and SUM159 cell lines with 2',7'-dichlorodihydrofluorescein diacetate (DCFH-DA).
While penetrating the cell DCFH-DA is deacetylated by esterases and the forming DCFH
Journal Pre-proof
10
inside the cell reacts with ROS and transforms to the fluorescent 2,7-dichlorofluorescein (DCF) in turn. The emission intensity of DCF was measured at 529 nm using 500 nm excitation wavelength. The SkBr-3 and HepG2 cancer cells were seeded 1×10⁴ in 100 µL DMEM /10% fetal bovine serum (FBS) into in 96-well microtiter plates. After allowing cells to adhere for 24 h, 1 mM NAC was added to some wells while 100 µM DCFH-DA was added to all wells. After removing the media with the excess of DCFH-DA, cells were treated with the compounds in 1 µM concentration (where the compounds are not toxic to the cells). The increase in ROS caused by compounds applied was measured at different time points – prior to treatment and 120 min after the treatment.
Catalase activity and GSH level assays: For both assays cells were prepared in a same manner. The SUM159 and MCF-7 were seeded in 6-well plates at density of 5×10⁵ cell/well, and were allowed 24 h to attach to the well. Then, cells were treated with 1 µM compound and left for 24 h after which they were harvested, and the dry pellet was stored at -80 C until analysis. For analyses, cells were lysed in phosphate buffered saline (PBS) by 4 freeze/thaw cycles, and total protein content was measured by Bradford method [43]. Total GSH was measured spectrophotometrically at 450 nm (ref. 620 nm) by modified Tietze method based on reduction of DTNB (Ellman's reagent) to 2-nitro-5-thiobenzoate (TNB anion) by GSH [44]. Catalase activity was assayed by measuring H2O2 decomposition by catalase in the whole cell lysate by Góth method [45].
3. Results and discussion
3.1. Synthesis, solid and solution phase characterization of Me-pyrTSC, Ph-pyrTSC and Ph- pyrSC
Compounds Me-pyrTSC, Ph-pyrTSC and Ph-pyrSC (Chart 1) were prepared by the condensation reaction of the corresponding 4-formyl pyrazoles (pyrazole-4-carbaldehyde) and thiosemicarbazide or semicarbazide hydrochloride as described in references [27,46], although some modifications were applied, namely microwave-assisted reactions were performed (Scheme S1). Acid-catalyzed condensation reaction of acetone (1a) or acetophenone (1b) with phenylhydrazine in refluxing ethanol led to the corresponding hydrazones (2a and 2b) in excellent yields. Subsequent cyclization and simultaneous formylation with the Vilsmeier-Haack reagent (POCl3/DMF) afforded 4-formyl-pyrazoles (3a and 3b) [46], which were then converted to thiosemicarbazones (Me-pyrTSC and Ph-pyrTSC)
Journal Pre-proof
11
and a semicarbazone (Ph-pyrSC), respectively, in the presence of acetic acid (Me-pyrTSC and Ph-pyrTSC) or sodium acetate (Ph-pyrSC) [27] in ethanol under MW irradiation. 1H and 13C NMR spectra were in agreement with the expected structures of the intermediates and the final products and the 1H and 13C resonances published previously [27,46-50] (see Supplementary Information).
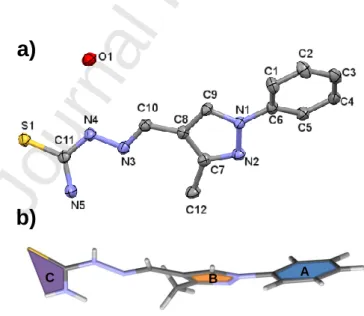
The structure of Me-pyrTSC∙H2O (I) was established by single crystal X-ray diffraction (Figure 1.a). Me-pyrTSC crystallized in monohydrate form in triclinic P-1 space group. The molecule has a twisted conformation as ring A is twisted from ring B by 27.99(13)o and plane C is twisted from ring B by 29.5o (Figure 1.b). An intramolecular hydrogen bond between N5- H5A…N3 stabilizes the molecular conformation. In the crystal, dimers are formed between two molecules via the N5-H5B…S1 hydrogen bonds, and vice versa (Figure S7). The neighbouring molecules are further connected through hydrogen bonds with solvent water molecules. The acidic hydrogen, H2N4 is coordinating to a water oxygen, and water hydrogens are connected to N2 and S1 atoms. The packing arrangement is shown in Figure S7. Selected H-bond distances and angles are collected in Table S3. Apart from hydrogen bonds a …
(off-centered parallel stacking) interaction could be observed between the two five membered rings for which the distance of 3.8687(14) Å can be measured.
Figure 1. (a) Molecular structure of Me-pyrTSC∙H2O (I). Displacement parameters are drawn at 50%
probability level. Hydrogen atoms are omitted for clarity. (b) Conformation of the compound and assignment of the molecular planes.
The molecular structure of Me-pyrTSC∙H2O (I) was compared with Ph-pyrTSC
B A C
a)
b)
Journal Pre-proof
12
(PIKRUX) [51] and two other pyrazolyl TSC derivatives (Ref. codes: CEHHEE and XEBCIS) defined previously [52,53]. CEHHEE also crystallized with one water molecule, while PIKRUX and XEBCIS crystallized without solvent inclusion in their crystal lattices. When the pyrazole rings are overplayed high flexibility of the hydrazine-carbothioamide side chain can be seen for the different crystals (Figure S8).
Since the TSCs and their metal complexes showed much more significant cytotoxicity than the semicarbazone Ph-pyrSC (vide infra), our solution studies were focused on the behaviour of Me-pyrTSC and Ph-pyrTSC. The purity of Me-pyrTSC and Ph-pyrTSC was also checked via 1H NMR spectroscopic measurements using maltol as internal standard. The solid ligand was dissolved in DMSO-d6 and different amounts of maltol were added (Figure S9), then the peak integrals of the ligand were compared to those of maltol of known concentrations. The compounds were found to be adequately pure (98.5-100%) and the exact concentrations of their stock solutions prepared on a weight-in-volume basis were calculated taking notice of these values.
The studied compounds have limited water solubility that hindered the use of pH- potentiometric titrations, therefore the proton dissociation processes of Me-pyrTSC and Ph- pyrTSC were studied by UV-vis spectrophotometry at low ligand concentration in 30% (v/v) DMSO/water solvent mixture, similarly to our former works [12-14,24] to obtain comparable data. In addition Bz-TSC was involved as a simple bidentate TSC model for comparison. No spectral changes were observed up to pH 10 (Figure 2), and the appearance of a well-defined isobestic point at higher pH values demonstrates that two species (HL, L‒) are involved in the equilibrium. pKa values and the spectra of the individual ligand species were calculated on the basis of deconvolution of recorded UV-vis spectra (Table 1). The deprotonation process can be attributed to the hydrazinic-NH moiety. These TSCs have high and similar pKa values, and we can conclude that they are present in their HL form at neutral pH. These pKa values are somewhat higher than those of the -N-pyridyl TSCs such as Triapine or formaldehyde TSC [24]. 1H NMR spectra were recorded at various pH values (see the representative example for Bz-TSC in Figure S10) and the pH-dependence of the chemical shifts confirmed the high pKa
values of the ligands.
Journal Pre-proof
13
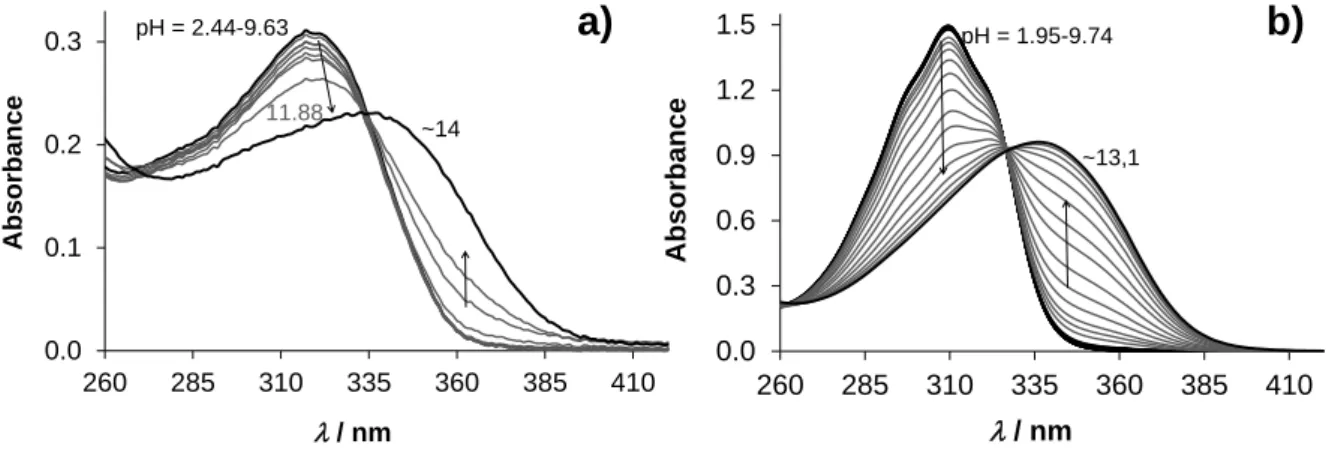
Figure 2. UV-vis absorption spectra of Ph-pyrTSC (a) and Bz-TSC (b) in the pH range 2-14 in 30% (v/v) DMSO/water solvent mixture in addition to the deprotonation process. {cPh-pyrTSC = 10 M;
cBz-TSC = 47 M; T = 25.0 °C; I = 0.1 M (KCl); l = 1 cm}
The lipophilic character is an important property of drugs as it strongly affects the passage via biological membranes. Therefore we attempted to determine the logD7.4 values for Me-pyrTSC, Ph-pyrTSC and Bz-TSC using the shake-flask method in n-octanol/buffered aqueous solution at pH 7.40 (Table 1). The logD7.4 values represent the strong lipophilic feature of the compounds.
Table 1
pKa values determined by UV-vis titrations, max, molar absorbance () and logD7.4 values of ligands studied. {T = 25 C; I = 0.1 M (KCl) in 30% (v/v) DMSO/H2O}
medium Me-pyrTSC Ph-pyrTSC Bz-TSC pKa 30% (v/v) DMSO/H2O 11.53±0.01 11.56±0.01 11.78±0.01
max (nm) / (M-1cm-1) 30% (v/v) DMSO/H2O HL
L–
313 / 37690 330 / 26825
323 / 28420 340 / 21979
310 / 31450 338 / 21290
DMSO 323 / 39100 333 / 30700 -
logD7.4 n-octanol/ buffer > +1.9 +2.1±0.2 +1.55±0.04
3.2. Solution equilibrium studies, synthesis and structural characterization of ruthenium(II)(6-p-cymene) complexes
The complex formation equilibrium processes can be characterized when the hydrolysis constants of the organoruthenium triaqua cation are known besides the pKa values of the ligands under the condition applied. The hydrolytic behaviour of [Ru(6-
0.0 0.1 0.2 0.3
260 285 310 335 360 385 410
Absorbance
/ nm pH = 2.44-9.63
11.88
~14
0.0 0.3 0.6 0.9 1.2 1.5
260 285 310 335 360 385 410
Absorbance
/ nm
pH = 1.95-9.74
~13,1
a) b)
Journal Pre-proof
14
p-cymene)(H2O)3]2+ has been already studied in pure water by Buglyó et al. at 0.2 M chloride ion concentration and in solutions of 0.2 M KNO3 [26,54]. In addition the hydrolysis constants were also determined in 20% (v/v) DMSO/water solvent mixture by UV-vis spectrophotometric titrations in our former work using 0.2 M KCl ionic strength [55]. Based on the reported constants (Table 2) it could be concluded that the probable coordination of chloride ions and DMSO suppresses the hydrolysis of this organometallic cation which is then shifted to higher pH values. In the present work 30% (v/v) DMSO/water solvent mixture and 0.1 M KCl ionic strength was used due to the limited solubility of the ligands in water. The hydrolysis was followed by pH- potentiometric, UV-vis spectrophotometric and 1H NMR spectroscopic titrations yielding equilibrium constants which are in a good agreement with each other (Table 2). It is important to note that as the chloride ions and DMSO are coordinating ligands; thus the possible partial displacement of aqua ligand by chloride or DMSO should be considered and all the determined equilibrium constants for the organoruthenium species are conditional constants obtained at the given chloride concentration. 1H NMR spectra recorded for [Ru(6-p-cymene)(H2O)3]2+ at various pH values are shown in Figure 3, which refer to the presence of only one type of hydrolysis product appearing at pH > 5. This species was identified as the -hydroxido bridged dinuclear [(Ru(6-p-cymene))2(-OH)3]+ as it was suggested in the previous works [26,54].
Table 2
Hydrolysis constants of [Ru(6-p-cymene)(H2O)3]2+ (log) and overall (log) and stepwise (logK) stability constants and proton dissociation constants (pKa) of the Ru(6-p-cymene) complexes formed with Me-pyrTSC and Ph-pyrTSC. {T = 25 C; I = 0.1 M (KCl) in 30% (v/v) DMSO/H2O}
method
log[(Ru(6-p-cymene)2(H‒1)3]+ a pH-metry ‒14.69±0.05 UV-vis ‒14.75±0.01
1H NMR ‒14.64±0.01
Me-pyrTSC Ph-pyrTSC log[Ru(6-p-cymene)(HL)]2+/+ b UV-vis ≥19.0 ≥18.9 pKa[Ru(6-p-cymene)(HL)]2+/+ 1H NMR 3.50±0.02 3.44±0.02 log[Ru(6-p-cymene)(L)]+/0 c cald. ≥15.5 ≥15.5 logK[(Ru(6-p-cymene))2(L)2]2+ d 1H NMR 5.50±0.03 5.34±0.02
Journal Pre-proof
15
log[(Ru(6-p-cymene))2(L)2]2+ e cald. ≥36.5 ≥36.3
a [(Ru(6-p-cymene)2(H‒1)3]+ = [(Ru(6-p-cymene))2(OH)3]+. log [(Ru(6-p- cymene))2(H-1)3]+ = ‒9.36 (pure water, 0.2 M KNO3) [54]; = ‒11.88 (pure water, 0.2 M KCl) in addition to log [(Ru(6-p-cymene))2(H‒1)2]+ = ‒7.12 [26]; = ‒15.11 (20%
DMSO/H2O, 0.2 M KCl) in addition to log [(Ru(6-p-cymene))2(H‒1)2]+ = ‒9.85 [55]. b Estimated values. c = log[Ru(6-p-cymene)(HL)]2+/+ ‒ pKa[Ru(6-p-cymene)(HL)]2+/+. d Formation from the mononuclear species. e = logK[(Ru(6-p-cymene))2(L)2]2+ + 2×
log[Ru(6-p-cymene)(L)]+/0.
Figure 3. (a) Representative 1H NMR spectra in the low-field region recorded for [Ru(6-p- cymene)(H2O)3]2+ in the pH range 3.2 ‒ 11.4 in the presence of 0.1 M chloride ions in 30% (v/v) DMSO-d6/water solvent mixture. Notably, the aqua ligands in the triaqua cation are partly replaced by chloride ions (or DMSO). (b) Calculated concentration distribution curves with the hydrolysis constant determined, symbols (●, □) show the values calculated on the basis of 1H NMR integrals. {cRu(6-p- cymene) = 2.5 mM; T = 25.0 °C; I = 0.1 M (KCl)}
The complex formation of [Ru(6-p-cymene)(H2O)3]2+ with the TSC ligands was found to be fairly slow according to the time-dependent UV-vis spectra recorded at pH 2.5 and 7.4 (see Figure S11 in case of Me-pyrTSC). The chemical equilibrium was reached only within 2 h. In order to overcome this problem, individual samples were prepared by the addition of various amounts of KOH, and the actual pH, the UV -vis and 1H NMR spectra were always measured only after 4 h. Based on the recorded spectra (Figures 4 and S12) it could be concluded that the complex formation proceeds in a great extent already at pH 2. According to the 1H NMR (and UV-vis) spectra no free ligand and organometallic ion are found at pH ~2 with both Me-pyrTSC and Ph- pyrTSC. No complex decomposition was found even at 10 M concentration by UV-
6.15 5.85 d 5.55 5.25
d/ ppm pH
11.36 7.20 6.66 6.16 5.69 4.03 3.23
[Ru(6-cymene)2(OH)3]+ [Ru(6-cymene)(H2O)3]2+
a) b)
100 80 60 40 20 0
Ru%
[Ru(6-cymene)(H2O)3]2+
[Ru(6-cymene)2(OH)3]+
Journal Pre-proof
16
vis spectrophotometry. That is the reason why only a lower limit could be estimated for the formation constants of complexes those are present at this pH (Table 2). Smaller changes are observed in the pH range 2.1 ‒ 4.2 and 10.6 ‒ 12.1 in the UV-vis spectra (Figure S12) with the appearance of isobestic points representing the equilibrium processes between two species in both pH ranges.
Figure 4. Representative 1H NMR spectra recorded for [Ru(6-p-cymene)(H2O)3]2+ ‒ Ph-pyrTSC (1:1) system in the pH range 2.2 ‒ 11.2 in the presence of 0.1 M chloride ions in 30% (v/v) DMSO-d6/water solvent mixture. Symbols: pyrazolyl-CH protons (●,○); thiosemicarbazone –CH= protons (▲,∆);
pyrazolyl N-phenyl CH protons (■,□,♦,◊); p-cymene aromatic CH protons (a-h); free p-cymene (in the blue frame) and non-identified peaks (pink rectangle). {cRu(6-p-cymene) = 0.5 mM; T = 25.0 °C; I = 0.1 M (KCl)}
Two sets of signals of pyrazolyl-CH and the thiosemicarbazone –CH= protons of the coordinated ligand are seen undoubtedly in the 1H NMR spectra (Figure 4). The minor species at pH 2.2 (shown with symbols ● and ▲) becomes predominant with increasing pH and the chemical shifts of its peaks remain constant; while the upfield shift of the peaks belonging to the major species (○ and ∆) is observed in the acidic pH range. On the other hand the peaks of the aromatic CH protons of the p-cymene moiety show quadruplicated signals (as well as the signals of the isopropyl-methyl group). The
●
●
●
●
●
●
●
●
●
○
○
○
○
○
○
○
○
a b c d
a b c d
e f g h
e f g h
e f g h
e g h
e e e
c
∆
∆
∆
∆
∆
∆
∆
∆
pH 11.14 10.16 8.65 7.59 4.20 3.18 2.71 2.37 2.18
9.4 8.8 8.2 7.7 7.3 // 6.0 5.4 d/ ppm
Journal Pre-proof
17
chemically equivalent protons become magnetically inequivalent most probably as a consequence of the restricted rotation of the arene ring. Based on these findings we concluded that in the species predominating at pH 2.2 the ligand is coordinated in its HL form in a mononuclear complex and the deprotonation of the hydrazinic-NH results in the upfield shift of the NMR signals. This process could be characterized by a pKa = 3.44 value (Table 2). The complex characterized by the constant chemical shift is assumed to be a dinuclear species [(Ru(6-p-cymene))2(L)2]2+ in which both ligands coordinate via an (N,S‒) donor set while the sulphur atoms act as -bridging ligands.
The suggested structures of the various complexes are presented in Chart 2. X-ray structures of dimeric -thiolato bridged Ru(6-p-cymene)-TSC complexes in solid phase have been already reported in the literature [56]. Based on the 1H NMR spectral data stepwise stability constants for the formation of the dimeric complexes from the mononuclear species could be computed (Table 2). Notably, the ratio of the peak integrals of the mononuclear and dinuclear species was not changed by varying the metal-to-ligand ratios at pH 2.7 and no other species appeared (besides the unbound organometallic cation or the free ligand at metal or ligand excess, respectively).
However, new peaks were observed at pH > 10.6 and precipitate was also formed most probably due to the formation of a neutral mixed hydroxido species [Ru(6-p- cymene)(L)(OH)] as it was observed in case of the complexes of other bidentate ligand [57]. A low intensity doublet peak appeared at 7.2 ppm that is typical to the free p- cymene representing the release of the arene ligand.
In order to further corroborate the co-existence of the mononuclear and dinuclear species, a dilution series was prepared in the concentration range 11.3‒450 M at pH 7.4 and UV-vis spectra were recorded from which molar absorbance spectra were calculated (Figure S13). As level of dissociation increases with dilution, formation of higher fraction of mononuclear species is favoured at lower concentration compared to the dimer. It was found that the spectral characteristics altered significantly upon dilution suggesting the changed ratio of the mononuclear and dimeric complexes. In addition ESI-MS spectra were recorded for the [Ru(6-p-cymene)(H2O)3]2+ ‒ Ph- pyrTSC system at 4 equivalents of ligand excess (Figure 5). The major species is the mononuclear complex, and some dinuclear and bis-ligand complexes were also found, although formation of the latter species could not be proved by the 1H NMR measurements (vide supra).
Journal Pre-proof
18
Based on the equilibrium constants determined it was concluded that complexes [Ru(6-p-cymene)(HL)(H2O/Cl)]2+/+, [Ru(6-p-cymene)(L)(H2O/Cl)]+/0 (the exact charges of these species are not known due to the partial coordination of the chloride ion) and [(Ru(6-p-cymene))(L)2]2+ are formed at pH 2 ‒ 4.3, while the latter two species are present up to pH ~ 9 (see representative concentration distribution curves in Figure S14). The predominant species is [(Ru(6-p-cymene))2(L)2]2+ at neutral pH. No significant differences in the solution speciation were found between the two studied TSC ligands.
Chart 2. Suggested structures of the Ru(6-p-cymene) complexes of Me-pyrTSC and Ph-pyrTSC.
Exact charges of the mononuclear species are not known due to the partial coordination of the chloride ion.
S Ru
H2O/Cl N
HN
NH2
R
2+/+
S Ru
H2O/Cl N
N
NH2
R
+/0
S Ru N
N
NH2
R S
Ru N N H2N
R 2+
N N
H3C R =
N N
[(Ru(6-p-cymene))2(L)2]2+
[Ru(6-p-cymene)(HL)(H2O/Cl)]2+/+
[Ru(6-p-cymene)(L)(H2O/Cl)]+/0
or
Journal Pre-proof
19
Figure 5. ESI-MS spectra recorded for the [Ru(6-p-cymene)(H2O)3]2+ ‒ Ph-pyrTSC (1:4) system.
Peaks identified: [Ru(6-p-cymene)(L)]+ (a); [Ru(6-p-cymene)(L)2H]+ (b); [(Ru(6-p-cymene))2(L)2‒ H]+ and [(Ru(6-p-cymene))2(L)2Cl]+ (c). {cRu(6-p-cymene) = 5.2 M; cL = 20.8 M; pH ~ 6; 2% (v/v) ethanol/water}
We have attempted to study the solid phase structure of the Ru(6-p-cymene) complexes of the TSCs. Solid complexes [Ru(6-p-cymene)(TSC)Cl]Cl (where TSC = Me-pyrTSC or Ph- pyrTSC) could be obtained from 2:1 mixtures of the ligand and the metal precursor prepared in ethanol:water mixture. Detailed characterization of the synthesized complexes is found in the SI. 1H and 13C NMR spectra recorded for the [Ru(η6-p-cymene) complexes undoubtedly reveal that neither the free metal precursor nor the ligand is present in the solution, peaks assigned exclusively to the complex are observed. Single crystals of mononuclear [Ru(6-p- cymene)(Me-pyrTSC)Cl]Cl (II) complex could be obtained as well and its crystal structure has been determined by single crystal X-ray diffraction. Notably, the isolated complexes contain the neutral ligands coordinated. II crystallized with one chloride counter ion in monoclinic P 21/a space group and its ORTEP representation is depicted in Figure 6 and the unit cell is shown in Figure S15. Disordered structures have been found with disordered positions of the coordinated chlorido ligand as well as the isopropyl group and the phenyl-pyrazol moiety of the ligand (Figure 6, S16-S18).
meas. 556.11 cald. 556.11
(100%)
877.21 877.22 (7.2%)
1111.21 1111.22 (4.5%)
1146.21 1146.19 (1.8%)
550 750 950 1150 m/z
Relativeabundance/ %
100
50
0
a) b) c)
Journal Pre-proof
20
Figure 6. Molecular structure of [Ru(6-p-cymene)(Me-pyrTSC)Cl]Cl (II). Displacement parameters are drawn at 50% probability level. Hydrogen atoms are omitted for clarity.
The two positions are denoted by ’A’ and ’B’ and the occupancy ratio between the two positions was 67% and 33%, respectively. Disordered atoms of C19, C20, C21 and C6B were refined with isotropic displacement parameters. The Cl2 counter ion is involved in a hydrogen bond with N2-H2 proton, and thus this part of the molecule is relatively fixed (Figure S16).
The disordered phenyl rings are turning towards each other forming columns in the crystal where they can occupy two main positions. In the case of the ‘A’ position the phenyl rings are arranged parallel to each other (the angle between the ring planes is 6.5°) and … stacking interaction is formed between the rings (Figure S17.a). For the minor position ‘B’, the phenyl ring planes form an angle of 86.4° in order to evolve a C-H… connection between the neighbouring rings. This interaction is further stabilized by a … stacking interaction between phenyl and adjacent pyrazol rings (Figure S17.b). Hydrogen bonds towards the chloride counter ion stabilize the packing arrangements in the crystal (Figure S18.a) in addition to an intramolecular hydrogen bond between an isopropyl C20A-H20B and chloride ion Cl1A (Figure S18.b). Selected H-bond distances and angles are collected in Table S4. Notably single crystals of [Ru(6-p-cymene)(Ph-pyrTSC)Cl]Cl were also obtained, however the level of disordered structures was even higher (not shown).
3.3. Solution equilibrium and structural studies of copper(II) complexes
Solution stability of Cu(II) complexes of numerous TSCs has been already characterized in our previous works [12-14,24]; however these compounds were tridentate ligands, namely - N-pyridyl TSCs with (N,N,S) or salicylaldehyde TSCs with (O,N,S) binding modes, respectively. Despite the fact that Cu(II) complexes of bidentate TSCs are also widely investigated regarding their anticancer, antibacterial, antiviral properties and solid structures
Journal Pre-proof
21
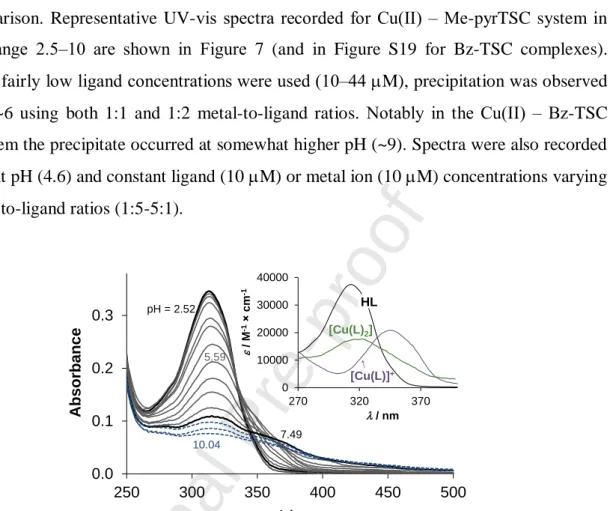
[2,7], solution speciation data are hardly available for them in the literature. Herein complex formation equilibrium processes of Me-pyrTSC and Ph-pyrTSC with Cu(II) were characterized spectrophotometrically in 30% (v/v) DMSO/H2O. Bz-TSC was also involved for comparison. Representative UV-vis spectra recorded for Cu(II) ‒ Me-pyrTSC system in the pH range 2.5‒10 are shown in Figure 7 (and in Figure S19 for Bz-TSC complexes).
Although fairly low ligand concentrations were used (10‒44 M), precipitation was observed at pH > ~6 using both 1:1 and 1:2 metal-to-ligand ratios. Notably in the Cu(II) ‒ Bz-TSC (1:2) system the precipitate occurred at somewhat higher pH (~9). Spectra were also recorded at constant pH (4.6) and constant ligand (10 M) or metal ion (10 M) concentrations varying the metal-to-ligand ratios (1:5-5:1).
Figure 7. UV-vis absorption spectra of the Cu(II) ‒ Me-pyrTSC (1:2) system in the pH range 2.52- 10.04 in 30% (v/v) DMSO/water solvent mixture. (Dashed line show the spectra recorded in the pH range of precipitate formation.) Inset shows the molar absorbance spectra of HL, [Cu(L)]+ and [Cu(L)2] species. {cMe-pyrTSC = 10 M; cCu(II) = 5 M; T = 25.0 °C; I = 0.1 M (KCl); l = 1 cm}
Stability constants for [Cu(L)]+ and [(Cu(L)2] complexes were computed by the deconvolution of the UV-vis spectra obtained for samples without precipitation (Table 3, Figure 7). These data reveal the considerably higher stability of the pyrazolyl complexes compared to that of Bz-TSC species. On the other hand all these bidentate TSCs preferably form bis-ligand complexes, which are neutral species with rather low water solubility.
Significant fraction of bis complexes are present in the solution even at 1:1 ratio (Figure 8.a).
On the contrary the salicylaldehyde TSCs form exclusively mono complexes [14]. However, bis and dinuclear complexes are also formed with -N-pyridyl TSCs besides the predominating mono complexes, but only at ligand excess, and at 1:1 ratio they do not appear
0.0 0.1 0.2 0.3
250 300 350 400 450 500
Absorbance
/ nm
pH = 2.52
7.49 10.04
5.59
0 10000 20000 30000 40000
270 320 370
/ M-1cm-1
/ nm HL [Cu(L)2]
[Cu(L)]+
![Figure 4. Representative 1 H NMR spectra recorded for [Ru( 6 -p-cymene)(H 2 O) 3 ] 2+ ‒ Ph-pyrTSC (1:1) system in the pH range 2.2 ‒ 11.2 in the presence of 0.1 M chloride ions in 30% (v/v) DMSO-d 6 /water solvent mixture](https://thumb-eu.123doks.com/thumbv2/9dokorg/968679.57682/17.892.118.756.312.714/figure-representative-spectra-recorded-presence-chloride-solvent-mixture.webp)
![Figure 5. ESI-MS spectra recorded for the [Ru( 6 -p-cymene)(H 2 O) 3 ] 2+ ‒ Ph-pyrTSC (1:4) system](https://thumb-eu.123doks.com/thumbv2/9dokorg/968679.57682/20.892.229.682.113.404/figure-esi-ms-spectra-recorded-ru-cymene-pyrtsc.webp)
![Figure 6. Molecular structure of [Ru( 6 -p-cymene)(Me-pyrTSC)Cl]Cl (II). Displacement parameters are drawn at 50% probability level](https://thumb-eu.123doks.com/thumbv2/9dokorg/968679.57682/21.892.263.625.113.346/figure-molecular-structure-cymene-pyrtsc-displacement-parameters-probability.webp)
![Figure 9. Molecular structure of [Cu(Ph-pyrTSCH ‒1 ) 2 ] (III). Displacement parameters are drawn at 50% probability level](https://thumb-eu.123doks.com/thumbv2/9dokorg/968679.57682/24.892.118.792.78.970/figure-molecular-structure-pyrtsch-displacement-parameters-drawn-probability.webp)