Salt induced fluffy structured electrospun fibrous matrix
Akos Gyorgy Juhasz, Kristof Molnar, Abdenacer Idrissi, Angela Jedlovszky-Hajdu
PII: S0167-7322(20)30813-8
DOI: https://doi.org/10.1016/j.molliq.2020.113478
Reference: MOLLIQ 113478
To appear in: Journal of Molecular Liquids Received date: 7 February 2020
Revised date: 26 May 2020 Accepted date: 27 May 2020
Please cite this article as: A.G. Juhasz, K. Molnar, A. Idrissi, et al., Salt induced fluffy structured electrospun fibrous matrix, Journal of Molecular Liquids (2020), https://doi.org/10.1016/j.molliq.2020.113478
This is a PDF file of an article that has undergone enhancements after acceptance, such as the addition of a cover page and metadata, and formatting for readability, but it is not yet the definitive version of record. This version will undergo additional copyediting, typesetting and review before it is published in its final form, but we are providing this version to give early visibility of the article. Please note that, during the production process, errors may be discovered which could affect the content, and all legal disclaimers that apply to the journal pertain.
© 2020 Published by Elsevier.
Journal Pre-proof
Salt induced fluffy structured electrospun fibrous matrix
Akos Gyorgy Juhasz 1,2, Kristof Molnar 1,3, Abdenacer Idrissi 2, Angela Jedlovszky-Hajdu 1
1 Semmelweis University, Department of Biophysics Radiation Biology, Laboratory of Nanochemistry, Budapest, Nagyvárad tér 4., 1089, Hungary
hajdu.angela@med.semmelweis-univ.hu
2 University of Lille, Faculty of Sciences and Technology, Chemistry Department, Laboratory of Infrared and Raman Spectrochemistry, Bâtiment C5, Cité Scientifique, Villeneuve d’Ascq, 59655
France
nacer.idrissi@univ-lille.fr
3 Department of Food, Agricultural and Biological Engineering, College of Food, Agricultural, and Environmental Sciences, The Ohio State University, 222 FABE, 1680 Madison Avenue,
Wooster, OH 44691
Journal Pre-proof
Abstract:
Electrospinning is a widely investigated and used technique for creating nano and microfibres which has a wide range of medical and pharmaceutical applications. For cell culturing and tissue engineering, it is a greatly investigated method because it resembles the extracellular matrix.
Changing the electrospinning parameters we affect the properties of these systems to fine-tune it for our needs. To create a high porosity fibrous mesh for culturing different cells in a suitable three-dimensional way, we need to step forward from conventional electrospinning.
In this paper, we are presenting a strategy involving the addition of inorganic salts to electrospinning solution to reproducibly synthesize nano and microfibrous fluffy 3D structures from polysuccinimide (a biocompatible and biodegradable polymer). Effect of different concentrations of LiCl, MgCl2 and CaCl2 on fibre properties are presented. Results show that the 3D structured fibrous meshes were produced in the presence of LiCl, MgCl2 or CaCl2 in a narrow concentration range. To understand the effect of salt on the resulting meshes characterization of the ion-ion and ion-solvent interactions were carried out using vibration spectroscopy and density functional theory calculation.
Keywords: polysuccinimide, 3D electrospinning, inorganic salt, fluffy
structure, spectroscopy
Journal Pre-proof
1. Introduction
Ever since Formhals introduced the idea of electrospinning to the scientific community it has been one of the most investigated and used methods for the preparation of nano- and microfibres in research [1]. In basic solvent-based electrospinning, a polymer solution is fed through a metal needle on high DC voltage and a grounded metal collector is placed in front of it. If the developing electric field strength is strong enough, a thin polymer jet emerges and travels in the direction of the collector, and in a whipping movement it is elongated, thinned and its solvent evaporates. At the end of the process, one can obtain a web of randomly oriented fibres [2]. However, by using fast rotating mandrel collector or 3D printed collectors, fibres with different orientations or web morphologies could be prepared as well [3], [4]. There is a wide variety of applications of such fibrous materials ranging from industrial filters, through energy materials to drug delivery and biomedical implants [5]–[8].
These fibrous meshes are exceptionally investigated for cell culturing and tissue engineering since the fibrous structure can resemble the backbone of the human soft tissue, called extracellular matrix (ECM). ECM is a similarly fibrous substance consisting of collagen fibres [9], [10]. With thorough research and choice of polymeric material, fibre diameters and surface properties can be fine-tuned to fulfil the requirements for maintaining different cells ranging from fibroblasts to stem cells [11], [12]. Electrospun fibre meshes are often considered 3D objects (just like natural ECM) as compared to the lower than a few micron fibre diameters, the thickness of these meshes is very big [10]. However, the fibres are tightly packed creating very small pore sizes inevitably hindering cells from entering the inner layers of the matrix.
Although cell culturing is still feasible and often give better results than standard cell culturing plates, cells still cannot obtain their natural 3D morphology, unless they enter the matrix [13], [14]. An effort has been made for raising the pore size between the fibres in the mesh, thus loosening it up to provide cells with a platform, in which free migration is possible. As of now, there are two strategies for preparing loose, fluffy fibrous samples: physical and chemical methods. We consider all the methods physical, where real 3D is achieved by changing collector geometries or using outer electrodes. Nice collections of these techniques can be found in the article by Wu et al., Sun et al. and Rnjak-Kovacina et al. [15]–[17]. These include but not limited to using a liquid bath collector; cryogenic, where water crystals are developing between the fibres and they are freeze-dried post spinning; ultrasonication; custom-made ball-shaped
Journal Pre-proof
collectors; salt leaching, where salt crystals are deposited during-, and dissolved post electrospinning, layering, etc. [18]–[24]. Chemical techniques involve changing solution properties by changing the solvent composition or by the addition of salts or other chemicals:
Lee et al. introduced gas foaming, where ammonium bicarbonate and sodium chloride is added to the solution to “blow up” the mesh after heating it to 90 oC post spinning [25]. Our group has shown that the addition of magnetite nanoparticles can also cause the electrospun fibres to be collected in real 3D [26]. Also, the addition of Multi-Walled Nano Tubes (MWNT) to poly(acrylonitrile) resulted in fluffy structures [27].
Another interesting method is the addition of salts to the electrospinning solution [28], [29]. Salts raise the conductivity of the electrospinning solution leading to lower surface resistivity and higher surface charge. Cai et al. hypothesize that as the jet touches the oppositely charged collector, the charges from the fibres go away rapidly, thus reducing the attraction between the collector and fibres, while the fibres may be recharged by the collector, causing them to repel each other [27]. In contrast to this, Yousefzadeh et al. say that due to the high conductivity the highly charged fibres are the ones repelling each other leading to fluffiness [30].
However, salt addition not always leads to lose structures. Song et al. experimented with rotating mandrel collector and the addition of different salts to the polymer solution (Ca(NO3)2, MgCl2, CaCl2) [31]. They found that without salts they could collect randomly oriented fibres on the collector at 750 rpm rotating speed, but salt addition caused the orientation of fibres at the same speed. They conclude that the higher surface charge led to stronger pulling toward the collector (also thinner fibres) as well as faster electrospinning, both causing fibre orientation. Zhang et al.
prepared porous polyethersulfone fibres with the addition of CaCl2 but no 3D structure was reported [32]. Therefore, we aimed to investigate the possibility of preparing fluffy structures from polysuccinimide (PSI) by the addition of different salts to the spinning solution and understanding the interaction between the solvent components leading to 3D structures. PSI is a biocompatible and biodegradable polymer synthesized from aspartic acid, which can be electrospun easily to form 2D structures [33]. At pH 7.4 it undergoes hydrolysis turning into poly(aspartic acid) (PASP) [34]. Therefore it has gained interest in bio-based research for different applications [35], [36]. The only limiting factor of using PSI, that the solubility is limited, the best solvent for electrospinning is DMF.
Journal Pre-proof
It is well established that in the electrospinning method, mixtures of different salts in dimethylformamide (DMF) (in addition to the spinning conditions, the polymer concentration, the geometry of the electrospinning set up, the electric field strength) affect the fluffy 3D structure of some polymers [37]–[39] Different hypotheses were postulated associating the salt effect with the faster solvent evaporation due to the increase of the conductivity [38]. In another work, based on IR and rheological measurements, the authors conclude that the addition of salts induces a decrease of both viscosity and hydrogen bonding in the mixtures and this results in defect-free nanofibres [39]. Lu et al. [40], showed that the diameters of fibres depend on the nature of the solvents. The results show that in the case of Ca2+ and Fe3+ cations the orientation relaxation of the polymer in a given solvent correlates with a small diameter of the fibre. In another work by Zong et al. it was shown that the concentration and salt addition was found to have a relatively larger effect on the fibre diameter than the rest of the parameters [38]. Finally, in a simulation work [41], the rate of evaporation of the solvent improves the mixture spinnability and also reveals that the ions are coordinated by the polymer chains and when these ions are accelerated the stretching of the polymer is efficient.
Thus in this paper, we used PSI as a potential biocompatible polymer to create fibrous structure at the presence of different inorganic salts. The focus of the research was to create 3D fluffy structure form PSI in a reproducible way. The presence of inorganic salts in different concentrations causes some effect between the fibres during the electrospinning procedure which is not described in the literature yet. Using FTIR spectroscopy and density functional theory calculation (DFT) we explain the effect of the salt in the solvent (dimethylformamide) and the structural changes of the fibrous mesh by macroscopic and SEM (Scanning Electron Microscopy) images.
2. Materials and methods
N,N-dimethylformamide (DMF) (Lach-Ner), MgCl2 (Reanal), CaCl2 (Reanal), LiBr (Acros Organics), NaBr (Sigma-Aldrich), NaI (VWR), KI (VWR), KBr (VWR), LiCl (Sigma- Aldrich). Polysuccinimide (PSI) was synthesized based on our previous paper [26] and had a viscometry average molecular weight of 28500 ± 3000 g/mol.
Journal Pre-proof
2.1. Salt-polymer solutions
For the electrospinning experiments salt solutions were prepared the following way: first, salts were dissolved in DMF with concentrations ranging from 1-10 w/w%, depending on their solubility [42]. The compositions of salt solutions can be found in Table 1. Then PSI was added to have a 25 w/w% polymer solution. In all cases 1 mL of solution was prepared.
Table 1 Compound of inorganic salt – DMF solutions, where green colour highlights the salts inducing 3D fluffy structure in a reproducible way, whereas the blue and grey colours indicate
those for which neither the 2D or the 3D structures are reproducible.
2.2. The conductivity of salt solutions
The conductivity of salt solutions was measured with a Thermo Scientific Orion 4-Star Benchtop pH/conductivity meter with a Thermo Orion 013605MD conductivity cell. In every case, 10 mL of DMF-salt solution was measured with 1, 3 and 5 w/w% concentrations.
2.3. Electrospinning setup
The electrospinning machine consisted of a Genvolt 73030P power supply, a KD Scientific KDS100 pump, a Fortuna Optima 7.140-33 type syringe and a Hamilton G18 blunt end steel needle (Figure 1). The collector was a 3D printed disc of 2 cm diameter, which was aluminium coated with Schuller Eh‟klar‟s Prisma Color 100% Al spray to be conductive. The distance of the needle and the collector was kept at 10 cm in all cases.
Salt name LiCl mol/l
DMF MgCl2
mol/l
DMF CaCl2
mol/l
DMF LiBr NaBr NaI KI
1 0.23 1 0.1 1 0.09 1 1 1 1
2 0.46 2 0.2 2 0.17 3 3 3 3
4 0.93 3 0.41 3 0.26 5 5 5 5
5 1.18 4 0.52 4 0.36
6 1.43 5 0.64 5 0.45
8 1.94 6 0.87
10 1.11
Concentration in DMF (w/w%)
Journal Pre-proof
Figure 1 Schematic of the electrospinning process
Throughout the electrospinning process, the needle was connected to the positive plug of the power supply and the ground plug was connected to the collector. A small drop of the polymer was pumped out from the needle to instantly start the electrospinning when the voltage was applied. The flow rate was set to 1 mL/h and the applied voltage was 15 kV in all cases.
2.4. Scanning Electron Microscopy (SEM)
A ZEISS EVO 40 XVP SEM machine with an INCA energy dispersive X-ray detector was used to create SEM recordings on the fibres. 20kV acceleration voltage was applied. The samples were fixed into a two-sided carbon tape. Then, 20 – 30 nm thick layer was coated with palladium or gold with the help of a 2SPI Sputter Coating System. The average fibre diameter is given in every case with the error calculated at p=0.05 confidence level and was determined from measuring 100 individual fibres with ImageJ Software. For comparing the averages double- sided, two-sample Student t-tests were conducted using the averages and standard deviations of the samples. It was assumed that the fibre diameter shows a normal distribution.
2.5. Attenuated Total Reflectance Fourier-Transform Infrared Spectroscopy (ATR FT-IR)
The ATR-FTIR spectra of the DMF - salt solutions were recorded with a BRUKER Vertex 70 FT-IR instrument. In every case, 64 recordings were averaged from scans made between 5000 and 600 cm-1 with a resolution of 2 cm-1. For recording the spectra and baseline corrections the OPUS 7.5 software was used. OriginPro 2015 9.2 software was used for spectral characterization. The spectra of the fibrous meshes were recorded with a JASCO FT/IR-4700
Journal Pre-proof
spectrophotometer fitted with an Attenuated Total Reflection (ATR) accessory (JASCO ATR Pro One). Spectra were collected in a range of (4000 cm-1 – 400 cm-1) with a resolution of 2 cm-1 and the number of scans was 126. The baseline of the spectra was corrected by using JASCO spectra analysis program.
Deconvolution of the spectra were carried out with Microsoft Excel and its built-in Solver plugin. Gaussian curves were fitted for the peaks and Lorentzian where shoulders appeared.
2.6. Density functional theory calculation
The optimized configurations of ions and DMF complexes were obtained in a polar medium treated via implicit solvent approach. As the dispersion plays an important role in describing the interionic and ions-DMF interactions, we used the M06-2X functional to better take into account the medium-range dispersion effect. This functional was coupled with 6- 311+g(d,p) basis set [43].
The geometry optimizations were followed by harmonic frequency analysis to ensure that the obtained structure was true minima by the absence of imaginary wavenumber and to rationalize the experimental results in terms of the obtained optimized configurations.
Density functional theory calculations were conducted using Gaussian 16 software package. [44]
Visualization was performed with Gaussview 6.
Journal Pre-proof
3. Results and discussion
In the first part, we are focusing on salt – DMF interaction than on results related to electrospinning and fluffy meshes.
3.1 Characterization of the salt solutions
The salts were chosen depending on their solubility in DMF based on the IUPAC Solubility Data [42]. A series of solutions were prepared from the different inorganic salts (Table 1).
After the complete dissolution of the salts, the solutions were transparent but, in some cases, (KI, NaI and MgCl2) the colours deepened with respect to the salt concentration. When the suggested solubility could not be reached crystal growth was observed (Figure S1).
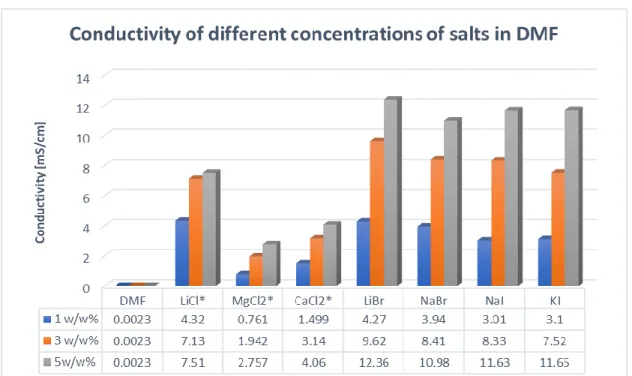
The conductivity is a key parameter in electrospinning affecting fibre properties or even the possibility to produce fibres [45]. The measured conductivities are displayed in Figure 2. As it can be seen, an increase in salt concentration induces higher conductivity in every case.
However, the extent of increase of the conductivity values is dependent on the ions pairing in the mixture. It is important to note, that in the case of salts, where the anions are iodide and bromide, the conductivity is much higher (above 8 mS/cm) compared to salts with chloride as an anion.
From the biological point of view, chloride is a more suitable co-ion in the living system, thus we continued our experiments just with LiCl, MgCl2 and CaCl2.
Journal Pre-proof
Figure 2 Conductivities of the different salt solutions, where ‘*’ refers to the salts which produced 3D structures in electrospinning
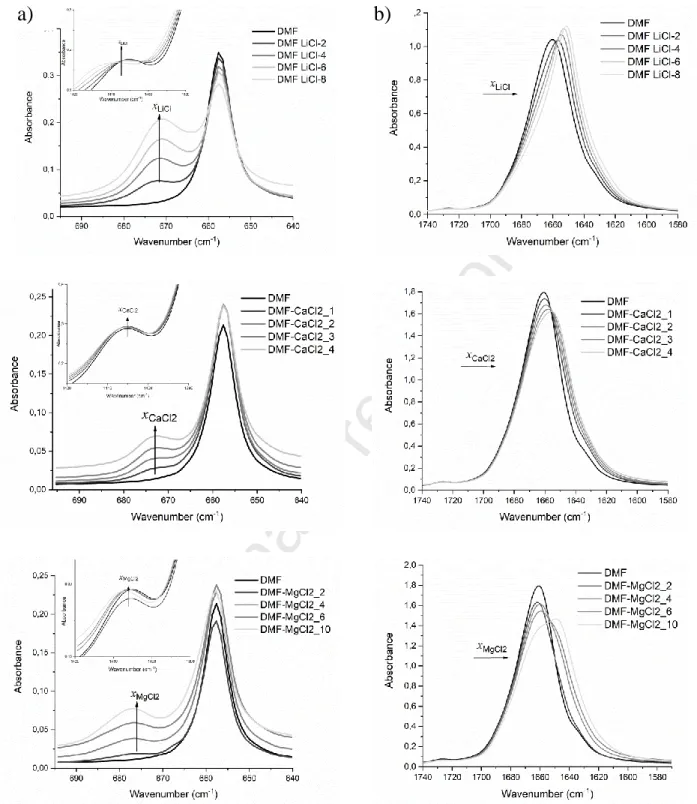
To have information at the molecular level on the ion-ion and ion-DMF solvent interactions, we recorded the IR spectra of these mixtures (Figure 3 and S2). Vibration spectroscopy has been proven to be an efficient tool for investigating the ion-ion and ion – solvent interactions through the changes in the shape of specific vibration modes (changes of frequency, intensity and peak width) [46]–[49]. DMF has two distinct vibration modes (C=O stretching, and the NCH=O bending vibration modes, at 1667 cm-1 and 661 cm-1, respectively), that can be analysed to get information s from its dependence on the salt concentration [47], [49]–[52] on the solvation shell of the ions. Figure 3a and 3b show the FTIR spectra regions of the C=O, the NCH=O and the C-H (in the inset) bending vibration modes at various concentration of LiCl, MgCl2 and CaCl2.
Journal Pre-proof
Figure 3 IR spectra of the NCH=O a) and the C=O b) vibration modes in mixtures of LiCl (2, 4, 6 and 8 w/w%) CaCl2 (1, 2, 3 and 4 w/w%) and MgCl2 (2, 4, 6 and 10 w/w%) with DMF
In principal the intense C=O vibration is very asymmetric and is skewed negatively, which may be associated with the presence of spectral contribution at the lower wavenumber
a) b)
Journal Pre-proof
side (~1640 cm-1). As it is shown in Figure 3 b), this vibration mode is shifted toward lower wavenumbers upon coordination by Li+, Ca2+ or Mg2+. However, the extent of the downshift of this wavenumber is difficult to assess as this vibration mode is strongly overlapping with both the overtone of the C-N vibration mode (Fermi coupling) that weakly appears at 865 cm-1 and the C-H deformation [48], [53]–[59]. Many mechanisms, such as dipole – dipole interactions, the failure of the above mentioned Fermi-coupling condition, specific interactions with the cation through the O atom, prevent any unambiguous use of the C=O vibration mode to analyse the ions-DMF interactions. Instead, the NCH=O bending peak is suitable for the ions-DMF interactions. Effectively, when adding the salt to DMF, a new broad spectral contribution emerges at the higher wavenumber (named here after new peak, ~675 cm-1) side of the main NCH=O bending peak (named here after main peak, ~660 cm-1). This new peak (the intensity of which is named IH at higher wavenumbers) is associated with the complex formed between DMF and the salt, whereas the main peak (the intensity of which is named IM) is associated with DMF molecules that are not involved in this complex or by distant molecules from the salt ions [48], [50], [65], [51]–[53], [60]–[64]. To quantify the changes in this range of wavenumber domain, we fitted this spectral region hypothesizing two spectral contributions, the position and the intensity of which are given in Figure 4a for each salt-DMF mixtures. This figure shows that the position of the main peak is affected neither by the nature of the salt nor by its concentration.
This is consistent with the interpretation that this peak is mainly associated with DMF molecules that are surrounded mainly by DMF molecules (the salt being at a farther distance from a reference DMF molecule).
The position of the new peak, which is at the higher wavenumber, is dependent on the nature of the salt. The large upshift is observed in the MgCl2 salt-DMF mixture, which indicates that the DMF molecules are tightly bound to MgCl2, than with LiCl and CaCl2 salts. A similar trend was observed by Forero et al. in the case of the mixture of DMF and salts with the same cations coupled with bis(trifluoromrthansulfonyl)imide (TFSI, anion [60]. However, they found a much larger shift compared to our data. This indicates that this new peak, which is at higher wavenumber is associated with both the cation and the anion interacting with DMF.
Journal Pre-proof
Figure 4 The concentration dependence (a) of the position of the higher (new) peak and the main wavenumbers of the NCH=O bending mode. This position was obtained by a fitting process of this vibration. The symbols △ and ▲ are describing the new and the main peak for LiCl mixtures, ○ and ● for CaCl2 and □ and ■ for MgCl2 (b) of the ratio between the highest wavenumber fitted spectral contribution intensity, IH, and the main one, IM. ▲ for LiCl mixtures,
● for CaCl2 and ■ for MgCl2
As it is shown in Figure 4a, the position of the new peak‟s salt concentration dependence is weak. We noticed that at high concentrations of LiCl, the position of this peak is the lowest indicating a weak ion-DMF interaction. One of the parameter, that quantifies the ion-DMF interac tions strength is the ratio Z/rc proposed by Waghorne et al. [65], where Z and rc are the cation charge and its radius respectively [66]. The values of this ratio are 1.67, 2.02 and 3.08, for Li+, Ca2+ and Mg2+, respectively. These results suggest that the ion-DMF interactions are the strongest for MgCl2 salt and this results in the highest wavenumber shift as it is shown in figure 4a.
The concentration dependence of the experimental intensity ratio between the new peak, IH and that of the main peak, IM, is shown in Figure 4b. It shows that the population of the DMF molecules that are close to the cation increases with respect to that of bulk DMF molecules, having DMF molecules in their environment and then are too far to be influenced by the cation.
Also, it indicates that there are more DMF molecules in complex with Li+ cation than with Ca2+
and Mg2+ cations.
a) b)
Journal Pre-proof
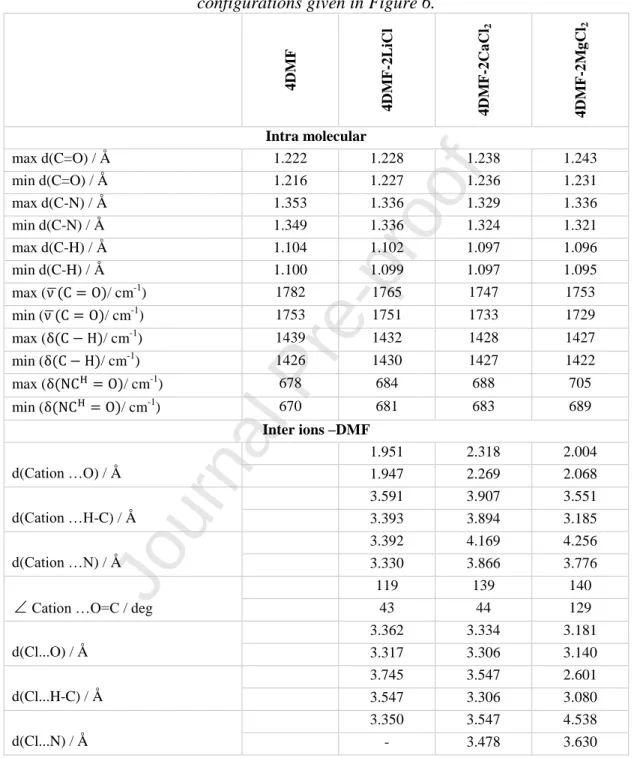
To establish the main peculiarities of the intermolecular interactions in salt-molecular solvent mixtures, DFT calculations have been performed on a set of representative configurations. These configurations were constructed to simulate different environments at the lowest computational cost. The first configuration is formed by 4 DMF molecules and the three other configurations include each, a pair of LiCl, MgCl2 and CaCl2 with 4 DMF molecules. They are intended to mimic the conditions of pure DMF and very high concentration (saturated) of the DMF-salts mixtures. The optimized geometries are shown in Figure 6. Contrary to most of the published calculations [46], [49], [67], we included the anion in these configurations. Because of the limited number of ions and DMF molecules considered, one should distinguish between the geometrical and wavenumber values involving atoms located at the border of these configurations (which are then not involved in the interaction with their environment) and those located in the core of these configurations (and then experiencing interactions with their neighbours). Table 2 contains the values of the maximum and minimum values of the intramolecular distances and the C=O, C-H and NCH=O modes‟ frequencies. For the intermolecular distances, describing the ion-DMF interactions, we reported the two lowest values.
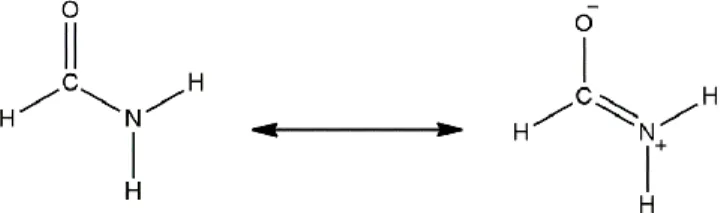
In order to explain the preferential interactions between the cation or the anions with the DMF molecules, we considered the DMF structure in terms of resonance, shown in Figure 5. It indicates that the negative and positive charges are located at the oxygen and nitrogen atoms, respectively. This is accompanied by a decrease in the C=O and an increase in the C-N intramolecular distances. The variation in the intramolecular distances can be used as indicators of the strength of the ion-DMF interactions.
Figure 5 Resonance structure of DMF molecule.
We noted the values of these intramolecular distances from the four configurations and reported them in Table 2. In the following analysis, the values of these intramolecular distances in 4DMF configuration are considered as reference values. The intramolecular C=O, C-N and C- H (of the amide group) distances increase/decrease in the following order LiCl2 < CaCl2< MgCl2.
Journal Pre-proof
Consistently, the corresponding C=O, C-H and NCH=O wavenumber values increase for the latter mode and decrease for the former ones. The behaviour of the intramolecular distances and their corresponding frequencies leads to rank the salt-DMF interactions in the same order cited previously.
Figure 6 Optimized geometries for a) 4DMF b) 4DMF - 2LiCl c) 4DMF – 2MgCl2 d) 4DMF – 2CaCl2. Important interatomic distances in Angstrom are indicated with dotted lines
The distances between the ions and the O, N and H atoms of the NCH=O amide moiety is a result of the balance between their electrostatic repulsive and attractive interactions. These distances are reported both in Figure 6 and with more details in Table 2. The analysis of these
a) b)
c) d)
Journal Pre-proof
values suggests the following general trend: the cation is closer to the O atom than the anion, while the anion is closer to the N atom than the cation.
Table 2 Intramolecular inter ions and atoms of DMF as obtained by DFT calculations on the configurations given in Figure 6.
4DMF 4DMF-2LiCl 4DMF-2CaCl2 4DMF-2MgCl2
Intra molecular
max d(C=O) / Å 1.222 1.228 1.238 1.243
min d(C=O) / Å 1.216 1.227 1.236 1.231
max d(C-N) / Å 1.353 1.336 1.329 1.336
min d(C-N) / Å 1.349 1.336 1.324 1.321
max d(C-H) / Å 1.104 1.102 1.097 1.096
min d(C-H) / Å 1.100 1.099 1.097 1.095
max ( ̅ / cm-1) 1782 1765 1747 1753
min ( ̅ / cm-1) 1753 1751 1733 1729
max ( / cm-1) 1439 1432 1428 1427
min ( / cm-1) 1426 1430 1427 1422
max ( / cm-1) 678 684 688 705
min ( / cm-1) 670 681 683 689
Inter ions –DMF
d(Cation …O) / Å
1.951 2.318 2.004
1.947 2.269 2.068
d(Cation …H-C) / Å
3.591 3.907 3.551
3.393 3.894 3.185
d(Cation …N) / Å
3.392 4.169 4.256
3.330 3.866 3.776
Cation …O=C / deg
119 139 140
43 44 129
d(Cl...O) / Å
3.362 3.334 3.181
3.317 3.306 3.140
d(Cl...H-C) / Å
3.745 3.547 2.601
3.547 3.306 3.080
d(Cl...N) / Å
3.350 3.547 4.538
- 3.478 3.630
In order to explain the trend in the C=O vibration mode in the salt-DMF mixtures, we considered both the intermolecular distance between the cation and the O atom and the angle
cation …O=C the values of which are shown in Table 2. The analysis of these two parameters
Journal Pre-proof
indicate that the shift of the C=O vibration mode is in general determined by the orientation of the cation with respect to the C=O bond. This means that the larger this angle is (the configuration tends to be linear), the larger the extent of the shift gets. The C=O vibration mode behaviour also correlates with the ratio Z/r proposed by Waghorne et al. [65], where r, in this case, is equal to that distance between the cation and the O atom of DMF as obtained by our DFT calculations (see table 2). The values of this ratio are 0.51, 0.68 and 0.99 for Li+, Ca2+ and Mg2+, respectively. This correlates with the fact that the C=O vibration mode in MgCl2 undergoes an important downshift.
In the case of the C-H bending mode (~1400 cm-1), the extent of the low wavenumber shift is correlated with the short distance between the anion and the H atom. As this distance is shorter in the case of MgCl2, the calculated C-H bending is the lowest.
Because of the strong overlap with another vibration mode, it is difficult to rationalise the higher wavenumber shift of the NCH=O bending. Its behaviour is a balance between the effect of both the cation (through its preferential interactions with the O, and H atoms of NCH=O) and the anion (through its interaction with the same atoms). Indeed, in the case of MgCl2, the NCH=O vibration that is calculated to be the highest one among the studied salts is explained by the short distance of the cation from the O and H atoms compared to that involving the anion.
3.2 Creating fibrous meshes using electrospinning
After the careful characterization of the salt-solvent solutions, fibrous structure preparation was attempted. As it was mentioned in the introduction, only a few publications show 3D fluffy electrospun meshes. The reproducibility was never mentioned in these papers, thus our other aim was to synthesize the meshes in a reproducible way. In the beginning, all kind of inorganic salts mentioned in Table 1 were tested for fibre formation. The iodide and bromide containing salts never produced fluffy structures (Figure S3). Those samples showed the well- known planar form on the target (Figure S3). Thus, in this chapter we again focus only on LiCl, MgCl2 and CaCl2, which electrospinning resulted in fluffy 3D structures in a reproducible way.
As it can be seen on Figure 7 and S4 the macroscopic structure looks roughly the same in all 3 cases. SEM showed that fibres had smooth surfaces and homogenous thicknesses.
In the case of MgCl2 we experienced gelation during the electrospinning. This phenomenon is well-known in polymer science and medical science for both Mg2+ and Ca2+ ions,
Journal Pre-proof
both of them create physical crosslinks between polymer chains resulting in a gel-like structure [68]. In our system, the Mg2+ created an inhomogeneous structure during the fibre formation.
Although the fluffy structure formation was reproducible, the fibre formation changed in time parallel with fibre diameter.
It is worth to note that LiCl also caused gelation above 3 w/w% concentration, but below that the fluffy structure clearly appeared without any viscosity increase in time as Figure 7 shows. For MgCl2 the 3D structure appeared just when the concentration reached the 1 w/w%
whereas above 3 w/w% salt content the gelation happened roughly immediately after mixing the solution with the polymer, prohibiting electrospinning. The fluffy structure was inhomogeneous at every salt concentration using MgCl2, but the created structure was more compact than the LiCl created meshes. From the reproducibility point of view, CaCl2 at 1-3 w% concentration range gave the best results. In all concentration the CaCl2 created fluffy and sponge-like structure. At the highest concentration (3 w/w%) the 3D expansion was the highest compared to any other compounds (Figure S5). After turning off the electric field the meshes collapsed a little (less than 10%), but from then on kept their shape and structure for more than 1 year now.
To compare the molarity of the different salts (Table 1), the only obvious thing, that the CaCl2 and MgCl2 containing systems form 3D fluffy structure at very low concentration (~0.1 mol/l DMF) compared to the LiCl. In the case of LiCl 0.23 mol/l DMF was necessary to get similar fluffy result. If we use the parameter, that quantifies the strength of the interaction between the DMF and the cation, (the ratio Z/r proposed by Waghorne et al. [65], where Z and r are the cation charge and its radius respectively [66] – explanation in chapter 3.1) 1.67, 2.02 and 3.08, for Li+, Ca2+ and Mg2+, respectively, it gives a better view on the molarity. Especially we can explain, that the Mg2+ and Ca2+ cations, in which ionic radius is a little bit higher or equal with the Li+‟s, but in both cases the charge is double, can cause a 3D effect at lower molarity.
The interaction between the cation and the DMF molecule strongly depends on the charge (specific charge –ionic radius is the same, but the charge is double), thus half of the number of mol‟s is enough to give the same fluffy result.
Journal Pre-proof
Figure 7 Macroscopic picture of the 3D effect of different salts used and their SEM pictures on the right a) LiCl 1 w/w% b) MgCl2 1 w/w% c) CaCl2 2 w/w%. The scale on the SEM images
correspond to 2m.
The fibre diameter analysis data is collected in Table 3. For both LiCl and CaCl2 there was no significant difference between 1 and 2 w/w%. However, for MgCl2 all 3 concentrations were significantly different, with 2 w/w% seemingly out of range. Similarly, 3 w/w% CaCl2 caused a significant rise in the diameter, however, it also seems out of range. According to the data available and statistical analysis, it seems that there is little to no effect of salt concentration on the average diameter.
Table 3 Size distribution of different fibres containing salts
Diameter [nm]
Name of the salt 1 w/w% 2 w/w% 3 w/w%
LiCl 570±160 615±100 NA
MgCl2 470±130 1230±200 625±110 CaCl2 660±220 675±110 950±150
Journal Pre-proof
After the macroscopic and microscopic evaluation, we performed spectroscopic analysis using ATR-FTIR instruments. There were no differences between the spectra of the pure PSI fibres and the ones with salts. (Figure S5). The representative peaks of polysuccinimide appears at 1710 cm-1 (asymmetric stretching vibration is attributed to the νCO of –(OC)2N–), 1391 cm-1 (C–O bending vibration, δ) and 1355 cm-1 (stretching vibration, νC–N of –(OC)2N–) which are the bands of imide rings in PSI as we published previously [33], [35]. The only observable difference appeared around the OH vibrational bands at 3300-3600 cm-1, which can be attributed to the adsorbed water content of the meshes. None of the salts can be detected on the dry form and there were no traces of DMF. Consequently, based on the FTIR spectra there are no detectable chemical interaction between the salt and the polymer, at least not above the detection limit of the instrument.
As the results showed the main difference between the fibre formation is based on the salt quality itself and the interaction between the salt and the solvent. Thus, after creating the fibre the difference is not observable in the spectrum anymore because of the evaporation of the solvent, only the fibre diameter referred for the presence of the salt.
Journal Pre-proof
4. Conclusions
It is already known from the literature that the addition of salts to a polymer solution used in electrospinning might cause real 3D collection of fibres resulting in loose and fluffy meshes.
Effort was made to understand what part the salts take in the production of these structures. FTIR and computational investigation showed that there is a strong interaction between their respective ionic components and DMF, new peaks appeared on the spectra depending on the strength of the interaction. Furthermore, according to our data the most important thing is the quality of the salt (both charge and size of the cation has a strong effect) and through that its interaction with the solvent used for electrospinning. Interestingly, no correlation was found between the fibre diameter and the concentration of the salt.
Based on these findings, fluffy 3D structured meshes of polysuccinimide were prepared reproducibly with CaCl2, MgCl2 and LiCl. The DFT simulation and the FTIR analysis proved that there is interaction between the solvent (DMF) and the ions used, that strongly depends on their quality. This indicates that the reason why the presence of salts causes 3D fluffy structure during electrospinning, might not be just because of charge accumulation (as described in the literature), but also because of solvent-ion interactions.
5. Acknowledgement
This study was supported by the National Research, Development and Innovation Office – NKFIH FK 124147, the János Bolyai Research Scholarship of the Hungarian Academy of Sciences and by the ÚNKP-19-4-SE-04 new national excellence program of the Ministry for Innovation and Technology.
6. References
[1] A. Formhals, “Process and apparatus for preparing artificial threads,” 1,975,504, 1934.
[2] A. Greiner and J. H. Wendorff, “Electrospinning: A Fascinating Method for the Preparation of Ultrathin Fibers,” Angew. Chemie Int. Ed., vol. 46, no. 30, pp. 5670–5703, 2007, doi: 10.1002/anie.200604646.
Journal Pre-proof
[3] A. Barhoum, K. Pal, H. Rahier, H. Uludag, I. S. Kim, and M. Bechelany, “Nanofibers as new-generation materials: From spinning and nano-spinning fabrication techniques to emerging applications,” Appl. Mater. Today, vol. 17, pp. 1–35, Dec. 2019, doi:
10.1016/j.apmt.2019.06.015.
[4] I. González de Torre, A. Ibáñez-Fonseca, L. Quintanilla, M. Alonso, and J. C. Rodríguez- Cabello, “Random and oriented electrospun fibers based on a multicomponent, in situ clickable elastin-like recombinamer system for dermal tissue engineering,” Acta Biomater., vol. 72, pp. 137–149, 2018, doi: 10.1016/j.actbio.2018.03.027.
[5] S. Jiang, H. Hou, S. Agarwal, and A. Greiner, “Polyimide Nanofibers by „Green‟
Electrospinning via Aqueous Solution for Filtration Applications,” ACS Sustain. Chem.
Eng., vol. 4, no. 9, pp. 4797–4804, Sep. 2016, doi: 10.1021/acssuschemeng.6b01031.
[6] Q. Liu, J. Zhu, L. Zhang, and Y. Qiu, “Recent advances in energy materials by electrospinning,” Renew. Sustain. Energy Rev., vol. 81, pp. 1825–1858, Jan. 2018, doi:
10.1016/J.RSER.2017.05.281.
[7] X. Hu, S. Liu, G. Zhou, Y. Huang, Z. Xie, and X. Jing, “Electrospinning of polymeric nanofibers for drug delivery applications,” J. Control. Release, vol. 185, no. 1, pp. 12–21, 2014, doi: 10.1016/j.jconrel.2014.04.018.
[8] D. Kai, S. S. Liow, and X. J. Loh, “Biodegradable polymers for electrospinning: Towards biomedical applications,” Mater. Sci. Eng. C, vol. 45, pp. 659–670, 2015, doi:
10.1016/j.msec.2014.04.051.
[9] X. Zhao et al., “Functional and Biomimetic Materials for Engineering of the Three- Dimensional Cell Microenvironment,” Chem. Rev., vol. 117, no. 20, pp. 12764–12850, 2017, doi: 10.1021/acs.chemrev.7b00094.
[10] D. Seliktar, M. Chen, R. Xu, M. Rubert, M. B. Taskin, and F. Besenbacher, “hiPS-MSCs differentiation towards fibroblasts on a 3D ECM mimicking scaffold,” Sci. Rep., vol. 5, no. 1, pp. 1–7, 2015, doi: 10.1038/srep08480.
[11] T. Hodgkinson, X.-F. Yuan, and A. Bayat, “Electrospun silk fibroin fiber diameter influences in vitro dermal fibroblast behavior and promotes healing of ex vivo wound models.,” J. Tissue Eng., vol. 5, p. 2041731414551661, 2014, doi:
10.1177/2041731414551661.
[12] M. Alessandri et al., “Influence of biological matrix and artificial electrospun scaffolds on
Journal Pre-proof
proliferation, differentiation and trophic factor synthesis of rat embryonic stem cells.,”
Matrix Biol., pp. 1–9, Aug. 2013, doi: 10.1016/j.matbio.2013.08.001.
[13] F. F. R. Damanik, G. Spadolini, J. Rotmans, S. Farè, and L. Moroni, “Biological activity of human mesenchymal stromal cells on polymeric electrospun scaffolds,” Biomater. Sci., vol. 7, no. 3, pp. 1088–1100, 2019, doi: 10.1039/c8bm00693h.
[14] B. Schoen et al., “Electrospun Extracellular Matrix: Paving the Way to Tailor-Made Natural Scaffolds for Cardiac Tissue Regeneration,” Adv. Funct. Mater., vol. 27, no. 34, pp. 1–9, 2017, doi: 10.1002/adfm.201700427.
[15] J. Wu and Y. Hong, “Enhancing cell infiltration of electrospun fibrous scaffolds in tissue regeneration,” Bioact. Mater., vol. 1, no. 1, pp. 56–64, 2016, doi:
10.1016/j.bioactmat.2016.07.001.
[16] B. Sun et al., “Advances in three-dimensional nanofibrous macrostructures via electrospinning,” Prog. Polym. Sci., Jun. 2013, doi: 10.1016/j.progpolymsci.2013.06.002.
[17] J. Rnjak-Kovacina and A. S. S. Weiss, “Increasing the pore size of electrospun scaffolds,”
Tissue Eng. B, Rev., vol. 17, no. 5, pp. 365–372, 2011, doi: 10.1089/ten.teb.2011.0235.
[18] B. a Blakeney et al., “Cell infiltration and growth in a low density, uncompressed three- dimensional electrospun nanofibrous scaffold.,” Biomaterials, vol. 32, no. 6, pp. 1583–90, Feb. 2011, doi: 10.1016/j.biomaterials.2010.10.056.
[19] D. Paneva, N. Manolova, I. Rashkov, H. Penchev, M. Mihai, and E. S. Dragan, “Self- organization of fibers into yarns during electrospinning of polycation/polyanion polyelectrolyte pairs,” Dig. J. Nanomater. Biostructures, vol. 5, no. 4, pp. 811–819, 2010.
[20] F. A. Sheikh et al., “3D electrospun silk fibroin nanofibers for fabrication of artificial skin,” Nanomedicine Nanotechnology, Biol. Med., vol. 11, no. 3, pp. 681–691, 2015, doi:
10.1016/j.nano.2014.11.007.
[21] C. T. Tsao et al., “Evaluation of chitosan/??-poly(glutamic acid) polyelectrolyte complex for wound dressing materials,” Carbohydr. Polym., vol. 84, pp. 812–819, 2011, doi:
10.1016/j.carbpol.2010.04.034.
[22] N. Radacsi and W. Nuansing, Fabrication of 3D and 4D polymer micro- and nanostructures based on electrospinning. Elsevier Inc., 2020.
[23] M. Vong, E. Speirs, C. Klomkliang, I. Akinwumi, W. Nuansing, and N. Radacsi,
“Controlled three-dimensional polystyrene micro- and nano-structures fabricated by three-
Journal Pre-proof
dimensional electrospinning,” RSC Adv., vol. 8, no. 28, pp. 15501–15512, 2018, doi:
10.1039/c7ra13278f.
[24] M. Vong and N. Radacsi, “Fabrication of radially aligned electrospun nanofibers in a three-dimensional conical shape,” Electrospinning, vol. 2, no. 1, pp. 1–14, 2018, doi: esp- 2018-0001.xml.
[25] Y. H. Lee et al., “Electrospun dual-porosity structure and biodegradation morphology of Montmorillonite reinforced PLLA nanocomposite scaffolds,” Biomaterials, vol. 26, no.
16, pp. 3165–3172, 2005, doi: 10.1016/j.biomaterials.2004.08.018.
[26] A. Jedlovszky-Hajdu, K. Molnar, P. M. Nagy, K. Sinko, and M. Zrinyi, “Preparation and properties of a magnetic field responsive three-dimensional electrospun polymer scaffold,” Colloids Surfaces A Physicochem. Eng. Asp., vol. 503, pp. 79–87, 2016, doi:
10.1016/j.colsurfa.2016.05.036.
[27] S. Cai, H. Xu, Q. Jiang, and Y. Yang, “Novel 3D electrospun scaffolds with fibers oriented randomly and evenly in three dimensions to closely mimic the unique architectures of extracellular matrices in soft tissues: Fabrication and mechanism study,”
Langmuir, vol. 29, no. 7, pp. 2311–2318, 2013, doi: 10.1021/la304414j.
[28] B. Sun et al., “Self-assembly of a three-dimensional fibrous polymer sponge by electrospinning,” Nanoscale, vol. 4, no. 6, pp. 2134–2137, 2012, doi:
10.1039/c2nr11782g.
[29] X.-H. Qin, E.-L. Yang, N. Li, and S.-Y. Wang, “Effect of different salts on electrospinning of polyacrylonitrile (PAN) polymer solution,” J. Appl. Polym. Sci., vol.
103, no. 6, pp. 3865–3870, Mar. 2007, doi: 10.1002/app.25498.
[30] M. Yousefzadeh, M. Latifi, M. Amani-tehran, W. Teo, and S. Ramakrishna, “A Note on the 3D Structural Design of Electrospun Nanofibers,” J. Eng. Fiber. Fabr., vol. 7, no. 2,
pp. 17–23, 2012, [Online]. Available:
http://www.jeffjournal.org/papers/Volume7/7.2.3Yousefzadeh .pdf.
[31] B. Song, W. Cui, and J. Chang, “Study on the effect of inorganic salts on the alignment of electrospun fiber,” J. Appl. Polym. Sci., vol. 122, no. 2, pp. 1047–1052, Oct. 2011, doi:
10.1002/app.34197.
[32] Q. Zhang, M. Li, J. Liu, S. Long, J. Yang, and X. Wang, “Porous ultrafine fibers via a salt-induced electrospinning method,” Colloid Polym. Sci., 2012, doi: 10.1007/s00396-
Journal Pre-proof
011-2563-0.
[33] K. Molnar, D. Juriga, P. M. Nagy, K. Sinko, A. Jedlovszky-Hajdu, and M. Zrinyi,
“Electrospun poly(aspartic acid) gel scaffolds for artificial extracellular matrix,” Polym.
Int., vol. 63, no. 9, pp. 1608–1615, Feb. 2014, doi: 10.1002/pi.4720.
[34] E. Krisch, L. Messager, B. Gyarmati, V. Ravaine, and A. Szilágyi, “Redox- and pH- Responsive Nanogels Based on Thiolated Poly(aspartic acid),” Macromol. Mater. Eng., vol. 301, no. 3, pp. 260–266, 2016, doi: 10.1002/mame.201500119.
[35] D. Juriga et al., “Biodegradation and Osteosarcoma Cell Cultivation on Poly(aspartic acid) Based Hydrogels,” ACS Appl. Mater. Interfaces, vol. 8, no. 36, pp. 23463–23476, 2016, doi: 10.1021/acsami.6b06489.
[36] E. Krisch, B. Gyarmati, and A. Szilágyi, “Preparation of pH-responsive poly(Aspartic acid) nanogels in inverse emulsion,” Period. Polytech. Chem. Eng., vol. 61, no. 1, pp. 19–
26, 2017, doi: 10.3311/PPch.9788.
[37] C. K. Lee, S. I. Kim, and S. J. Kim, “The influence of added ionic salt on nanofiber uniformity for electrospinning of electrolyte polymer,” Synth. Met., vol. 154, no. 1–3, pp.
209–212, 2005, doi: 10.1016/j.synthmet.2005.07.053.
[38] X. Zong, K. Kim, D. Fang, S. Ran, B. S. Hsiao, and B. Chu, “Structure and process relationship of electrospun bioabsorbable nanofiber membranes,” Polymer (Guildf)., vol.
43, no. 16, pp. 4403–4412, 2002, doi: 10.1016/S0032-3861(02)00275-6.
[39] P. Su et al., “Electrospinning of chitosan nanofibers: The favorable effect of metal ions,”
Carbohydr. Polym., vol. 84, no. 1, pp. 239–246, 2011, doi: 10.1016/j.carbpol.2010.11.031.
[40] C. Lu, P. Chen, J. Li, and Y. Zhang, “Computer simulation of electrospinning. Part I.
Effect of solvent in electrospinning,” Polymer (Guildf)., vol. 47, no. 3, pp. 915–921, 2006, doi: 10.1016/j.polymer.2005.11.090.
[41] B. B. Wang, X. D. Wang, and T. H. Wang, “Microscopic mechanism for the effect of adding salt on electrospinning by molecular dynamics simulations,” Appl. Phys. Lett., vol.
105, no. 12, pp. 1–5, 2014, doi: 10.1063/1.4896690.
[42] B. Scrosati and C. Vincent, “Alkali Metal, Alkaline Earth Metal and Ammonium Halides, Amide Solvents,” Iupac Sds, vol. 11, 1980, doi: 10.1016/0021-9614(80)90193-7.
[43] Y. Zhao and D. G. Truhlar, “The M06 suite of density functionals for main group thermochemistry , thermochemical kinetics , noncovalent interactions , excited states , and
Journal Pre-proof
transition elements : two new functionals and systematic testing of four M06-class functionals and 12 other fun,” pp. 215–241, 2008, doi: 10.1007/s00214-007-0310-x.
[44] G. E. S. M. J. Frisch, G. W. Trucks, H. B. Schlegel et al., “Gaussian 16, Revision A.03,”
Gaussian, Inc., Wallingford CT, 2016.
[45] C. J. Angammana, “Thesis: A Study of the Effects of Solution and Process Parameters on the Electrospinning Process and Nanofibre Morphology,” vol. 47, no. 3, pp. 1109–1117, 2011.
[46] B. Zhang et al., “Li+-molecule interactions of lithium tetrafluoroborate in propylene carbonate + N,N-dimethylformamide mixtures: An FTIR spectroscopic study,”
Spectrochim. Acta - Part A Mol. Biomol. Spectrosc., vol. 124, pp. 40–45, 2014, doi:
10.1016/j.saa.2014.01.001.
[47] X. Xuan, J. Wang, J. Tang, G. Qu, and J. Lu, “Vibrational spectroscopic studies on ion solvation of lithium perchlorate in propylene carbonate+N,N-dimethylformamide mixtures,” Spectrochim. Acta - Part A Mol. Biomol. Spectrosc., vol. 56, no. 11, pp. 2131–
2139, 2000, doi: 10.1016/S1386-1425(00)00267-5.
[48] D. W. James and R. E. Mayes, “Ion-ion-solvent interactions in solution. 8. Spectroscopic studies of the lithium perchlorate/N,N-dimethylformamide system,” J. Phys. Chem., vol.
88, no. 3, pp. 637–642, 1984, doi: 10.1021/j150647a058.
[49] Y. Umebayashi et al., “Conformation of solvent N,N-dimethylpropionamide in the coordination sphere of the Zinc(II) ion studied by Raman spectroscopy and DFT calculations,” J. Phys. Chem. A, vol. 109, no. 21, pp. 4862–4868, 2005, doi:
10.1021/jp044763a.
[50] Y. Umebayashi, K. Matsumoto, M. Watanabe, K. Katoh, and S. I. Ishiguro, “Individual solvation numbers around the nickel(II) ion in an N,N-dimethylformamide and N,N- dimethylacetamide mixture determined by Raman spectrophotometry,” Anal. Sci., vol. 17, no. 2, pp. 323–326, 2001, doi: 10.2116/analsci.17.323.
[51] Y. Umebayashi, K. Matsumoto, I. Mekata, and S. I. Ishiguro, “Solvation structure of lanthanide(III) ions in solvent mixtures of N,N-dimethylformamide and N,N- dimethylacetamide studied by titration Raman spectroscopy,” Phys. Chem. Chem. Phys., vol. 4, no. 22, pp. 5599–5605, 2002, doi: 10.1039/b204162f.
[52] M. A. Phadke, D. A. Musale, S. S. Kulkarni, and S. K. Karode, “Poly(acrylonitrile)
Journal Pre-proof
ultrafiltration membranes. I. Polymer-salt-solvent interactions,” J. Polym. Sci. Part B Polym. Phys., vol. 43, no. 15, pp. 2061–2073, 2005, doi: 10.1002/polb.20493.
[53] G. Durgaprasad, D. N. Sathyanarayana, and C. C. Patel, “ Infrared Spectra and Normal Vibrations of N , N -Dimethylformamide and N , N -Dimethylthioformamide ,” Bulletin of the Chemical Society of Japan, vol. 44, no. 2. pp. 316–322, 1971, doi:
10.1246/bcsj.44.316.
[54] S. K. Park, K. C. Min, C. Lee, S. K. Hong, Y. Kim, and N. S. Lee, “Intermolecular hydrogen bonding and vibrational analysis of N,N-dimethylformamide hexamer cluster,”
Bull. Korean Chem. Soc., vol. 30, no. 11, pp. 2595–2602, 2009, doi:
10.5012/bkcs.2009.30.11.2595.
[55] M. B. Shundalau, P. S. Chybirai, A. I. Komyak, A. P. Zazhogin, M. A. Ksenofontov, and D. S. Umreiko, “Modeling of structures and calculation of IR vibrational spectra of N,N- dimethylformamide dimers by density functional theory,” J. Appl. Spectrosc., vol. 78, no.
3, pp. 326–336, 2011, doi: 10.1007/s10812-011-9466-1.
[56] C. M. V. Stalhandske, J. Mink, M. Sandström, I. Pápai, and P. Johansson, “Vibrational spectroscopic and force field studies of N,N-dimethylthioformamide, N,N- dimethylformamide, their deuterated analogues and bis( N, N-dimethylthioformamide) mercury(II) perchlorate,” Vib. Spectrosc., vol. 14, pp. 207–227, 1997.
[57] D. Steele and A. Quatermain, “The vibrational spectra of amides-II. The force field and isotopic shifts of N,N-dimethyl formamide,” Spectrochim. Acta Part A Mol. Spectrosc., vol. 43, no. 6, pp. 781–789, 1987, doi: 10.1016/0584-8539(87)80220-9.
[58] I. A. Boyarskaya and S. K. Akopyan, “Quantum-chemical calculation of spectral characteristics and structure of complexes [Mg(DMF) i (CH3CN)6-i ]2+ and IR spectra of the tricomponent solutions Mg(ClO4) 2-DMF-CH3CN,” Russ. J. Gen. Chem., vol. 78, no.
12, pp. 2317–2329, 2008, doi: 10.1134/S1070363208120050.
[59] A. Shastri, A. K. Das, S. Krishnakumar, P. J. Singh, and B. N. Raja Sekhar, “Spectroscopy of N, N -dimethylformamide in the VUV and IR regions: Experimental and computational studies,” J. Chem. Phys., vol. 147, no. 22, 2017, doi: 10.1063/1.5006126.
[60] J. D. Forero-Saboya, E. Marchante, R. B. Araujo, D. Monti, P. Johansson, and A.
Ponrouch, “Cation Solvation and Physicochemical Properties of Ca Battery Electrolytes,”
J. Phys. Chem. C, vol. 123, no. 49, pp. 29524–29532, 2019, doi:
Journal Pre-proof
10.1021/acs.jpcc.9b07308.
[61] J. M. Alía and H. G. M. Edwards, “Ion solvation and ion association in lithium trifluoromethanesulfonate solutions in three aprotic solvents. An FT-Raman spectroscopic study,” Vib. Spectrosc., vol. 24, no. 2, pp. 185–200, 2000, doi: 10.1016/S0924- 2031(00)00073-4.
[62] D. W. James, R. E. Mayes, W. H. Leong, I. M. L. Jamie, and G. Zhen, “Solvation and ion association in solutions containing oxyanions,” Faraday Discuss. Chem. Soc., vol. 85, pp.
269–281, 1988, doi: 10.1039/DC9888500269.
[63] C. Lassigne and P. Baine, “Solvation studies of lithium salts in dimethylformamide,” J.
Phys. Chem., vol. 75, no. 20, pp. 3188–3190, 1971, doi: 10.1021/j100689a029.
[64] G. Kabisch, E. Kálmán, G. Pálinkás, T. Radnai, and F. Gaizer, “Complex formation and solvation of zinc bromide in N,N-dimethylformamide solution: An electron diffraction and Raman study,” Chem. Phys. Lett., vol. 107, no. 4–5, pp. 463–468, 1984, doi:
10.1016/S0009-2614(84)80256-0.
[65] W. E. Waghorne and H. Rubalcava, “Infrared spectroscopic study of the effects of different cations on NN-dimethylacetamide and fully deuterated NN-dimethylformamide,”
J. Chem. Soc. Faraday Trans. 1 Phys. Chem. Condens. Phases, vol. 78, no. 4, pp. 1199–
1207, 1982, doi: 10.1039/F19827801199.
[66] L. Pauling, The Nature of the Chemical Bond, Third edit. Oxford University Press, London, 1952.
[67] K. Fujii, M. Sogawa, N. Yoshimoto, and M. Morita, “Structural Study on Magnesium Ion Solvation in Diglyme-Based Electrolytes: IR Spectroscopy and DFT Calculations,” J.
Phys. Chem. B, vol. 122, no. 37, pp. 8712–8717, 2018, doi: 10.1021/acs.jpcb.8b05586.
[68] W. Hu, Z. Wang, Y. Xiao, S. Zhang, and J. Wang, “Advances in crosslinking strategies of biomedical hydrogels,” Biomater. Sci., vol. 7, no. 3, pp. 843–855, 2019, doi:
10.1039/c8bm01246f.
Journal Pre-proof
Authors Statement
Akos Gyorgy Juhasz (sample preparation, computational simulation, figures and manuscript preparation)
Laboratory of Nanochemistry, Department of Biophysics and Radiation Biology, Semmelweis University, Nagyvárad square 4, H-1089 Budapest, Hungary
University of Lille, Faculty of Sciences and Technology, Chemistry Department, Laboratory of Infrared and Raman Spectrochemistry, Lille, France
Email: juhaszakosgyorgy91@gmail.com
Kristof Molnar (statistical analysis, preparation of manuscript)
Semmelweis University, Department of Biophysics Radiation Biology, Laboratory of Nanochemistry, Budapest, Nagyvárad tér 4., 1089, Hungary
Department of Food, Agricultural and Biological Engineering, College of Food, Agricultural, and Environmental Sciences, The Ohio State University, 222 FABE, 1680 Madison Avenue, Wooster, OH 44691
Email: molnar.182@osu.edu
Abdenacer Idrissi (supervision of the computational simulation and the RAMAN measurements, write the connected sections in the manuscript)
University of Lille, Faculty of Sciences and Technology, Chemistry Department, Laboratory of Infrared and Raman Spectrochemistry, Lille, France
Email: nacer.idrissi@univ-lille.fr
Angela Jedlovszky-Hajdu (supervision of the project, preparation of the manuscript)
Laboratory of Nanochemistry, Department of Biophysics and Radiation Biology, Semmelweis University, Nagyvárad square 4, H-1089 Budapest, Hungary
Email: hajdu.angela@med.semmelweis-univ.hu
Journal Pre-proof
Conflict of Interest
The authors confirm that this work is entirely original and no part of it has been published elsewhere, nor it is currently under consideration for publication elsewhere. We declare that there are no known conflicts of interest associated with this publication and there has been no financial support for this work that could have influenced its outcome.
Journal Pre-proof
Highlights
- A strategy involving inorganic salts to reproducibly synthesize nano and microfibrous fluffy 3D structures with electrospinning
- To understand the effect of salt on the electrospun meshes
- To characterize the ion-ion and ion-solvent interactions with spectroscopy and computational simulation