1 Bernard Adjei-Frimpong and László Csurgai-Horváth are with Budapest University of Technology and Economics, Department of Broadband Infocommunications and Electromagnetic Theory, Hungary. e-mail:
{bernard.frimpong, laszlo.csurgai}@hvt.bme.hu
Using Radio Wave Satellite Propagation Measurements for Rain Intensity Estimation
Bernard Adjei-Frimpong and László Csurgai-Horváth
Using Radio Wave Satellite Propagation Measurements for Rain Intensity Estimation
Abstract—The European Space Agency launched a communication satellite called Alphasat in 2013, with two experimental beacons to carry out a scientific experiment by measurement at frequencies of 19.7 GHz and 39.4 GHz respectively. Propagation through the atmosphere at these frequencies is affected by the presence of atmospheric gases and other particles like water vapour, rain and ice drops. Rain attenuation is the most significant parameter which degrades the performance of the links by absorbing and scattering radio waves that can be determined as the measured received signal power’s deviation from the nominal, non-attenuated level. Rainfall statistical data are also measured and recorded by the propagation terminals to provide additional information to apply prediction methods that require minutes of integration time rain intensity.
In our institute, at the Department of Broadband Infocommunications and Electromagnetic Theory we have set up a ground station to carry out propagation measurements in the Ka/Q band. The station receives the signal from the satellite to characterize the satellite-Earth propagation channel. The beacon receiver station has been operating since 2014, collecting signal power data, and relevant meteorological data as well. The main goal of long-term propagation measurements is to improve the existing attenuation models that are published in the relevant ITU-R recommendations.
In this paper data processing procedures are discussed and exemplified by their application to one year of measurements. In addition it will be shown how the signal attenuation data can be converted to rain intensity that provides a different method to gain meteorological data over the propagation path.
The attenuation statistics obtained from measured time series are compared with models predictions from the relevant ITU-R standard. Then we evaluated the relationship between rain attenuation and rainfall intensity by extracting the rain intensity information using the measured attenuation on the radio path.
The results are compared with the local rain-gauge measurements as well.
Index terms—satellite propagation, attenuation statistics, rain rate
I. INTRODUCTION
One1of the major challenges, affecting propagating characteristics on terrestrial and satellite communication links at microwave and millimetre wave frequencies are the significance of rain attenuation of electromagnetic waves. Rain attenuation effect, greatly influences the propagation loss experienced by terrestrial communication links, from the
1 Bernard Adjei-Frimpong and László Csurgai-Horváth are with Budapest University of Technology and Economics, Department of Broadband Infocommunications and Electromagnetic Theory, Hungary. e-mail:
{bernard.frimpong, laszlo.csurgai}@hvt.bme.hu
transmitter to receiver. The attenuation by rain depends on the temperature, distribution size, terminal velocity and shape of the raindrops.
Rain attenuation can be measured quite accurately by means of satellite beacon signals. However, since propagation experiments are carried out only in few places across the world and for a limited number of frequencies and link geometry, their results cannot be directly applied to all sites. For this reason, several attenuation models based on physical facts and using available meteorological data have been developed to provide adequate inputs for system margin calculations in all regions of the world.
The Radiocommunication sector of the International Telecommunication Union (ITU-R) provides these set of models which are largely derived from measured data and uses rain intensity and rain height as the main input parameters [1].
The accurate estimation of the prevision of the rain intensity values at any site are needed for a correct terrestrial and satellite radio links design.
The main goal of long-term propagation measurements is to improve the existing attenuation models that are published in the relevant ITU-R recommendations. In the present paper we will introduce the measurements that are conducted at the Budapest University of Technology and Economics, Department of Broadband Infocommunications and Electromagnetic Theory (BME-HVT), the data processing procedures, comparing them with the relevant ITU-R recommendations, and a method how the attenuation data can be converted to rain intensity. In the first phase data pre- processing is performed and the measured received signal power is converted to attenuation. The reference level (clear sky level) is a critical parameter during this process that can be selected on different bases [2].
The propagation measurements are carried out in Ka- and Q-bands based on the unmodulated beacon signal transmitting from the satellite. Our institution is operating a receiver station where analysis is carried in relation to this research [3].
The organization of this paper is as follows. Section II gives a description of equipment used at the receiver station for measurement and the development of a method to study the radio wave attenuation effects in Ka/Q band. Section III describes the effects of rain attenuation for high frequencies in Ka/Q-band satellite communications links. The method applied to convert the measured received signal level to attenuation are analysed in Section IV. Section V shows how the attenuation data can be converted to rain rate. Finally, we evaluate the results and conclude the paper.
Bernard Adjei-Frimpong and László Csurgai-Horváth
II. RECEIVERSTATIONSET-UP
Alphasat is an European satellite launched in 2013 with two beacons for wave propagation characterization in the Ka (19.701 GHz) and Q (39.403 GHz) band respectively [5]-[7]. A European-wide experimental network [8]-[9] is serving to utilise as efficient as possible the resources aboard of the satellite. Several receiver stations are installed in different countries as it is described in [10]-[13]. BME-HVT also established a beacon receiver station that is located on top of the department’s building at BME, N47.48° latitudes and E19.06° longitudes at a height of 120m [3]. Other activities to improve the satellite communication technologies are also conducted in our country, as it was published in [5].
The building blocks of the receiver station are modified terrestrial microwave radio equipment with several hardware and firmware modifications. Both the Ka and the Q-band receivers are based on identical outdoor unit (ODU) construction; the difference is only the frequency of the locally synthesized signals to provide an identical 140 MHz IF frequency. As the orbit of Alphasat is low-inclination geosynchronous a tracking system is also operated in order to eliminate the daily variation of the received signal power.
Figure 1 is a display of high performance antennas with tracking system.
The ODU is a double conversion heterodyne receiver with synthesized local signal sources. Its original noise figure has been reduced from 5 dB to 3 dB and in order to generate a stable and jitter-free down-converted intermediate frequency (IF) signal, the oscillator block in the ODU is also changed.
The reference oscillator of the synthesizers is now designed to achieve a high stability, low phase noise OCXO with less than
± 1.0 ppb/day stability. The down-converted, filtered (bandwidth=100 kHz) and amplified IF signals are connected with a low attenuation coaxial cable to the indoor unit (IDU) and the calibrated gain of the ODU is 100 dB.
Figure 1. High performance antennas with tracking system The indoor unit is based on a modified I-Q demodulator that processes the incoming IF signal. The 140 MHz IF signal is under sampled with 80 MHz analog/digital converter unit.
The role of the quadrature digital downconverter (QDDC) module is to convert down the sampled signal into baseband quadrature component signals. The baseband signals (I, Q) are decimated (512) and filtered by CIC and FIR filters.
The ODU also contains an internal temperature sensor with 1°C accuracy. This sensor is used for the temperature- compensation of the ODU’s amplifier circuits. During the calibration of the ODU in a thermal-chamber the temperature- dependency of the complete receiver chain was determined.
The firmware has a built-in compensation table; therefore, the result is a temperature-independent, high accuracy level measurement. The temperature-compensated values are averaged and fed to a fine gain control unit that ensures the nominal 100 dB ODU gain.
The filtered and decimated signal is processed by an 8192 point FFT where the beacon signal can be detected as the highest amplitude spectral component. The carrier amplitude measurement is performed within 1 second and the final data is forwarded after a logarithmic conversion to the data collecting system. The resolution of the received power is 0.2 dBm. By taking into account the speed of A/D conversion, the decimation and the FFT buffer size, the system bandwidth is 80 MHz/512/8192=19.07 Hz.
The signal power from Ka and Q-band beacons are received and stored by a data collecting computer connected to the IDU’s serial port. The receiver software displays the actual receiving conditions and measurements; furthermore it handles the archive file system as well. The received power is collected and stored as raw data where daily measurement files are created. This data is post-processed to convert the received power to attenuation for later statistical analysis.
Initial stages of data processing (pre-processing) address the needs to validate the time series, discarding those with invalid data, and to eliminate as much as possible spurious measurements. These phases are of high relevance in order to guarantee the quality of the data. Data is considered invalid mostly due to loss of lock of the receiver, either because of rain attenuation exceeding the receiver margin, or because of some problem in the RF/IF stages.
Any received signal which shows fades or enhancements not related to propagation events are always eliminated from the measurements. Standard statistical analysis are then performed on the rain attenuations using post-processing programs and merge the monthly data to build long-term time series. The most important first order statistics are Cumulative Distribution Functions (CDFs), Complementary Cumulative Distributive Functions (CCDFs) that can be compared with the relevant ITU-R models.
Besides the beacon signal power measurement, we operate a meteorological station nearby the RF units to collect the rain rate, temperature, humidity and wind speed/direction data. In order to study the most important channel impairment, the rain attenuation the meteorological station is equipped with two different types of rain rate sensors: a tipping bucket one and a drop counter one. Nevertheless, the rain intensity sensors are located nearby of the receiver station. The reverse calculation using attenuation data to convert them to rain intensity is a different aspect to determine the rain intensity along the whole propagation path. In this way we get an averaged value of the rain intensity on the receiving path, therefore it provides an additional type of information about the characteristics of the meteorological circumstances. The reverse calculations are II. RECEIVERSTATIONSET-UP
Alphasat is an European satellite launched in 2013 with two beacons for wave propagation characterization in the Ka (19.701 GHz) and Q (39.403 GHz) band respectively [5]-[7]. A European-wide experimental network [8]-[9] is serving to utilise as efficient as possible the resources aboard of the satellite. Several receiver stations are installed in different countries as it is described in [10]-[13]. BME-HVT also established a beacon receiver station that is located on top of the department’s building at BME, N47.48° latitudes and E19.06° longitudes at a height of 120m [3]. Other activities to improve the satellite communication technologies are also conducted in our country, as it was published in [5].
The building blocks of the receiver station are modified terrestrial microwave radio equipment with several hardware and firmware modifications. Both the Ka and the Q-band receivers are based on identical outdoor unit (ODU) construction; the difference is only the frequency of the locally synthesized signals to provide an identical 140 MHz IF frequency. As the orbit of Alphasat is low-inclination geosynchronous a tracking system is also operated in order to eliminate the daily variation of the received signal power.
Figure 1 is a display of high performance antennas with tracking system.
The ODU is a double conversion heterodyne receiver with synthesized local signal sources. Its original noise figure has been reduced from 5 dB to 3 dB and in order to generate a stable and jitter-free down-converted intermediate frequency (IF) signal, the oscillator block in the ODU is also changed.
The reference oscillator of the synthesizers is now designed to achieve a high stability, low phase noise OCXO with less than
± 1.0 ppb/day stability. The down-converted, filtered (bandwidth=100 kHz) and amplified IF signals are connected with a low attenuation coaxial cable to the indoor unit (IDU) and the calibrated gain of the ODU is 100 dB.
Figure 1. High performance antennas with tracking system The indoor unit is based on a modified I-Q demodulator that processes the incoming IF signal. The 140 MHz IF signal is under sampled with 80 MHz analog/digital converter unit.
The role of the quadrature digital downconverter (QDDC) module is to convert down the sampled signal into baseband quadrature component signals. The baseband signals (I, Q) are decimated (512) and filtered by CIC and FIR filters.
The ODU also contains an internal temperature sensor with 1°C accuracy. This sensor is used for the temperature- compensation of the ODU’s amplifier circuits. During the calibration of the ODU in a thermal-chamber the temperature- dependency of the complete receiver chain was determined.
The firmware has a built-in compensation table; therefore, the result is a temperature-independent, high accuracy level measurement. The temperature-compensated values are averaged and fed to a fine gain control unit that ensures the nominal 100 dB ODU gain.
The filtered and decimated signal is processed by an 8192 point FFT where the beacon signal can be detected as the highest amplitude spectral component. The carrier amplitude measurement is performed within 1 second and the final data is forwarded after a logarithmic conversion to the data collecting system. The resolution of the received power is 0.2 dBm. By taking into account the speed of A/D conversion, the decimation and the FFT buffer size, the system bandwidth is 80 MHz/512/8192=19.07 Hz.
The signal power from Ka and Q-band beacons are received and stored by a data collecting computer connected to the IDU’s serial port. The receiver software displays the actual receiving conditions and measurements; furthermore it handles the archive file system as well. The received power is collected and stored as raw data where daily measurement files are created. This data is post-processed to convert the received power to attenuation for later statistical analysis.
Initial stages of data processing (pre-processing) address the needs to validate the time series, discarding those with invalid data, and to eliminate as much as possible spurious measurements. These phases are of high relevance in order to guarantee the quality of the data. Data is considered invalid mostly due to loss of lock of the receiver, either because of rain attenuation exceeding the receiver margin, or because of some problem in the RF/IF stages.
Any received signal which shows fades or enhancements not related to propagation events are always eliminated from the measurements. Standard statistical analysis are then performed on the rain attenuations using post-processing programs and merge the monthly data to build long-term time series. The most important first order statistics are Cumulative Distribution Functions (CDFs), Complementary Cumulative Distributive Functions (CCDFs) that can be compared with the relevant ITU-R models.
Besides the beacon signal power measurement, we operate a meteorological station nearby the RF units to collect the rain rate, temperature, humidity and wind speed/direction data. In order to study the most important channel impairment, the rain attenuation the meteorological station is equipped with two different types of rain rate sensors: a tipping bucket one and a drop counter one. Nevertheless, the rain intensity sensors are located nearby of the receiver station. The reverse calculation using attenuation data to convert them to rain intensity is a different aspect to determine the rain intensity along the whole propagation path. In this way we get an averaged value of the rain intensity on the receiving path, therefore it provides an additional type of information about the characteristics of the meteorological circumstances. The reverse calculations are
done by using the relating ITU-R P.618 methods as they are described in [1] and supported by further information like the recommendation ITU-R P.837 in [17].
III. ATTENUATION DATA VALIDATION WITH ITU-R ITU-R P.618 [1] is basically used for comparing the statistics of measured rain attenuation with the ITU-R predictions. This model is a step by step procedure for the calculating rain attenuation cumulative function for satellite link. The recommendation provides the most accurate statistical estimate of attenuation on slant paths. This model is dividing the earth into five regions and assigning a rain rate to each region with the probability of the rain rate being exceeded. It can also be used for frequencies from 4 GHz-55 GHz and 0.01-5% percentage probability range. The model uses the rain rate at 0.001% probability level for the estimation of attenuation and then applies an adjustment factor to predict rain fade depth for other possibilities. Attenuation predictions requires first the estimation of a surface rain rate distribution and second the prediction of the radio wave attenuation value distribution, given by that the rain rate distribution. The model is derived based on log normal distribution, using similarity, principles. Inhomogeneities in rain, in both horizontal and vertical direction are accounted for in the prediction. The limit of the model is the data for years of measurements taken at the station and not all stations filled with the one-minute integration time requirement. In Figure 2 the diagram of the parameters for rain height calculation can be seen.
Recommendation ITU-R P.837 [17] contains maps of meteorological parameters that have been obtained using the European Centre for Medium-Range Weather Forecast (ECMWF) ERA-40 re-analysis database, which are recommended for the prediction of rainfall rate statistics with a 1-min integration time, when local measurements are missing.
P.0618-01 A: frozen precipitation
B: rain height C: liquid precipitation D: Earth-space path
q B
A D
C hR
hs
LG Ls
()h – hRs
Figure 2. Rain height calculation based on ITU-R [2]
Rainfall rate statistics with a 1-min integration time are required for the prediction of rain attenuation in terrestrial and satellite links. Data of long-term measurements of rainfall rate may be available from local sources, but only with higher integration times. This recommendation provides a method for
the conversion of rainfall rate statistics with a higher integration time to rainfall rate statistics with a 1-min integration time.
Calculations can be made for link availability (%) for all frequency bands, to take into account link budgets, transmit power, receive sensitivity, antenna gain, target availability and other factors. Typical link availability Targets are 99.99%, 99.999% and higher.
Without detailing the above mentioned calculations in TABLE I. the most important values obtained from the calculations can be found:
TABLE I. INTERMEDIATE PARAMETERS FOR THE BUDAPEST STATION
R001point rainfall rate 35.87 mm/h Rain height hR 2.95 km Slant path length Ls 4.92 km Satellite elevation (average) 35°
Effective path length LE(Ka-band) 4.36 km Effective path length LE(Q-band) 4.72 km
Data processing is an essential phase of measurement data evaluation. The beacon receiver stations (at our station at BME as well) usually record the received signal’s power. In order to get attenuation statistics, the received signal (power) should be converted to attenuation. This could be done by applying different methods, but they may influence the precision of the attenuation statistics estimation as well.
The first task is to overview the time series of the archived data to remove the invalid sections. As the measurement system is continuously operating, the unwanted power failures, external radiofrequency noise sources or due to maintenance works there could be invalid series of data in the recorded stream. Nevertheless, the goal of the operator is to keep the station working reliable in order to ensure the high availability.
The second data processing step is the conversion of the measured received power to attenuation. Therefore a key issue is the process of determining the clear sky level, as the reference level. Due to lack of a radiometer (as it is also at BME) the simplest method to apply is the long-term median or mean value of the received power time series as reference level. To take into account the long-term signal variations a more effective method is used to select manually the individual rain events [2].
As a first step in the data processing, invalid measurements are removed from the received signal of both attenuation and weather data using a combination of automatic and semi- automatic procedures, like visual inspection of the data. The data processing methodology is well described in [4] that have been partly applied for the actual measurement as well. A detailed process diagram can be found also in [4]. After this pre-processing the 0 dB reference level is identified by using a few minutes of data before and after each event and interpolating between them. This procedure, in combination with the lack of a radiometer, does not allow complete separation of cloud attenuation from rain so there will be some cloud attenuation included in the data. However, the highest cloud attenuation predicted by the ITU-R [2] (at the 1 % exceedance level) is 0.5 dB, thus the contribution should be
limited. Next, attenuation events are manually identified and selected for processing. The root mean square errors of the signal during clear sky conditions were calculated and the results verified with the models of ITU-R. The set of measurements to perform this evaluation in this paper covers the entire year of 2016.
IV. ANALYSIS OFCLEAR SKY ESTIMATION
One important parameter is the rain intensity for 0.01% of time, R001, which is used for characterization of a given geographical location. According to the ITU regulations [17]
its value is 35.87mm/h for Budapest location. However, this value may change during different time in years according to the local weather conditions. This could be one of the reasons why the measured and modelled curves are not exactly covering each other. To determine the clear sky level, the measured values are subtracted from the median (clear sky) received power and then calculated over an entire year. The attenuation events are mainly caused by rainy periods. The Complementary Cumulative Distribution Function (CCDF) of rain attenuation provides the probability of exceeding at different attenuation levels. The monthly distributions reveal how the rain events can significantly influence the actual weather conditions.
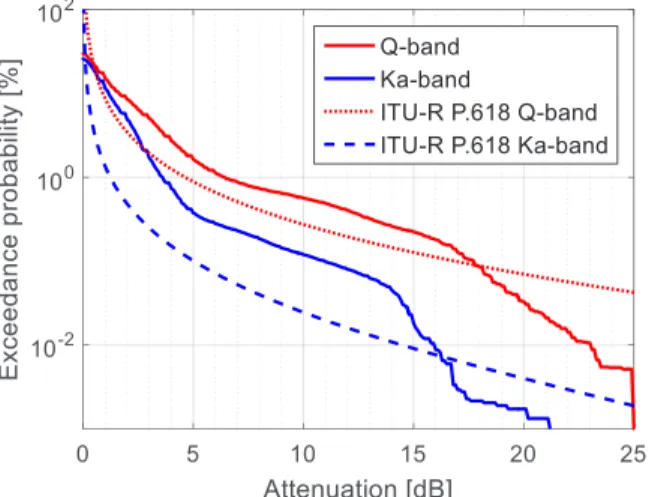
In Figure 3 the Complementary Cumulative Distribution Function (CCDF) of the measured attenuation for Ka and Q- band are depicted together with the distribution curves predicted by the ITU-R P.618 recommendation for an entire year of 2016. The clear sky level was estimated event-by event bases using a visual inspection of the measured time series.
This is a very time-consuming process, however this is a most reliable opportunity to estimate the clear sky level before and after the fade events. This method is applied almost by all of the members in the Alphasat propagation experimenters group [9]-[11].
Figure 3. CCDF for Ka and Q band attenuation, manually selected events, compared with the ITU-R estimation
In order to estimate and enhance the clear sky level, of the error between measurements and the ITU-R model, the root mean square error (RMSE) has been applied as the square root of the expected value of the power of differences between the measured and ITU-R predicted values.
Figure 4 and Figure 5 are showing the RMSE for the Ka and Q bands.
We calculated the RMSE between the measured and the predicted attenuation values as the square root of the expected value of the power of differences between the measured and modelled values.
By applying the manually selected events and calculated the attenuation statistics (attenuation CCDF), we obtain the best approximation of the ITU-R curves.
Figure 4. RMSE for Ka-band, clear sky level for manually selected events
Figure 5. RMSE for Q-band, clear sky level for manually selected events
V. ESTIMATING THE RAIN INTENSITY USING ATTENUATION DATA
In the experimental propagation measurement station in Budapest rain rate is recorded by two different types of meteorological sensors. The data provided by these sensors are relating to the point rainfall rate at the receiver’s location. By applying the measured attenuation on the radio link to estimate the instantaneous rain intensity is a different approach to the problem. Similar work has been published in [14] using the
ITU R P.838 recommendation, or with cellular mobile network data according to [15]. In the present work we apply the specific attenuation model for rain in the prediction of the rain rate, as a reverse calculation described in ITU R P.838.
The specific attenuation, using the frequency-dependent coefficients k and α given in Recommendation ITU R P.838 [16] can be expressed with the following power-law expression:
⁄ (1)
For the Alphasat receiver station in Budapest these frequency-dependent parameters are the following:
19.701 GHz 39.402 GHz
k 0.0924 0.4222
α 0.9987 0.8589
In the present case the inverse of Eq. (1) will be applied to calculate the rain intensity from the measured attenuation. The specific attenuation is the function of the measured attenuation Am by dividing it with the effective path length as given in TABLE I. :
(2)
By rearranging Eq. (2) the rain intensity in mm/h is as it follows:
( ⁄ )
(3)
Usually a beacon receiver is recording the beacon signal power level RPm in dBm. The station in Budapest samples and stores the received signal power with 1/sec sampling rate. In order to express the momentary attenuation level from the received power the clear-sky level is required, that is the signal power when no rain attenuation arises. A simple approach to get the attenuation time series is applying the long term (monthly) median of received power as a clear-sky level.
Unfortunately this method may not satisfactorily accurate as the median are influenced by the rainy and cloudy periods.
The problem can be overcome if a radiometer is available at the receiver site that always provides the actual clear sky level, but at the Budapest receiver site no radiometer is installed.
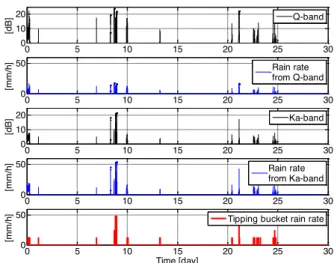
Therefore as it was shown in Section IV we used the best practice to select manually the attenuation events in order to determine the clear sky level for each of them. In this way the starting and ending of the event can be precisely determined and the temporal variation of the clear sky level can be eliminated. To overview the process Figure 6 depicts the measured attenuation time series and the rainfall rate calculated from the attenuation for both frequency bands. The rainfall rate measured with the tipping bucket sensor can be also seen in the figure. The figure is relating to July, 2017 that was a typical summer period with several rain events.
Figure 6. Rain rate calculated from the attenuation and the rain rate measured with tipping bucket sensor (07.2017)
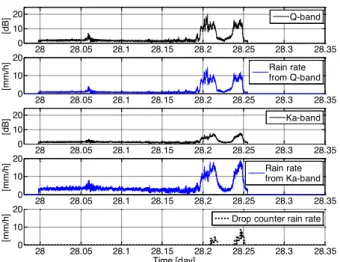
For better observing the phenomenon an event with 50 minute duration has been selected and depicted in Figure 7.
Figure 7. Selected rain event with calculated and measured rain rates (07.2017)
Although the tipping bucket sensor has been detected the event, due to its low resolution (0.2mm/tip) it cannot follow the shape of the rain attenuation event. The drop counter type sensor has better resolution (0.02mm) but it can be observed that it is still not capable to track the small signal variations.
Additionally, as the sensors are measuring only a point rainfall rate at the location of the receiver station, obviously we cannot expect a very good correlation with the rainfall rate that was determined from the path attenuation and that is relating to the full slant path between the ground station and the satellite. Another rain event with the relating measurements and calculations are depicted in Figure 8. The measured rain rate is graphed by using the drop-counter type sensor.
0 5 10 15 20 25 30
0 10 20
[dB] Q-band
0 5 10 15 20 25 30
0 50
[mm/h] Rain rate
from Q-band
0 5 10 15 20 25 30
0 10 20
[dB] Ka-band
0 5 10 15 20 25 30
0 50
[mm/h] Rain rate
from Ka-band
0 5 10 15 20 25 30
0 50
[mm/h]
Time [day]
Tipping bucket rain rate
13.24 13.245 13.25 13.255 13.26 13.265 13.27 13.275 13.280 5
10
[dB] Q-band
13.24 13.245 13.25 13.255 13.26 13.265 13.27 13.275 13.280 10
20
[mm/h] Rain rate
from Q-band
13.24 13.245 13.25 13.255 13.26 13.265 13.27 13.275 13.280 5
10
[dB] Ka-band
13.24 13.245 13.25 13.255 13.26 13.265 13.27 13.275 13.280 10
20
[mm/h] Rain rate
from Ka-band
13.24 13.245 13.25 13.255 13.26 13.265 13.27 13.275 13.280 10
20
[mm/h]
Time [day]
Tipping bucket rain rate Drop counter rain rate