0139–3006 © 2018 Akadémiai Kiadó, Budapest DOI: 10.1556/066.2018.47.2.9
INFLUENCE OF PHENOL AND SUGAR INTERACTIONS ON ANTIOXIDANT ACTIVITY OF POMEGRANATE JUICE
A. LONČARIĆa, A. PICHLERa, N. RAŠIĆb, I. VUKOJAb, A. LEVENTIĆb and M. KOPJARa*
aFaculty of Food Technology, Josip Juraj Strossmayer University in Osijek, F. Kuhača 20; 31000 Osijek. Croatia
bFaculty of Agronomy and Food Technology, University of Mostar; Biskupa Čule bb, 88000 Mostar. Bosnia and Hercegovina
(Received: 12 September 2017; accepted: 14 November 2017)
Nowadays, people are focusing on antioxidant-rich food due to its benefi cial effect on health. Thus, the goal of this study was to investigate the interactions between catechin, quercetin, and gallic acid in the presence of sugars (sucrose and trehalose) in complex food matrix such as pomegranate juice. Antioxidant activity (AOA) was measured by three different methods, DPPH and ABTS radical scavenging activity and ferric reducing antioxidant power (FRAP). In this paper, fundamental differences among used AOA measuring methods were confi rmed, which can be traced back to interactions occurring between phenols and/or sugars. Even though addition of individual phenols increased AOA of mixtures, in the majority of binary and ternary mixtures antagonistic effects were observed. Positive effect of sugar addition was more pronounced in binary mixtures but the results were highly dependent on used AOA method.
Keywords: pomegranate juice, sugars, phenols, interactions, synergism, antagonism
Pomegranate (Punica granatum L.) is one of the oldest edible fruit widely grown in many tropical and subtropical countries (ÇAM et al., 2009). Pomegranate is highly valued for its health-promoting effects (AVIRAM & ROSENBLAT, 2012). These benefi cial health effects have been attributed to phenolic components of which the most abundant are anthocyanins, catechins, ellagic tannins, etc. (POYRAZOĞLU et al., 2002). These phenols contribute to the high antioxidative activity (AOA) of the fruit (ÇAM et al., 2009). Processed fruit and vegetables show a reduction of AOA compared to fresh ones, mainly due to the oxidation of phenols. Therefore, much research has been devoted to preserving or increasing phenol contents and antioxidant activity of various fruit products. Current studies showed that phenol stability could be affected by addition of sugars (SADILOVA et al., 2009; PEINADO et al., 2010;
LONČARIĆ et al., 2014) and through fl avonoid–fl avonoid interactions. Studies dealing with fl avonoid–fl avonoid interactions reveal synergistic and antagonistic effects of such interactions (PIGNATELLI et al., 2000; HIDALGO et al., 2010; HAJIMEHDIPOOR et al., 2014).
HAJIMEHDIPOOR and co-workers (2014) reported considerable synergistic effect in binary combination of gallic acid and caffeic acid (137.8%) using the FRAP assay. Furthermore, PIGNATELLI and co-workers (2000) found that combination of quercetin and catechin has synergistic effect on platelet adhesion to collagen and collagen-induced platelet aggregation due to their antioxidant activity. However, HEO and co-workers (2007) did not fi nd any synergistic effect between the assayed fl avonoids by using the ABTS method and expressing results as vitamin C equivalent. Accordingly, the aim of this study was to investigate the phenol–phenol and phenol–sugar interactions in real food matrix and pomegranate juice on their antioxidant activity.
* To whom correspondence should be addressed.
Phone: +38531224300; fax: +38531207115; e-mail: Mirela.Kopjar@ptfos.hr
204
1. Materials and methods
1.1. Sample preparation
Samples were prepared by adding 2.5 ml of 1 mmol l–1 catechin (C), quercetin (Q), and gallic acid (G) and 0.5 ml of 0.5 mol l–1 sugars (sucrose and trehalose) to pomegranate juice (PJ);
end volumes were 25 ml. In binary mixtures, phenols were mixed in ratio 1:1, and in ternary mixtures phenols were mixed in ratio 1:1:1. The concentration of sugars was 0.5 mol l–1 in all mixtures. Prepared samples were stabilized at room temperature prior determination of parameters. Pomegranate juice without addition of phenols and sugars was used as control sample.
1.2. Determination of total phenolics
Concentration of total polyphenols was estimated by the Folin–Ciocalteau method, with absorbance monitored at 765 nm (Cary 60, UV-Vis, Agilent Technologies, Malaysia) according to the method described by SINGLETON and ROSSI (1965). The obtained values were interpolated on a gallic acid calibration curve and expressed as μg of gallic acid equivalents per ml of pomegranate juice (μg GAE/ml).
1.3. Total monomeric anthocyanin content determination and polymeric colour
Monomeric anthocyanins and percentage of polymeric colour were determined using the method described by GIUSTI and WROLSTAD (2001). Total monomeric anthocyanins were expressed as cyanidin-3-glucoside, and the obtained values were expressed as μg per ml (μg ml–1).
1.4. Antioxidant activity
Antioxidant activities of the samples were determined by the radical scavenging activity method using DPPH, ABTS, and FRAP assays described by LONČARIĆ and co-workers (2016).
The results of antioxidant activities were expressed as μmol of trolox equivalents per 100 ml of pomegranate juice (μmol TE/100 ml).
1.5. Statistical analysis
The dilution factor of the components after addition of sugars is included in the calculation of parameter values. All measurements were done in triplicate and data were expressed as mean ± standard deviation. The experimental data were subjected to one-way analysis of variance (ANOVA), and Fisher’s LSD was calculated to detect signifi cant difference (P≤0.05) between the mean values. MS Excel (Microsoft Offi ce 2007 Professional) statistical program was used for statistical analysis. Pearson’s correlation coeffi cient (P<0.05) was calculated using Microsoft Excel 2007.
2. Results and discussion
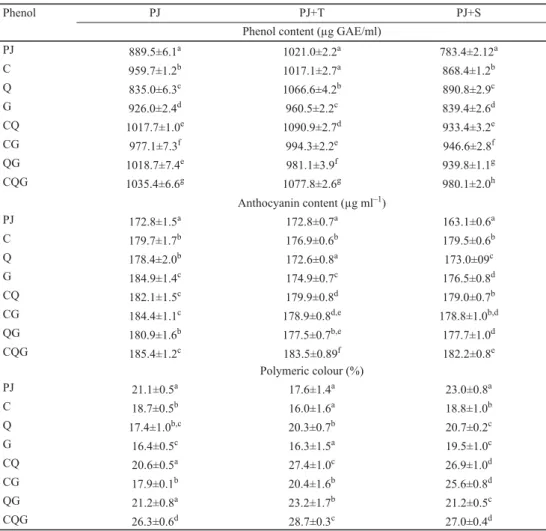
Results of total polyphenol content are presented in Table 1. Pomegranate juice (PJ) without addition of phenols had the total polyphenolic content (TPC) of 889.50 μg GAE/ml. Addition of C and G increased TPC with 8% and 4%, respectively. Synergistic effect, but with no signifi cant difference, has been observed in mixtures of PJ-CQ and PJ-QG. The highest TPC
values calculated by adding up the individual effects of compounds (catechin, quercetin, and gallic acid) on TPC, it can be established whether a synergistic or antagonistic effect occurred.
The obtained results indicate that the majority of the mixtures showed a higher TPC compared to their total theoretical values. Furthermore, addition of trehalose in mixtures increased TPC of mixtures for an average 8%. The highest impact was observed in PJ-Q, by addition of trehalose the increase of TPC was 27%. In PJ-QG, by addition of trehalose we observed a 4%
decrease of TPC compared to the mixture without added trehalose. Addition of sucrose had positive effect only on mixture PJ-Q, where an increase (6%) of TPC was observed, while in other mixtures a decrease of TPC was found. The average decrease of TPC was 6%.
Table 1. Phenol content, anthocyanin content, and polymeric colour of pomegranate juice with addition of phenolics and sugars
Phenol PJ PJ+T PJ+S
Phenol content (μg GAE/ml)
PJ 889.5±6.1a 1021.0±2.2a 783.4±2.12a
C 959.7±1.2b 1017.1±2.7a 868.4±1.2b
Q 835.0±6.3c 1066.6±4.2b 890.8±2.9c
G 926.0±2.4d 960.5±2.2c 839.4±2.6d
CQ 1017.7±1.0e 1090.9±2.7d 933.4±3.2e
CG 977.1±7.3f 994.3±2.2e 946.6±2.8f
QG 1018.7±7.4e 981.1±3.9f 939.8±1.1g
CQG 1035.4±6.6g 1077.8±2.6g 980.1±2.0h
Anthocyanin content (μg ml–1)
PJ 172.8±1.5a 172.8±0.7a 163.1±0.6a
C 179.7±1.7b 176.9±0.6b 179.5±0.6b
Q 178.4±2.0b 172.6±0.8a 173.0±09c
G 184.9±1.4c 174.9±0.7c 176.5±0.8d
CQ 182.1±1.5c 179.9±0.8d 179.0±0.7b
CG 184.4±1.1c 178.9±0.8d,e 178.8±1.0b,d
QG 180.9±1.6b 177.5±0.7b,e 177.7±1.0d
CQG 185.4±1.2c 183.5±0.89f 182.2±0.8e
Polymeric colour (%)
PJ 21.1±0.5a 17.6±1.4a 23.0±0.8a
C 18.7±0.5b 16.0±1.6a 18.8±1.0b
Q 17.4±1.0b,c 20.3±0.7b 20.7±0.2c
G 16.4±0.5c 16.3±1.5a 19.5±1.0c
CQ 20.6±0.5a 27.4±1.0c 26.9±1.0d
CG 17.9±0.1b 20.4±1.6b 25.6±0.8d
QG 21.2±0.8a 23.2±1.7b 21.2±0.5c
CQG 26.3±0.6d 28.7±0.3c 27.0±0.4d
Within the same column and samples with the same additives, means followed by different letters are signifi cantly different at P≤0.05 (ANOVA, Fisher’s LSD). PJ: pomegranate juice; C: PJ with addition of catechin; Q: PJ with addition of quercetin; G: PJ with addition of gallic acid; CQ: PJ with addition of catechin and quercetin; CG: PJ with addition of catechin and gallic acid; QG: PJ with addition of quercetin and gallic acid; CQG: PJ with addition of catechin, quercetin, and gallic acid; T: trehalose; S: sucrose
206
There are studies available on the effect of additives on anthocyanin stability (SADILOVA
et al., 2009; KOPJAR et al., 2012; LONČARIĆ et al., 2016). The results of these studies indicate that stability of anthocyanins is highly dependent on the additive (type of sugar, phenols, hydrocolloids, vitamins, etc.) as well as on the food matrix. In Table 1 the results of total monomeric anthocyanin content (TAC) are presented. The addition of phenols caused an increase in TAC. The highest impact on TAC had G followed by C and Q for 7, 4, and 3%, respectively. In binary and ternary mixtures we observed antagonistic effects, since the results of TAC were lower compared to their total theoretical values. Furthermore, addition of trehalose and sucrose caused a decrease in TAC of 2% and 3%, respectively.
Addition of C and G, as well as their combination to PJ caused a decrease in the percentage of polymeric colour (Table 1). In case of Q addition and binary and ternary mixtures with Q, higher values of percentage of polymeric colour were observed compared to other phenols. These results indicate that Q is involved in polymerization of anthocyanins.
The highest increase in percentage of polymeric colour (26.29%) was found for the mixture with all three phenols. WROLSTAD and co-workers (2005) have established that anthocyanins can condense with other phenols through covalent linkage on C-4 position to form coloured polymeric pigments. Furthermore, PLUMB and co-workers (1998) suggested that steric hindrance of increased molecular complexity after anthocyanin polymerization reactions decreases radical-scavenging capacity, as was the case in this study in mixtures without added sugars. In mixtures with added sugars, an increase in the percentage of polymeric colour in all mixtures except PJ and trehalose and PJ-C and trehalose was observed. In contrast to PLUMB and co-workers’ (1998) study, mixtures of PJ, phenols, and sugars (trehalose and sucrose) showed high positive correlation between percentage of polymeric colour and antioxidant activity measured with ABTS and FRAP, r=0.855 and r=0.771, respectively.
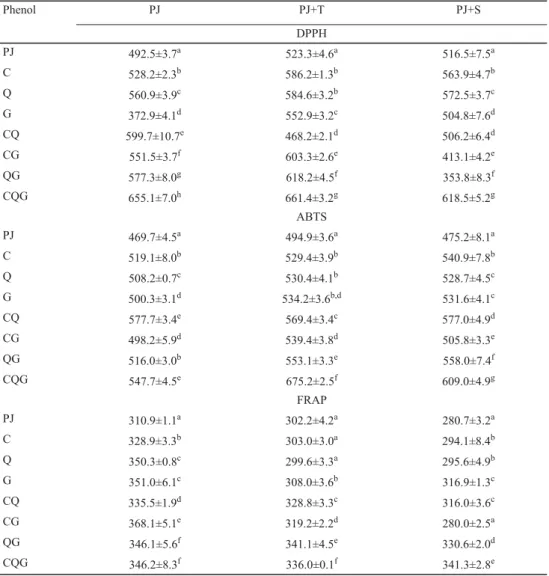
To have a better understanding of AOA and studied interactions, three methods based on fundamentally different approach were used. As it was expected, obtained results differed among the used methods. The ABTS and DPPH methods showed a positive correlation (r=0.406), since both methods are based on the same chemical property of H- or electron- donation to the antioxidant (RUBALYA & NEELAMEGAM, 2015). However, difference in selectivity between the methods is responsible for the weak correlation observed. Both methods showed a positive correlation with TOC (r=0.841), while FRAP showed a positive correlation with TAC (r=0.793). These results indicate some difference between anthocyanins and other presented phenols in PJ with added phenol C, Q, and G, suggesting that anthocyanins reduced oxidation rather than scavenging radicals. In Table 2, results of the antioxidant activity measured by DPPH method are presented. From the results, it can be seen that mixtures with addition of C or Q increase AOA, while mixture with addition of G decreases AOA compared to PJ without phenol addition. In binary mixture the addition of CQ increased AOA to 107 μmol TE/100 ml compared to PJ without added phenols, which is almost the same as the theoretical value 104.0 μmol TE/100 ml. In binary mixtures with G (CG and QG) as well as in ternary mixture we observed synergistic effect, since the values of AOA were signifi cantly higher than theoretical values. The highest AOA was measured in ternary mixture, the increase was 162.6 μmol TE/100 ml. AOA measured by ABTS method showed that addition of G to PJ caused an increase in AOA of 30.6 μmol TE/100 ml, and that binary mixture of CQ-PJ had the highest AOA. As in the case of AOA of CQ mixture measured by DPPH method, ABTS method also showed increase in AOA, which was almost the same as the theoretical value (108.0 μmol TE/100 ml). HEO and co-workers (2007) concluded in their study that AOA of phenol mixture was equal to the sum of AOAs of individual phenolics.
HIDALGO and co-workers (2010) have conducted a comprehensive study on fl avonoid–
fl avonoid interaction in model systems, in which they demonstrated an antagonistic effect between studied anthocyanins and C and Q in terms of AOA measured by DPPH. In the same study, an antagonistic effect between C and Q was observed, which was not the case in this study, since we have demonstrated a higher AOA of PJ with phenol addition. Difference between this study and that conducted by HIDALGO and co-workers (2010) was that here the interactions were observed in complex fruit juice matrix.
Table 2. Antioxidant activity (μmol TE/100 ml) of pomegranate juice with addition of phenol and sugars
Phenol PJ PJ+T PJ+S
DPPH
PJ 492.5±3.7a 523.3±4.6a 516.5±7.5a
C 528.2±2.3b 586.2±1.3b 563.9±4.7b
Q 560.9±3.9c 584.6±3.2b 572.5±3.7c
G 372.9±4.1d 552.9±3.2c 504.8±7.6d
CQ 599.7±10.7e 468.2±2.1d 506.2±6.4d
CG 551.5±3.7f 603.3±2.6e 413.1±4.2e
QG 577.3±8.0g 618.2±4.5f 353.8±8.3f
CQG 655.1±7.0h 661.4±3.2g 618.5±5.2g
ABTS
PJ 469.7±4.5a 494.9±3.6a 475.2±8.1a
C 519.1±8.0b 529.4±3.9b 540.9±7.8b
Q 508.2±0.7c 530.4±4.1b 528.7±4.5c
G 500.3±3.1d 534.2±3.6b,d 531.6±4.1c
CQ 577.7±3.4e 569.4±3.4c 577.0±4.9d
CG 498.2±5.9d 539.4±3.8d 505.8±3.3e
QG 516.0±3.0b 553.1±3.3e 558.0±7.4f
CQG 547.7±4.5e 675.2±2.5f 609.0±4.9g
FRAP
PJ 310.9±1.1a 302.2±4.2a 280.7±3.2a
C 328.9±3.3b 303.0±3.0a 294.1±8.4b
Q 350.3±0.8c 299.6±3.3a 295.6±4.9b
G 351.0±6.1c 308.0±3.6b 316.9±1.3c
CQ 335.5±1.9d 328.8±3.3c 316.0±3.6c
CG 368.1±5.1e 319.2±2.2d 280.0±2.5a
QG 346.1±5.6f 341.1±4.5e 330.6±2.0d
CQG 346.2±8.3f 336.0±0.1f 341.3±2.8e
Within the same column and samples with the same additives, means followed by different letters are signifi cantly different at P≤0.05, (ANOVA, Fisher’s LSD). PJ: pomegranate juice; C: PJ with addition of catechin; Q: PJ with addition of quercetin; G: PJ with addition of gallic acid; CQ: PJ with addition of catechin and quercetin; CG: PJ with addition of catechin and gallic acid; QG: PJ with addition of quercetin and gallic acid; CQG: PJ with addition of catechin, quercetin, and gallic acid; T: trehalose; S: sucrose
208
Considering AOA measured by FRAP method (Table 2) showed that addition of G had increased AOA of mixture by 40.12 μmol TE/100 ml, andthat was the highest increase obtained with added phenols. Here we can see the most noticeable difference between applied methods for determination of AOA, since by addition of G, a very low or no infl uence of mixtures on AOA was observed using the DPPH and ABTS methods. Considering binary mixtures, except CG mixture in which the increase of AOA was almost the same compared to the theoretical values (57.15; 58.15 μmol TE/100 ml, respectively), they all showed an antagonistic effect, and it was found for ternary mixture as well.
Addition of trehalose and sucrose increase AOA of PJ (523.3 and 516.5 μmol TE/100 ml, respectively) measured by DPPH method compared to PJ without addition of sugars (492.5 μmol TE/100 ml). In the case of AOA measured by ABTS method, trehalose increased AOA (494.9 μmol TE/100 ml), while AOA of PJ with addition of sucrose did not signifi cantly differ compared to PJ without addition of sucrose (475.2 and 469.7 μmol TE/100 ml, respectively). MORELLI and co-workers (2003) studied sugars (maltose, sucrose, fructose, glucose, deoxyribose, and sorbitol) for scavenging activity, and they proved that sugars possessed scavenging activity, and it was highly dependent on OH residues, sugars with more OH residues had higher free radical scavenging activity. PEINADO and co-workers (2010) suggested that sugars participate in the stability of phenols by inhibition of autoxidation of phenols; they also concluded that sugars (fructose and glucose) are highly effective in inhibiting assays mediated by hydroxyl radical formation. Considering AOA measured by FRAP method it could be seen that addition of sugars decreased AOA of PJ.
The results of AOA measured by ABTS method (Table 2) showed that addition of trehalose increases AOA of CG, QG, and CQG mixtures (44.3, 58.2, and 180.1 μmol TE/100 ml, respectively) compared to the same mixtures without addition of sugars (28.5, 46.3, and 78.0 μmol TE/100 ml, respectively). Sucrose addition had even more positive effect on AOA of mixtures with phenols. Sucrose addition caused an increase of AOA in mixtures with addition of C, Q, G, QG, and CQG. However, results from AOA measured by DPPH method presented different trend, showing that trehalose had a better impact on AOA. Addition of trehalose according to DPPH assay showed an increase in AOA of C, G, CG, and CQG mixtures compared to sucrose, where we observed an increase of AOA only in C mixture.
The results of measuring AOA by FRAP method showed a decrease of AOA in mixtures with trehalose addition, while in mixtures CQ, QG, and CQG with sucrose addition had higher AOA (35.3, 49.9, and 60.6 μmol TE/100 ml, respectively) compared to mixtures without sugar addition (24.6, 35.2, and 35.3 μmol TE/100 ml, respectively). Results obtained by different AOA methods showed signifi cant differences. These differences could be explained by the reactivity of the compounds and different mechanisms of action of used methods. In general, the antioxidant potency of a given compound is thought to be closely linked to its structural features, such as the ortho-dihydroxy structure in the B-ring, the 2–3-double bond in conjugation with a 4-oxo function, and the presence of the 3- and 5-OH functions, or simply by the different nature of assay (HIDALGO et al., 2010).
3. Conclusions
From the results presented in this work we can conclude that phenol–phenol interaction as well as phenol–sugar interaction did occur. Furthermore, these interactions affected all
monitored parameters. Antioxidant activity of the mixtures showed antagonistic to synergistic effects depending on mixture and applied assay.
*
This work has been fully supported by the Croatian Science Foundation under the project Trehalose: fruit product quality improvement project (6949). We are grateful to Hayashibara, Nagase Group, Japan for generous donation of trehalose.
References
AVIRAM, M. & ROSENBLAT, M. (2012): Pomegranate protection against cardiovascular diseases. Evid.-Based Compl..
Altern. Med., 2012, Article ID 382763, 20 pages.
ÇAM, M., HIŞIL, Y. & DURMAZ, G. (2009): Classifi cation of eight pomegranate juices based on antioxidant capacity measured by four methods. Food Chem., 112, 721–726.
GIUSTI, M. & WROLSTAD, R.E. (2001): Characterization and measurement of anthocyanins by UV-visible spectroscopy.
CPFAC, 5, 1–13.
HAJIMEHDIPOOR, H., SHAHRESTANI, R. & SHEKARCHI, M. (2014): Investigating the synergistic antioxidant effects of some fl avonoid and phenolic compounds. Res. J. Pharmacogn., 1, 35–40.
HEO, H.J., KIM, Y.J., CHUNG, D. & KIM, D.O. (2007): Antioxidant capacities of individual and combined phenolics in a model system. Food Chem., 104, 87–92.
HIDALGO, M., SÁNCHEZ-MORENO, C. & DE PASCUAL-TERESA, S. (2010): Flavonoid–fl avonoid interaction and its effect on their antioxidant activity. Food Chem., 121, 691–696.
KOPJAR, M., JAKŠIĆ, K. & PILIŽOTA, V. (2012): Infl uence of sugars and chlorogenic acid addition on anthocyanin content, antioxidant activity and color of blackberry juice during storage. J. Food Process Pres., 36, 545–552.
LONČARIĆ, A., DUGALIC, K., MIHALJEVIC, I., JAKOBEK, L. & PILIZOTA, V. (2014): Effects of sugar addition on total polyphenol content and antioxidant activity of frozen and freeze-dried apple puree. J. Agr. Food Chem., 62, 1674–1682.
LONČARIĆ, A., PICHLER, A., TRTINJAK, I., PILIŽOTA, V. & KOPJAR, M. (2016): Phenolics and antioxidant activity of freeze-dried sour cherry puree with addition of disaccharides. LWT – Food Sci. Technol., 73, 391–396.
MORELLI, R., RUSSO-VOLPE, S., BRUNO, N. & LO SCALZO, R. (2003): Fenton-dependent damage to carbohydrates: free radical scavenging activity of some simple sugars. J. Agr. Food Chem., 51, 7418–7425.
PEINADO, J., LÓPEZ DE LERMA, N. & PEINADO, R.A. (2010): Synergistic antioxidant interaction between sugars and phenolics from a sweet wine. Eur. Food Res. Technol., 231, 363–370.
PIGNATELLI, P., PULCINELLI, F.M., CELESTINI, A., LENTI, L., GHISELLI, A., GAZZANIGA, P.P. & VIOLI, F. (2000): The fl avonoids quercetin and catechin synergistically inhibit platelet function by antagonizing the intracellular production of hydrogen peroxide. Am. J. Clin. Nutr., 72, 1150–1155.
PLUMB, G.W., PASCUAL-TERESA, S., DE SANTOS-BUELGA, C., CHEYNIER, V. & WILLIAMSON, G. (1998): Antioxidant properties of catechins and proanthocyanidins: Effect of polymerisation, galloylation and glycosylation. Free Radical Res., 29, 351–358.
POYRAZOĞLU, E., GÖKMEN, V. & ARTΙK, N. (2002): Organic acids and phenolic compounds in pomegranates (Punica granatum L.) grown in Turkey. J. Food Compos. Anal., 15, 567–575.
RUBALYA V.S. & NEELAMEGAM, P. (2015): Selective ABTS and DPPH-radical scavenging activity of peroxide from vegetable oils. IFRJ, 22, 289–294.
SADILOVA, E., STINTZING, F.C., KAMMERER, D.R. & CARLE, R. (2009): Matrix dependent impact of sugar and ascorbic acid addition on color and anthocyanin stability of black carrot, elderberry and strawberry single strength and from concentrate juices upon thermal treatment. Food Res. Int., 42, 1023–1033.
SINGLETON, V.L. & ROSSI, J.A. (1965): Colorimetry of total phenolics with phosphomolybdic-phosphotungstic acid reagents. Am. J. Enol. Vitic., 16, 144–158.
WROLSTAD, R.E., DURST, R.W. & LEE, J. (2005): Tracking color and pigment changes in anthocyanin products. Trends Food Sci. Tech., 16, 423–428.