Article
Antioxidant and Antibacterial Properties of Norway Spruce
(Picea abies H. Karst.) and Eastern Hemlock (Tsuga canadensis (L.) Carrière) Cone Extracts
Tamás Hofmann1,* , Levente Albert1, LászlóNémeth2, Martina Vršanská3, Nikola Schlosserová3, Stanislava Vobˇerková3and Eszter Visi-Rajczi1
Citation: Hofmann, T.; Albert, L.;
Németh, L.; Vršanská, M.;
Schlosserová, N.; Vobˇerková, S.;
Visi-Rajczi, E. Antioxidant and Antibacterial Properties of Norway Spruce (Picea abiesH. Karst.) and Eastern Hemlock (Tsuga canadensis (L.) Carrière) Cone Extracts.Forests 2021,12, 1189. https://doi.org/
10.3390/f12091189
Academic Editor:
Antonios Papadopoulos
Received: 17 June 2021 Accepted: 30 August 2021 Published: 1 September 2021
Publisher’s Note:MDPI stays neutral with regard to jurisdictional claims in published maps and institutional affil- iations.
Copyright: © 2021 by the authors.
Licensee MDPI, Basel, Switzerland.
This article is an open access article distributed under the terms and conditions of the Creative Commons Attribution (CC BY) license (https://
creativecommons.org/licenses/by/
4.0/).
1 Institute of Chemistry, University of Sopron, H-9400 Sopron, Hungary; albert.levente@uni-sopron.hu (L.A.);
visine.rajczi.eszter@uni-sopron.hu (E.V.-R.)
2 Institute of Mathematics, University of Sopron, H-9400 Sopron, Hungary; nemeth.laszlo@uni-sopron.hu
3 Department of Chemistry and Biochemistry, Mendel University in Brno, CZ-61300 Brno, Czech Republic;
martina.vrsanska88@gmail.com (M.V.); schlosserovan@gmail.com (N.S.); voberkovas@gmail.com (S.V.)
* Correspondence: hofmann.tamas@uni-sopron.hu
Abstract: According to recent studies, Norway spruce cones and eastern hemlock cones possess exceptionally high antioxidant capacities; however, the antioxidant efficiency of extractives and their bioactive effects have yet to be investigated in detail. The present article utilizes state-of-the art analytical chemical methodology and chemometric evaluation to reveal cone extractives with the highest antioxidant potential, accounting for possible bioactive effects. Antioxidant properties were determined by the Ferric reducing antioxidant power (FRAP) assay and the Folin–Ciocalteu’s total phenol content (TPC) assay. Structure and relative polyphenol concentrations were determined using liquid chromatography/diode array detection/tandem mass spectrometry. The antibacterial testing was conducted usingStaphylococcus aureusandEscherichia colistrains. Using correlation analysis and factor analysis, a scoring evaluation was implemented to determine and compare the antioxidant efficiency of extractives. In Norway spruce, piceatannol-O-hexoside and coumaric acid derivatives were found to be the most powerful antioxidants, while in eastern hemlock, kaempferol glycosides were the most powerful. The antibacterial test did not show any promising antimicrobial activity againstE. coli,although a visible inhibitory effect onS. aureusstrain was observed.
Keywords: Norway spruce; eastern hemlock; polyphenols; antioxidant capacity; chemometrics;
high-performance liquid chromatography; diode array detection; mass spectrometry; antibacterial activity
1. Introduction
The proper and efficient utilization of the byproducts of field agriculture (skin, husks, leaves, pomace, etc.) and forestry (bark, leaves, cones, etc.) are not only urged by stricter environmental and resource management issues, but are also demanded by increasing societal responsibility. Regarding forestry, about 300–400 million m3are generated from bark biomass alone, from which only small portions are utilized for various purposes [1].
Among the various utilization possibilities, the extraction of bioactive compounds has been researched extensively in recent decades [2–4]. The chemical composition of bioactive compounds and other extractives in wood bark, leaves, cones, seeds and resin varies depending on the tree species and is also determined by genotypic, ecologic, seasonal, etc. factors [5–12]. The general chemical and nutritional composition of bioactive com- pounds has been described by several authors for bark [6–8], needles [9], cones [10] and seeds/nuts [11]. Antioxidants are a group of utilizable compounds [13,14] that can be used in healthcare products [15–17], food preservatives and ingredients [18–21], natu- ral growth regulators [22,23], production of silver nanoparticles [24,25] and a variety of other products.
Forests2021,12, 1189. https://doi.org/10.3390/f12091189 https://www.mdpi.com/journal/forests
The potential bioactive effects (anti-inflammatory, antioxidant, antiseptic, antifun- gal, antimicrobial, analgesic, anticancer, antimutagenic, antiviral, etc.) of the extrac- tives and essential oils ofPinus,Thuya, andCedrusspp.a cones have been extensively researched [5,26–34].
In their work, Hofmann et al. [35] presented a simple, reproducible extraction and a systematic evaluation method for the complex assessment of the antioxidant capacity of var- ious coniferous taxa involving different ripening stages of the cones. Their results were in accordance with earlier findings [36–39] where samples containing the highest antioxidant compound levels (Metasequoia glyptostroboidesHu and W. C. Cheng,Cryptomeria Japonica (L.f.) D. Don,Chamaecyparis lawsoniana(A. Murray) Parl.,Thuja orientalisL.) had been shown to possess various benign effects on human health and bioactivity. According to the authors, the green cones of Norway spruce (Picea abiesH. Karst.) and eastern hemlock (Tsuga Canadensis(L.)) also possessed exceptionally high antioxidant capacity; however, no literature data on the polyphenolic composition or the bioactivity of the cones of these two taxa was found. The ecological, industrial, and economic significance of the two taxa also demand a more detailed research study on the utilization of the cone byproducts.
Norway spruce is one of the most common coniferous species in Europe with an undoubted ecological and economic significance [40,41], while eastern hemlock is a foundation species in forests of eastern North America [42] and has a wide natural range [43].
A later study by the authors on the polyphenolic composition of these cones has tentatively identified 82 compounds, including flavonoid-O-glycosides, chlorogenic acid isomers, coumaric acid derivatives, flavonoid glycosides, stilbenoids, as well as flavan-3-ol compounds, which is a first-time discovery [44].
The present study aims to investigate the polyphenolic composition of Norway spruce and eastern hemlock green cone extracts and to use chemometric evaluation to determine which of the extractives account primarily for the antioxidant properties. Extraction was achieved using various compositions of aqueous acetone solutions. Antioxidant properties were assayed by the Folin–Ciocâlteu total polyphenol content (TPC) and ferric reduc- ing antioxidant power (FRAP) methods. The polyphenol structure, profile and relative concentrations were investigated using high-performance liquid chromatography/diode array detection/multistage electrospray mass spectrometry (HPLC-PDA-ESI-MS/MS). The antibacterial test of green and mature cone extracts was run onStaphylococcus aureusand Escherichia colibacterial strains, using three antimicrobial assays: disc diffusion test (DDT), minimal inhibitory concentration (MIC) and MIC with following growth curves.
The results of the present study could contribute to future extraction optimization of the cones and to the identification of the compounds responsible for bioactive effects.
2. Materials and Methods 2.1. Chemicals and Reagents
Water for the analyses was prepared by double distillation using conventional dis- tillation equipment. LCMS-grade acetonitrile, as well as acetone, was obtained from VWR International (Budapest, Hungary). Ascorbic acid, gallic acid, iron(III)-chloride, acetic acid, sodium acetate, 2,4,6-tripyridyl-S-triazine (TPTZ), sodium carbonate, hy- drochloric acid, Columbia blood agar and dimethyl sulfoxide were purchased from Sigma- Aldrich (Budapest, Hungary), while Folin–Ciocâlteu reagent was obtained from Merck (Darmstadt, Germany).
2.2. Sample Collection and Extraction
Sample collection occurred at the Botanical Garden of the University of Sopron in Sopron, Hungary in 2019. Cones were harvested from one healthy individual of each taxon by collecting 50 (eastern hemlock) or 10 (Norway spruce) cones from different parts of the crown. Sample collection was carried out at two ripening stages: green cones were harvested in July when cones reached their full size, yet were still green in color, while mature cones were collected in August when cones have ripened, browned, and began to
Forests2021,12, 1189 3 of 22
open their scales. Samples were stored at−20◦C until processing. Just before extraction, cone samples were thawed, chopped up into small pieces and ground using a conventional household coffee grinder. Because the obtained plant material was wet, no sieving was carried out. Ultrasonic extraction was performed using an Elma Transsonic T570 ultrasonic bath (Elma Schmidbauer GmbH, Singen, Germany) as follows: 0.45 g ground sample was homogenized with different compositions (0–100% acetone in 10% increments) of 45 mL aqueous acetone solution in a 50 mL centrifuge tube and sonicated for 3× 10 min as described by Hofmann et al. (2020) [35].
2.3. Determination of Antioxidant Properties
The TPC and FRAP assays were run in triplicates using a Hitachi U-1500 type spec- trophotometer (Hitachi Ltd., Tokyo, Japan). The TPC was determined by applying the Folin-Ciocâlteu assay [45] using gallic acid as the standard as follows: 0.5 mL extract solution (extract) was mixed with 2.5 mL 10-fold diluted Folin-Ciocâlteu reagent. Subse- quently, 2 mL 0.7 M Na2CO3solution was added, and the mixture was placed into a 50◦C water bath for 5 min. A cold water bath was used to stop the reaction and cool to room temperature. The absorbance of the reaction mixture was measured at 760 nm; results were expressed as mg equivalents of gallic acid/g dry cone units (mg GAE/g dw.). The FRAP method described by Benzie and Strain [46] was applied for the measurement of the FRAP antioxidant capacity at 593 nm using ascorbic acid as a standard after 5 min reaction time.
Results were given in mg equivalents of ascorbic acid/g dry cone (mg AAE/g dw.).
2.4. HPLC-PDA-ESI-MS/MS Analyses
Separation, identification and relative quantitative determination of polyphenolic com- pounds were achieved using a Shimadzu LC-20 type high-performance liquid chromato- graph coupled with a Shimadzu SPD-M20A type diode array detector (PDA) (Shimadzu Corporation, Kyoto, Japan) and an AB Sciex 3200 QTrap triple quadrupole/linear ion trap mass spectrometric (MS) detector (AB Sciex, Framingham, MA, USA). Conditions of the separation and compound identification process were described in detail by the authors in an earlier work [44]. The PDA detector signal (250–380 nm) was recorded and the relative concentration of each identified compound was determined by the integration of peak ar- eas. Chromatographic data were acquired and evaluated using the Analyst 1.6.3 software (AB Sciex, Framingham, MA, USA).
2.5. Antibacterial Activity Testing
Extracts for antibacterial testing were prepared as follows: ground and thawed plant material (1 g) was extracted using 45 mL 50:50 acetone:waterv/vmixture in a 50 mL centrifuge tube by sonication as described in Section2.2. The extraction process was re- peated twice for each sample and the two solutions were combined and filtered. Solutions were evaporated to dryness under reduced pressure and mild heating. The obtained dry extract powder (65–160 mg) was collected and stored at−20◦C until further investigations.
Extracts (EHGC—eastern hemlock green cones, EHMC—eastern hemlock mature cones, NSGC—Norway spruce green cones, NSMC—Norway spruce mature cones) were dis- solved in 1% dimethyl sulfoxide (DMSO) with a final concentration of solution 1 mg/mL.
The 1% DMSO solution was used as a blank probe.
The following bacterial strains were used to determine the antibacterial activity: Gram- positiveStaphylococcus aureus(CCM 4223) and Gram-negativeEscherichia coli(CCM 3954).
Both strains were obtained from a Czech collection of microorganisms (Brno, Czech Re- public). The bacteria were cultivated for 24 h at 37◦C on 5% Columbia blood agar. The samples were run in duplicate for the disc diffusion test and in triplicate for the testing of minimal inhibitory concentration and growth rates.
2.5.1. Disc Diffusion Test (DDT)
The qualitative antimicrobial effect of extracts (1 mg/mL) was monitored by DDT [47].
The bacterial inoculum was prepared from a suspension of 0.5 Mc Farland density in Mili-Q water and used for further testing. The antibiotic amoxicillin was used as a positive control forEscherichia coliand the antibiotic penicillin forStaphylococcus aureus. The inoculated plates were incubated at 37◦C for 12 h.
2.5.2. Minimal Inhibitory Concentration (MIC)
To determinate the MIC [48] of cone extracts on selected bacterial strains, 96-well microtiter plates were used, using a two-fold Mueller Hinton broth to obtain inoculum suspension of 0.5 Mc Farland density followed by a 100-times dilution to cell density 1-2-times 106CFU/mL. The extracts were diluted in Mili-Q water to obtain selected con- centrations (0.016–1.000 mg/mL) with 100µL of bacterial inoculum dispensed in each well of the microplate. The absorbance at 620 nm was measured at time zero, then after 15 h.
Inoculum with samples was cultivated at 37◦C on plate shaker at 120 rpm. Besides MIC, the results were also evaluated as IC50value (mg/mL), which is the extract concentration that causes 50% growth inhibition of tested bacteria.
2.5.3. Effect of Cone Extracts on Bacterial Growth Rate
The bacterial growth rate with the tested extracts was determined using the broth dilution method with 100-wells microtiter plates. The same extract preparation procedure as the one for the MIC assay with concentration range from 0.004–1.000 mg/mL was applied. The growth rate of bacteria was measured by Bioscreen C MBR (Dynex, Czech Republic). The absorbance (620 nm) was monitored at time zero, and then at 30 min intervals at 37◦C for 20 h.
2.6. Statistics and Scoring Evaluation
Correlation analysis and factor analysis was run using Statistica 11 software (StatSoft Inc., Tulsa, OK, USA).
3. Results and Discussion
3.1. Identification of Cone Extractives
Previous studies on the polyphenol composition of the cones of the two taxa revealed that they contained a large number (82) of polyphenolic compounds, including kaempferol-, quercetin, isorhamnetin-O-glycosides, chlorogenic acid isomers, coumaric acid derivatives, piceatannol and its conjugates, as well as flavan-3-ol compounds [44]. From the identified compounds, the present study investigated only those that had a significant and measurable peak area in the UV chromatogram, and which ostensibly contribute to the antioxidant effects. The investigation was conducted using only green cones because earlier studies indicated that these have superior antioxidant capacity compared to mature cones [44].
The current study examined 30 compounds from Norway spruce polyphenols and 32 compounds from eastern hemlock polyphenols; some of the compounds were evidenced in both taxa (Table1). Compounds were identified using the MS/MS fragmentation pattern (mass spectra) and previous studies [44]. Although mass spectrometric data were evaluated using the literature and mass spectrometric databases, some of the compounds that gave significant peaks in the UV chromatogram were left unidentified because they either gave no ionization or the mass spectrum could not be interpreted. Despite the lack of structural information, these unidentified compounds may have a significant role in determining antioxidant properties of the extracts, thus were included in the evaluation.
Forests2021,12, 1189 5 of 22
Table 1.Liquid chromatographic/mass spectrometric identification of the major extractives in the cones of Norway spruce (S) and eastern hemlock (H); tr: retention time; [M-H]−: parent ion; MS/MS: major fragment ions; n.i.: no ions.
Peak tr
(min) Compound Tag S H [M-H]−
m/z
MS/MS m/z
1 15.10 Procianidin dimer PBd1 x x 577 425, 407, 289, 245, 125
2 15.50 (+)-Catechin (+)-Cat x x 289 245, 203, 125, 123, 109
3 16.10 Procianidin dimer PBd2 x x 577 425, 407, 289, 245, 125
4 17.23 Unidentified Ui10 x 369 255, 207, 179, 135
5 17.75 Procianidin trimer PCt1 x x 865 739, 695, 577, 407, 289, 125
6 18.38 Chlorogenic acid isomer Cha1 x 353 191, 179, 161, 135
7 19.00 Chlorogenic acid isomer Cha2 x 353 191, 179, 161, 135
8 19.80 Procianidin dimer PBd3 x 577 425, 407, 289, 245, 125
9 19.80 Procianidin trimer PCt2 x 865 739, 695, 577, 407, 289, 125
10 20.20 (−)-Epicatechin (−)-Epi x x 289 245, 203, 125, 123, 109
11 20.80 Unidentified Ui11 x n.i n.i
12 22.17 Unidentified Ui1 x n.i n.i
13 24.35 Unidentified Ui12 x 335 291, 179, 161, 135, 111
14 24.70 Piceatannol-O-hexoside PtanHex x 405 243, 225, 201
15 25.50 Taxifolin-O-hexoside Th x x 465 447, 437, 303, 285, 259, 217, 179, 125
16 28.50 Unidentified Ui2 x n.i n.i
17 29.50 Unidentified Ui3 x n.i n.i
18 30.80 Piceatannol Ptan x 243 225, 201, 175, 174
19 30.90 Unidentified Ui13 x 567 409, 329
20 32.70 Unidentified Ui14 x 451 381, 341, 231, 217, 189
21 33.30 Quercetin-O-hexoside Qh x x 463 301, 300, 271, 255, 179
22 35.30 Coumaric acid derivative Cou1 x 359 341, 311, 297, 282, 195, 163, 145
23 35.40 Quercetin-O-pentoside Qp x 433 301, 300, 271, 255, 243, 179
24 36.00 Kaempferol-O-rutinoside Kr1 x 593 447, 285, 284, 255, 227
25 36.62 Kaempferol-O-hexoside Kh x x 447 285, 284, 255, 227
26 37.30 Unidentified-O-hexoside Uh x 431 269, 268
27 37.80 Isorhamnetin-O-hexoside Ih x 477 315, 314, 300, 299, 271
28 38.00 Kaempferol-O-pentoside Kp1 x 417 285, 284, 255, 227
29 38.60 Kaempferol-O-pentoside Kp2 x 417 285, 284, 255, 227
30 39.20 Kaempferol-O-pentoside Kp3 x 417 285, 284, 255, 227
31 41.20 Kaempferol-acetyl-
hexoside Kah x 489 429, 285, 284, 255, 227
32 42.00 Unidentified Ui4 x n.i n.i.
33 44.30 Unidentified Ui5 x 351 333, 315, 275, 251
34 46.00 Kaempferol-O-rutinoside Kr2 x 593 447, 285, 284, 255, 227
35 51.10 Coumaric acid derivative Cou2 x 341 326, 311, 297, 263, 239, 163, 145, 119
36 52.70 Unidentified Ui6 x 401 333, 315, 257
37 53.80 Coumaric acid derivative Cou3 x 445 427, 397, 349, 277, 251, 163, 145, 119
38 54.20 Unidentified Ui7 x 521 473, 195, 179, 165, 150, 119
39 54.40 Coumaric acid derivative Cou4 x 475 457, 427, 281, 163, 145, 119
40 55.00 Coumaric acid derivative Cou5 x 505 487, 457, 311, 163, 145, 119
41 55.90 Kaempferol-coumaric acid
derivative KCou1 x 739 593, 453, 285, 284, 255, 227, 163, 145, 119
42 56.00 Coumaric acid derivative Cou6 x 505 491, 477, 341, 327, 177, 163, 145, 119 43 56.31 Coumaric acid derivative Cou7 x x 505 491, 477, 341, 327, 177, 163, 145, 119 44 57.20 Ferulic acid derivative Fea x 535 520, 491, 341, 207, 193, 179, 163, 149, 134 45 60.62 Kaempferol-coumaric acid
derivative KCou2 x 723 577, 559, 437, 285, 284, 255, 227, 163,
145, 119
46 61.30 Unidentified Ui15 x 249 205
47 61.60 Unidentified Ui8 x 385 317, 299, 253
48 62.50 Coumaric acid derivative Cou8 x 667 521, 403, 323, 163, 145, 119
49 64.14 Unidentified Ui16 x 315 297
50 64.30 Unidentified Ui9 x 383 315, 299, 269
51 68.00 Unidentified Ui17 x n.i n.i
52 68.81 Unidentified Ui18 x n.i n.i
53 74.00 Unidentified Ui19 x n.i n.i
Forests2021,12, 1189 6 of 22
Figure1depicts typical chromatograms of the cone extracts of the two taxa. The peaks represent individual compounds, and the peak area is proportional to the concentration of compounds. The present study completed a relative quantitative assessment of the compounds because determining absolute concentrations would have been infeasible due to the lack of appropriate analytical standards for most of the compounds. Relative quantifi- cation assumes that peak areas are proportional to concentrations; thus, the concentrations of a given compound can be compared between different sample chromatograms. The wavelength range of 250–380 nm was chosen because this setting gave the highest peaks in the chromatograms and this range includes the absorbance range of polyphenols in is general.
46 61.30 Unidentified Ui15 x 249 205
47 61.60 Unidentified Ui8 x 385 317, 299, 253
48 62.50 Coumaric acid derivative Cou8 x 667 521, 403, 323, 163, 145, 119
49 64.14 Unidentified Ui16 x 315 297
50 64.30 Unidentified Ui9 x 383 315, 299, 269
51 68.00 Unidentified Ui17 x n.i n.i
52 68.81 Unidentified Ui18 x n.i n.i
53 74.00 Unidentified Ui19 x n.i n.i
Figure 1 depicts typical chromatograms of the cone extracts of the two taxa. The peaks represent individual compounds, and the peak area is proportional to the concentration of compounds. The present study completed a relative quantitative assessment of the com- pounds because determining absolute concentrations would have been infeasible due to the lack of appropriate analytical standards for most of the compounds. Relative quantification assumes that peak areas are proportional to concentrations; thus, the concentrations of a given compound can be compared between different sample chromatograms. The wavelength range of 250–380 nm was chosen because this setting gave the highest peaks in the chromato- grams and this range includes the absorbance range of polyphenols in is general.
Figure 1. The HPLC-PDA (250–380 nm) chromatogram of Norway spruce (solid line) and eastern hemlock (dashed line) green cone extracts.
Figure 1.The HPLC-PDA (250–380 nm) chromatogram of Norway spruce (solid line) and eastern hemlock (dashed line) green cone extracts.
3.2. Norway Spruce Samples Evaluation
The peak areas as well as the FRAP and TPC antioxidant capacities of the cone extracts of Norway spruce are included in Supplementary Table S1. The highest FRAP values were experienced in the 30:70 acetone:waterv/vsolution (225. 6 mg AAE/g dw.), while TPC was the highest in the 60:40 acetone:water extraction mixture (67.1 mg GAE/g dw.). The results also prove the selective manner of antioxidant assays, more specifically, that different assays are differently selective to given compounds. Thus, multiple assays should be run to determine the overall antioxidant power of complex plant extracts [49,50]. Apparently, the compounds followed different trends depending on their polarity and water solubility:
Forests2021,12, 1189 7 of 22
catechins, and other flavan-3-ols (procyanidins), had the highest levels in the 10–20%v/v acetone extracts, flavonoid glycosides were best soluble in 30–50%v/vacetone solutions, while derivatives of phenolic acids and stilbenes had the highest levels in 50–60%v/v acetone extracts. The different selectivity of solvent systems and compositions on the extraction efficiency of polyphenols has already been researched [51,52]; thus, depending on the sample, an appropriate solvent composition should be chosen.
3.2.1. Correlation Evaluation
The easiest way to discover the connection between the concentration of individual polyphenols and antioxidant capacity is to establish linear correlations. It was supposed that if the correlation between the concentration of an individual compound and an an- tioxidant capacity assay (FRAP or TPC) is significant and has a high positive value, then this compound influences the antioxidant property of the extract, thus contributeing poten- tially to the antioxidant and other beneficial effects of the cone extracts. The “strength” of linear correlations was determined using Pearson’s correlation coefficient (R) value. It was assumed that if the correlation was significant (|R|≥0.60 forn= 11 andp< 0.05), then the given compound significantly contributes to the antioxidant power of the plant extract [42].
A score which equaled theRvalue was assigned for measuring this contribution of a compound to the antioxidant capacity. The correlation analysis was run for FRAP and TPC;
scores were summarized compound-wise (Table2).
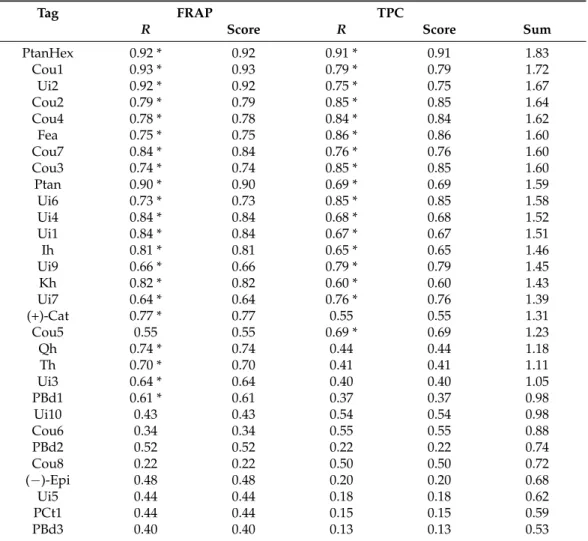
Table 2. Correlation analysis of the polyphenol peak areas and antioxidant properties of Norway spruce cone extracts. Significant correlations (forp< 0.05,n= 11, |R|≥0.60) were marked with an asterisk. FRAP: Ferric Reducing Antioxidant Power; TPC: Total Polyphenol Content. For the interpretation of tags please refer to Table1.
Tag FRAP TPC
R Score R Score Sum
PtanHex 0.92 * 0.92 0.91 * 0.91 1.83
Cou1 0.93 * 0.93 0.79 * 0.79 1.72
Ui2 0.92 * 0.92 0.75 * 0.75 1.67
Cou2 0.79 * 0.79 0.85 * 0.85 1.64
Cou4 0.78 * 0.78 0.84 * 0.84 1.62
Fea 0.75 * 0.75 0.86 * 0.86 1.60
Cou7 0.84 * 0.84 0.76 * 0.76 1.60
Cou3 0.74 * 0.74 0.85 * 0.85 1.60
Ptan 0.90 * 0.90 0.69 * 0.69 1.59
Ui6 0.73 * 0.73 0.85 * 0.85 1.58
Ui4 0.84 * 0.84 0.68 * 0.68 1.52
Ui1 0.84 * 0.84 0.67 * 0.67 1.51
Ih 0.81 * 0.81 0.65 * 0.65 1.46
Ui9 0.66 * 0.66 0.79 * 0.79 1.45
Kh 0.82 * 0.82 0.60 * 0.60 1.43
Ui7 0.64 * 0.64 0.76 * 0.76 1.39
(+)-Cat 0.77 * 0.77 0.55 0.55 1.31
Cou5 0.55 0.55 0.69 * 0.69 1.23
Qh 0.74 * 0.74 0.44 0.44 1.18
Th 0.70 * 0.70 0.41 0.41 1.11
Ui3 0.64 * 0.64 0.40 0.40 1.05
PBd1 0.61 * 0.61 0.37 0.37 0.98
Ui10 0.43 0.43 0.54 0.54 0.98
Cou6 0.34 0.34 0.55 0.55 0.88
PBd2 0.52 0.52 0.22 0.22 0.74
Cou8 0.22 0.22 0.50 0.50 0.72
(−)-Epi 0.48 0.48 0.20 0.20 0.68
Ui5 0.44 0.44 0.18 0.18 0.62
PCt1 0.44 0.44 0.15 0.15 0.59
PBd3 0.40 0.40 0.13 0.13 0.53
According to Table2, only positive significant correlations were established, indicating that the antioxidant power increases with the increase in concentration. The compounds with the highest scores were piceatannol-O-hexoside, coumaric acid derivatives 1–4 and 7, as well as unidentified compound 2 and the ferulic acid derivative. While most of the coumaric acid derivatives had high scores, flavonoid glycosides, catechins and other falvan-3-ols achieved medium to low scores. Although catechins and procyanidins are strong antioxidants, and abundant in different parts of forest trees [49,53,54] and other plants, in Norway spruce cones they seem to have a lesser role. The same applies to the flavonoid glycoside compounds.
Piceatannol-O-hexoside (astringin) is the hexose conjugate of piceatannol (astringinin), a known compound in the bark [55] and needles [56] of Norway spruce, and otherPicea species [57,58] as well as in grapevine [59] and wine [60]. The technological and scientific importance of piceatannol-O-hexoside and aglycone piceatannol is justified by recent studies, proving their role in the defense reactions and stress responses in living trees [61]
and plants [62] as well as their antifungal and other related bioactive effects [60–63].
The beneficial effects of these compounds on human health have been also researched extensively [60,64].
The antioxidant, antimicrobial, antitumor, anti-inflammatory, antiplatelet aggregation and other health benefits of coumaric acid and its conjugates have already been reviewed in the literature [65,66]. Moreover, these compounds are especially important for a cosme- ceutical use also due to their depigmenting potential and anti-collagenase activity [67].
Although Unidentified 2 yielded no ions in the ion source during mass spectrometric identification because of its significance revealed in the correlation test, its structure needs further research.
3.2.2. Factor Analysis Evaluation
Correlation analysis establishes a relationship between two variables only, while factor analysis investigates all variables together, revealing also their joint relations, thus resulting a different order of the compounds. An additional advantage of running factor analysis is that compounds with similar antioxidant properties appear as clusters in factor space by having similar factor coordinates; this also helps in the future identification of the compounds labelled as unidentified (which have significant peak areas in the HPLC-PDA chromatogram, yet their structure could not be identified from mass spectrometric data yet). Factor analysis is useful and worth applying if significant correlations are found beyond the main diagonal of the correlation matrix—as was the case with these datasets.
Factors are calculated from the transformation of individual vectors, grouped by vari- ance. In this manner, compounds are grouped in way that also respects their relationship with antioxidant assay vectors. An additional advantage of the method is that it can help to identify the structure and chemical features of the compounds, which were left unidentified by mass spectrometric evaluation, by the grouping feature of the factors and revealing possible synergistic or antagonistic effects of the compounds [49,68–70].
According to the factor analysis of the data, the first three factors accounted for 93.76%
of the total variance. Supplementary Table S2 includes the highest factor loading values.
The factors are always orthogonal (independent) and, according to the results, each vector is determined by one factor (loading > 0.7) at the most.
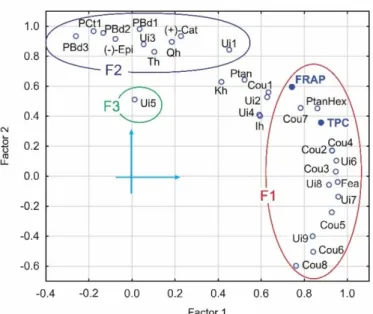
Figure2illustrates the results of the factor analysis, indicating the vectors as the function of the first two factors. Since the variance of third factor is just 4.48%, Figure2 only represents the vectors in the plane spanned by Factor 1 and Factor 2.
Forests2021,12, 1189 9 of 22
Forests 2021, 12, 1189 9 of 23
with antioxidant assay vectors. An additional advantage of the method is that it can help to identify the structure and chemical features of the compounds, which were left uniden- tified by mass spectrometric evaluation, by the grouping feature of the factors and reveal- ing possible synergistic or antagonistic effects of the compounds [49,68–70].
According to the factor analysis of the data, the first three factors accounted for 93.76% of the total variance. Supplementary Table S2 includes the highest factor loading values. The factors are always orthogonal (independent) and, according to the results, each vector is determined by one factor (loading > 0.7) at the most.
Figure 2 illustrates the results of the factor analysis, indicating the vectors as the func- tion of the first two factors. Since the variance of third factor is just 4.48%, Figure 2 only represents the vectors in the plane spanned by Factor 1 and Factor 2.
Figure 2. Results of the factor analysis for Norway spruce sample; factor loadings Factor 1 vs. Factor 2. Rotation: Varimax normalized; Extraction: principal components. F1 denotes the group of vectors corresponding to Factor 1, and we use F2 and F3 similarly (see Table 3 as well). For the interpretation of the tags, please refer to Table 1.
According to the results, FRAP and TPC were most closely associated with Factor 1, as were most of the phenolic acid (coumaric acid and ferulic acid) derivatives as well as piceatannol-O-hexoside and unidentified Compounds 6–9. From factor loadings, it can be assumed that these unidentified compounds can also be phenolic acid derivatives, with structures that need elucidation in the future. The highest Factor 2 loadings were deter- mined for flavan-3-ols (catechins and procyanidins) as well as for flavonoid (quercetin and taxifolin) glycosides and Unidentified 1. Unidentified 5 was most closely correlated with Factor 3, while other compounds did not have significant loadings with either of first three factors.
The relationships between the vectors in the factor space was quantified by Euclidean distances and a scoring system. It was supposed that the vectors that are closer to the vector of the antioxidant assay (FRAP, TPC) were also more closely related to it, and were thus influencing the respective antioxidant property more significantly. Distances were determined, ordered, and the highest score 1 was assigned to the FRAP and to the TPC vector, while the most distant compound was given the score 0 comparing for FRAP and TPC vectors, respectively. Other compounds were scored proportionally to their distance parameter between [0;1]. In order to establish the overall antioxidant power of a single compound, its scores were summarized to obtain the “Sum” value (Table 3).
The scores determined for TPC and FRAP were slightly different, proving the differ- ent selectivity and behavior of compounds using various antioxidant assays [35]. Overall,
Figure 2.Results of the factor analysis for Norway spruce sample; factor loadings Factor 1 vs. Factor 2.
Rotation: Varimax normalized; Extraction: principal components. F1 denotes the group of vectors corresponding to Factor 1, and we use F2 and F3 similarly (see Table3as well). For the interpretation of the tags, please refer to Table1.
According to the results, FRAP and TPC were most closely associated with Factor 1, as were most of the phenolic acid (coumaric acid and ferulic acid) derivatives as well as piceatannol-O-hexoside and unidentified Compounds 6–9. From factor loadings, it can be assumed that these unidentified compounds can also be phenolic acid derivatives, with structures that need elucidation in the future. The highest Factor 2 loadings were determined for flavan-3-ols (catechins and procyanidins) as well as for flavonoid (quercetin and taxifolin) glycosides and Unidentified 1. Unidentified 5 was most closely correlated with Factor 3, while other compounds did not have significant loadings with either of first three factors.
The relationships between the vectors in the factor space was quantified by Euclidean distances and a scoring system. It was supposed that the vectors that are closer to the vector of the antioxidant assay (FRAP, TPC) were also more closely related to it, and were thus influencing the respective antioxidant property more significantly. Distances were determined, ordered, and the highest score 1 was assigned to the FRAP and to the TPC vector, while the most distant compound was given the score 0 comparing for FRAP and TPC vectors, respectively. Other compounds were scored proportionally to their distance parameter between [0;1]. In order to establish the overall antioxidant power of a single compound, its scores were summarized to obtain the “Sum” value (Table3).
The scores determined for TPC and FRAP were slightly different, proving the different selectivity and behavior of compounds using various antioxidant assays [35]. Overall, the highest scores were determined for piceatannol-O-hexoside and coumaric acid derivatives 1–4 and 7, as well as for Unidentified 2 and 6. The list of the most powerful compounds was similar to that resulted by the correlation analysis; however, their order was slightly different. Nevertheless, piceatannol-O-hexoside was once again found to be the compound with the highest score. In this way, the results of the factor analysis justified correlation test outcomes, with additional selectivity for this evaluation.
Table 3. Factor analysis of the polyphenol peak areas and the antioxidant properties of Norway spruce cone extracts. “Factor” indicates the factor that correlates best with the given concentration of a given compound; “Dist.” is the Euclidian distance of a given compound from the FRAP or the TPC vector. FRAP: Ferric Reducing Antioxidant Power; TPC: Total Polyphenol Content. For the interpretation of the tags please refer to Table1.
Tag FRAP TPC Factor
Dist. Score Dist. Score Sum
PtanHex 0.24 0.81 0.12 0.91 1.72 1
Cou7 0.15 0.88 0.29 0.77 1.65 1
Cou4 0.47 0.62 0.28 0.78 1.41 1
Cou2 0.46 0.63 0.30 0.77 1.39 1
Ui6 0.56 0.55 0.27 0.79 1.34 1
Cou1 0.32 0.75 0.60 0.53 1.28 -
Ui2 0.34 0.73 0.61 0.53 1.25 -
Cou3 0.60 0.51 0.37 0.71 1.22 1
Ptan 0.39 0.69 0.70 0.46 1.15 -
Ui1 0.45 0.64 0.65 0.50 1.14 2
Fea 0.68 0.45 0.42 0.67 1.13 1
Ui9 0.70 0.44 0.42 0.67 1.11 1
Ui4 0.47 0.62 0.69 0.46 1.08 -
Ih 0.53 0.57 0.74 0.42 0.99 -
Ui7 0.76 0.38 0.54 0.58 0.96 1
Kh 0.53 0.57 0.83 0.36 0.93 -
Cou5 0.86 0.31 0.62 0.51 0.82 1
(+)-Cat 0.62 0.50 0.90 0.30 0.80 2
Qh 0.65 0.47 0.95 0.26 0.74 2
Th 0.75 0.40 1.05 0.19 0.58 2
Ui3 0.76 0.38 1.05 0.19 0.57 2
Ui10 1.00 0.19 0.82 0.36 0.55 1
PBd1 0.83 0.33 1.05 0.19 0.51 2
Cou6 1.11 0.10 0.87 0.32 0.43 1
(−)-Epi 0.88 0.29 1.12 0.13 0.41 2
Ui5 0.95 0.24 1.19 0.07 0.31 3
PBd2 0.95 0.23 1.20 0.06 0.30 2
Cou8 1.24 0.00 0.97 0.24 0.24 1
PCt1 1.00 0.19 1.22 0.05 0.24 2
PBd3 1.06 0.14 1.29 0.00 0.14 2
3.2.3. Summary for Norway Spruce
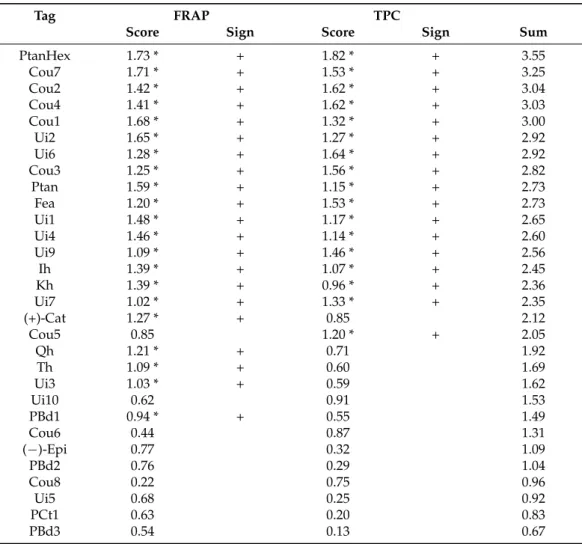
Table4provides a summary of the scoring evaluation and the type (positive/negative) of the significant correlation between compound concentrations and FRAP/TPC. Overall, piceatannol-O-hexoside had the highest scores, which confirms the results of current research focused on the importance of the utilization of this compound, especially from Norway spruce bark wastes [61,62], and also on the bioactivity of this compound, already discussed in Section3.2.1. The results also justify the relevance of chemometric evaluation for the determination of antioxidant efficiency of the compounds, as it is not always the compounds with the highest concentrations (see peak areas of Cou6 and Cou7 in Supplementary Table S1) that exhibit the strongest contributions to plant extract FRAP and TPC power, and possibly also to its bioactivity. Although Norway spruce cones contained significant amounts of (+)-catechin, this did not have the strongest contribution to its antioxidant power, unlike the extracts of other forest tree species where its contribution is almost the highest [42,47]. This also proves the importance and strength of coumaric acid derivatives and astringin as antioxidants.
Forests2021,12, 1189 11 of 22
Table 4. Summary of the chemometric evaluation of the antioxidant efficiency of Norway spruce cone polyphenols. FRAP: Ferric Reducing Antioxidant Power; TPC: Total Polyphenol Content.
“Sign” indicates the type (positive/negative) of the significant correlation between compounds’
concentration and FRAP/TPC. Significant correlations (forp< 0.05,n= 11, |R|≥0.60) were marked with an asterisk. For the interpretation of the tags, please refer to Table1.
Tag FRAP TPC
Score Sign Score Sign Sum
PtanHex 1.73 * + 1.82 * + 3.55
Cou7 1.71 * + 1.53 * + 3.25
Cou2 1.42 * + 1.62 * + 3.04
Cou4 1.41 * + 1.62 * + 3.03
Cou1 1.68 * + 1.32 * + 3.00
Ui2 1.65 * + 1.27 * + 2.92
Ui6 1.28 * + 1.64 * + 2.92
Cou3 1.25 * + 1.56 * + 2.82
Ptan 1.59 * + 1.15 * + 2.73
Fea 1.20 * + 1.53 * + 2.73
Ui1 1.48 * + 1.17 * + 2.65
Ui4 1.46 * + 1.14 * + 2.60
Ui9 1.09 * + 1.46 * + 2.56
Ih 1.39 * + 1.07 * + 2.45
Kh 1.39 * + 0.96 * + 2.36
Ui7 1.02 * + 1.33 * + 2.35
(+)-Cat 1.27 * + 0.85 2.12
Cou5 0.85 1.20 * + 2.05
Qh 1.21 * + 0.71 1.92
Th 1.09 * + 0.60 1.69
Ui3 1.03 * + 0.59 1.62
Ui10 0.62 0.91 1.53
PBd1 0.94 * + 0.55 1.49
Cou6 0.44 0.87 1.31
(−)-Epi 0.77 0.32 1.09
PBd2 0.76 0.29 1.04
Cou8 0.22 0.75 0.96
Ui5 0.68 0.25 0.92
PCt1 0.63 0.20 0.83
PBd3 0.54 0.13 0.67
3.3. Eastern Hemlock Samples Evaluation
Table S3 of the Supplementary includes the antioxidant capacity values as well as peak areas measured from the eastern hemlock aqueous acetonic extracts. In general, FRAP and TPC were higher compared to respective Norway spruce samples; the highest FRAP was measured using a 40:60 acetone:waterv/vsolution solvent (467.4 mg AAE/g dw.), while TPC topped using 70:30 acetone:water (126.1 mg GAE/g dw.). Not only was antioxidant capacity significantly higher, but the composition of polyphenols was also markedly different compared to Norway spruce. According to peak areas, the most abundant compounds were chlorogenic acid isomer 1, and conjugates of coumaric acid as well as kaempferol. The Unidentified 18 compound also exhibited high peak areas in the chromatogram. Extracts also included low amounts of flavan-3-ols (catechins, procyanidins) and other flavonoid glycosides. Again, the concentrations of the compounds varied with their structure in the different extracts.
3.3.1. Correlation Evaluation
Correlation analysis and scoring evaluation was conducted the same way as described in Section3.2.1. for Norway spruce (Table 5). The only difference was that negative correlations were also experienced. In this case, the score was taken as the absolute of the R value. A negative correlation between polyphenol levels and antioxidant capacity can
be interpreted in many ways. One of these ways is that these compounds must have a pro-oxidant (oxidation enhancing) effect as proved in other samples [49,54] for procyanidin compounds. In the present study, the compound showing a significant negative correlations was the procyanidin B dimer 1. Under certain circumstances, antioxidants can have pro-oxidant effects: they increase rather than decrease the concentration of free radicals speeding up oxidation reactions [70,71]. According to peak areas, the compound present in the largest amount was chlorogenic acid isomer 1, but this did not show a significant influence on FRAP and TPC levels. Chlorogenic acid proved to be a strong antioxidant in other plant samples [72]. The compound also offers many human health benefits [73,74];
however, the present sample did not confirm this. The reason for this may be that despite its high concentrations, it does not react well, or that other compounds are present in the extract, which are even stronger antioxidants.
Table 5. Correlation analysis of the polyphenol peak areas and antioxidant properties of eastern hemlock cone extracts. Significant correlations (forp< 0.05,n= 11, |R|≥0.60) were marked with an asterisk. FRAP: Ferric Reducing Antioxidant Power; TPC: Total Polyphenol Content. For the interpretation of the tags please refer to Table1.
Tag FRAP TPC
R Score R Score Sum
Kr2 0.88 * 0.88 0.82 * 0.82 1.71
Ui14 0.88 * 0.88 0.74 * 0.74 1.61
Kp2 0.83 * 0.83 0.62 * 0.62 1.45
Kah 0.79 * 0.79 0.65 * 0.65 1.44
Kr1 0.76 * 0.76 0.60 0.60 1.36
PCt2 0.78 * 0.78 0.57 0.57 1.36
KCou1 0.49 0.49 0.78 * 0.78 1.27
Cou7 0.76 * 0.76 0.51 0.51 1.27
Kh 0.75 * 0.75 0.51 0.51 1.26
Kp1 0.73 * 0.73 0.53 0.53 1.26
Kp3 0.75 * 0.75 0.49 0.49 1.24
PBd1 −0.48 0.48 −0.75 * 0.75 1.22
Cha2 0.63 * 0.63 0.53 0.53 1.17
KCou2 0.41 0.41 0.74 * 0.74 1.16
Qp 0.71 * 0.71 0.34 0.34 1.05
Qh 0.66 * 0.66 0.25 0.25 0.90
Uh 0.62 * 0.62 0.20 0.20 0.82
PBd2 −0.21 0.21 −0.59 0.60 0.81
Ui19 −0.39 0.39 −0.41 0.41 0.80
PCt1 −0.21 0.21 −0.58 0.58 0.79
(+)-Cat −0.06 0.06 −0.51 0.51 0.56
Ui17 0.32 0.32 0.19 0.19 0.51
(−)-Epi 0.31 0.31 −0.17 0.17 0.47
Ui10 0.06 0.06 −0.41 0.41 0.47
Ui11 0.25 0.25 −0.21 0.21 0.46
Cha1 0.29 0.29 −0.17 0.17 0.45
Ui13 0.32 0.32 −0.12 0.12 0.45
Ui18 −0.34 0.34 −0.10 0.10 0.44
Ui15 0.22 0.22 0.21 0.21 0.43
Ui16 −0.33 0.33 0.09 0.09 0.42
Ui12 0.19 0.19 −0.21 0.21 0.40
Th 0.28 0.28 −0.12 0.12 0.40
The scores determined for FRAP and TPC were again slightly different, just as in the case of Norway spruce sample, which was explained by the different selectivity of the two assays. According to the correlation analysis, the strongest antioxidant compounds proved to be kaempferol derivatives (kaempferol-O-rutinoside isomers, kaempferol-O-pentoside 2,
Forests2021,12, 1189 13 of 22
kaempferol-acetyl-hexoside, kaempferol-coumaric acid derivative 1) as well as unidentified 14 and procyanidin C trimer 2.
Recent literature data on kaempferol and its glycosides have proven its antitumor, antioxidant, and anti-inflammatory activities [75]. Regarding the acetylated derivative of kaempferol, Mellou et al. [76] showed that acylated (acetyl, coumaroyl, galloyl) derivatives of flavonoid glycosides have dramatically increased antioxidant and antibacterial effects compared to their corresponding glycosides; this makes the plant extracts containing such compounds especially interesting for future uses.
3.3.2. Factor Analysis Evaluation
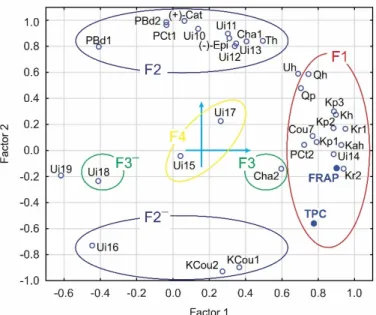
According to the factor analysis, the first four factors accounted for 90.9% of the total variance. Factor loading values (>0.7) are included in Supplementary Table S4, while the vectors as the function of the first two most important factors are depicted in Figure3.
Forests 2021, 12, 1189 14 of 23
Figure 3. Results of the factor analysis for eastern hemlock sample; factor loadings Factor 1 vs. Factor 2. Rotation: Varimax normalized; Extraction: principal components. F1 denotes the group of vectors corresponding to Factor 1, and we use F2, F3 and F4 similarly. Please refer to the last column of Table 6. For the interpretation of the tags, please refer to Table 1.
Table 6. Factor analysis of the polyphenol peak areas and the antioxidant properties of eastern hem- lock cone extracts. “Factor” indicates the factor that correlates best with the given concentration of a given compound; “Dist.” is the Euclidian distance of a given compound from the FRAP or the TPC vector. FRAP: Ferric Reducing Antioxidant Power; TPC: Total Polyphenol Content. For the inter- pretation of the tags, please refer to Table 1.
Tag FRAP TPC Factor Dist. Score Dist. Score Sum
Kr2 0.10 0.94 0.46 0.75 1.68 1 Ui14 0.21 0.87 0.56 0.69 1.56 1 Kah 0.27 0.83 0.68 0.63 1.46 1 Kp2 0.39 0.76 0.80 0.56 1.32 1 Kh 0.44 0.73 0.89 0.51 1.24 1 Kr1 0.52 0.68 0.83 0.54 1.22 1 PCt2 0.52 0.68 0.84 0.54 1.22 1 Kp1 0.51 0.68 0.86 0.52 1.21 1 Kp3 0.53 0.67 0.92 0.49 1.17 1 Cou7 0.60 0.63 0.95 0.48 1.11 1 KCou1 0.95 0.42 0.58 0.68 1.10 -2
Cha2 0.69 0.58 0.90 0.51 1.08 3 Qp 0.65 0.60 1.05 0.42 1.02 1 KCou2 1.03 0.37 0.67 0.63 1.00 -2
Qh 0.77 0.53 1.18 0.35 0.88 1
Uh 0.78 0.52 1.21 0.34 0.85 -
Ui17 0.93 0.42 1.12 0.38 0.81 4 Ui15 1.10 0.32 1.16 0.36 0.68 4 Ui13 1.10 0.32 1.46 0.20 0.52 2 Th 1.14 0.30 1.47 0.19 0.49 2 Cha1 1.14 0.30 1.50 0.17 0.47 2 (−)-Epi 1.16 0.28 1.52 0.17 0.45 2 Ui12 1.17 0.28 1.52 0.16 0.44 2 Figure 3. Results of the factor analysis for eastern hemlock sample; factor loadings Factor 1 vs.
Factor 2. Rotation: Varimax normalized; Extraction: principal components. F1 denotes the group of vectors corresponding to Factor 1, and we use F2, F3 and F4 similarly. Please refer to the last column of Table6. For the interpretation of the tags, please refer to Table1.
The FRAP and TPC were most closely related to Factor 1 and so were the flavonoid (kaempferol and quercetin) derivatives, procyanidin C trimer 2, coumaric acid derivative 7 and Unidentified 14. Factor 2 was most closely related to flavan-3-ol type of compounds, taxifolin-O-hexoside, kaempferol-coumaric acid derivatives 1 and 2. Factors 3 and 4 were associated with only a few compounds.
The method of scoring evaluation of the factor analysis was similar to the one com- pleted for Norway spruce. The results are summarized in Table6.
The highest scores were determined for kaempferol conjugates, procyanidin C trimer 2 and unidentified 14 compounds. Score results and order of the compounds were similar to that of the correlation analysis.
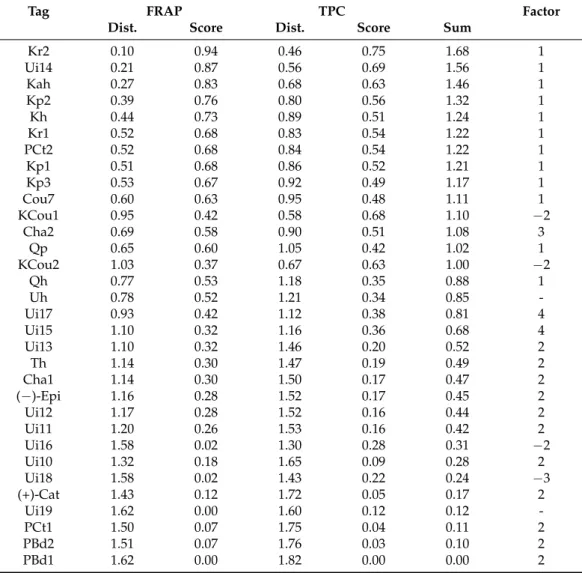
Table 6. Factor analysis of the polyphenol peak areas and the antioxidant properties of eastern hemlock cone extracts. “Factor” indicates the factor that correlates best with the given concentration of a given compound; “Dist.” is the Euclidian distance of a given compound from the FRAP or the TPC vector. FRAP: Ferric Reducing Antioxidant Power; TPC: Total Polyphenol Content. For the interpretation of the tags, please refer to Table1.
Tag FRAP TPC Factor
Dist. Score Dist. Score Sum
Kr2 0.10 0.94 0.46 0.75 1.68 1
Ui14 0.21 0.87 0.56 0.69 1.56 1
Kah 0.27 0.83 0.68 0.63 1.46 1
Kp2 0.39 0.76 0.80 0.56 1.32 1
Kh 0.44 0.73 0.89 0.51 1.24 1
Kr1 0.52 0.68 0.83 0.54 1.22 1
PCt2 0.52 0.68 0.84 0.54 1.22 1
Kp1 0.51 0.68 0.86 0.52 1.21 1
Kp3 0.53 0.67 0.92 0.49 1.17 1
Cou7 0.60 0.63 0.95 0.48 1.11 1
KCou1 0.95 0.42 0.58 0.68 1.10 −2
Cha2 0.69 0.58 0.90 0.51 1.08 3
Qp 0.65 0.60 1.05 0.42 1.02 1
KCou2 1.03 0.37 0.67 0.63 1.00 −2
Qh 0.77 0.53 1.18 0.35 0.88 1
Uh 0.78 0.52 1.21 0.34 0.85 -
Ui17 0.93 0.42 1.12 0.38 0.81 4
Ui15 1.10 0.32 1.16 0.36 0.68 4
Ui13 1.10 0.32 1.46 0.20 0.52 2
Th 1.14 0.30 1.47 0.19 0.49 2
Cha1 1.14 0.30 1.50 0.17 0.47 2
(−)-Epi 1.16 0.28 1.52 0.17 0.45 2
Ui12 1.17 0.28 1.52 0.16 0.44 2
Ui11 1.20 0.26 1.53 0.16 0.42 2
Ui16 1.58 0.02 1.30 0.28 0.31 −2
Ui10 1.32 0.18 1.65 0.09 0.28 2
Ui18 1.58 0.02 1.43 0.22 0.24 −3
(+)-Cat 1.43 0.12 1.72 0.05 0.17 2
Ui19 1.62 0.00 1.60 0.12 0.12 -
PCt1 1.50 0.07 1.75 0.04 0.11 2
PBd2 1.51 0.07 1.76 0.03 0.10 2
PBd1 1.62 0.00 1.82 0.00 0.00 2
3.3.3. Summary for Eastern Hemlock
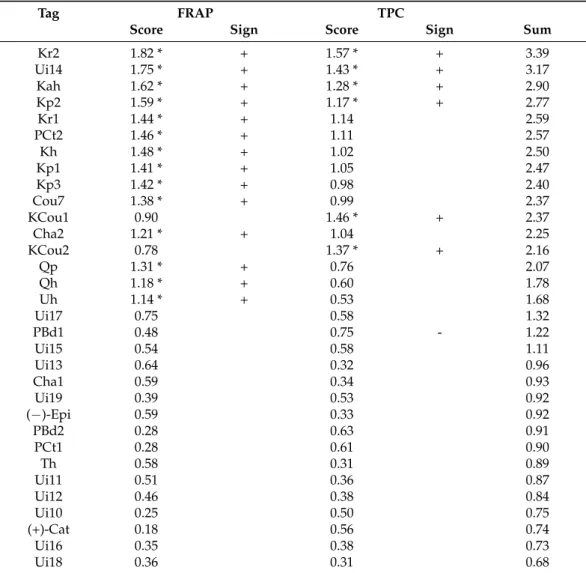
Summary of the scoring evaluation and the type (positive/negative) of the significant correlation between compound concentrations and FRAP/TPC is given in Table7.
Overall, the highest scores were found for kaempferol-O-rutinoside 2 (3.39), Unidenti- fied 14 (3.17), kaempferol-O-hexoside (2.90), kaempferol-O-pentoside 2 (2.77), kaempferol- O-rutinoside 1 (2.59) and procyanidin C trimer 2 (2.57).
According to the sum of scores, the contribution of kaempferol conjugates is the most significant, and surprisingly compounds with high concentrations (e.g., chlorogenic acid isomer 1) showed a low contribution to the overall antioxidant effects. The significant positive correlations for the first four compounds with the highest sum of scores also correlated significantly with FRAP and TPC concentrations. One compound (procyanidin B dimer 1) showed negative correlation with antioxidant capacity, possibly due to pro- oxidant effects, which require further explanation.
As compound Unidentified 14 had the second highest score, information on its struc- ture is important regarding future extraction optimization and utilization of the extracts as well as to the study of its role in possible bioactive effects.
Forests2021,12, 1189 15 of 22
Bioactive effects were studied in the present research by investigating antibacterial effects on the extracts obtained by the 50:50 acetone waterv/vsolvent extraction, which yielded the one of the highest antioxidant capacity solutions.
Table 7.Summary of the chemometric evaluation of the antioxidant efficiency of eastern hemlock cone polyphenols. FRAP: Ferric Reducing Antioxidant Power; TPC: Total Polyphenol Content. “Sign”
indicates the type (positive/negative) of the significant correlation between compound concentrations and FRAP/TPC. Significant correlations (forp< 0.05,n= 11, |R|≥0.60) were marked with an asterisk. For the interpretation of the tags please refer to Table1.
Tag FRAP TPC
Score Sign Score Sign Sum
Kr2 1.82 * + 1.57 * + 3.39
Ui14 1.75 * + 1.43 * + 3.17
Kah 1.62 * + 1.28 * + 2.90
Kp2 1.59 * + 1.17 * + 2.77
Kr1 1.44 * + 1.14 2.59
PCt2 1.46 * + 1.11 2.57
Kh 1.48 * + 1.02 2.50
Kp1 1.41 * + 1.05 2.47
Kp3 1.42 * + 0.98 2.40
Cou7 1.38 * + 0.99 2.37
KCou1 0.90 1.46 * + 2.37
Cha2 1.21 * + 1.04 2.25
KCou2 0.78 1.37 * + 2.16
Qp 1.31 * + 0.76 2.07
Qh 1.18 * + 0.60 1.78
Uh 1.14 * + 0.53 1.68
Ui17 0.75 0.58 1.32
PBd1 0.48 0.75 - 1.22
Ui15 0.54 0.58 1.11
Ui13 0.64 0.32 0.96
Cha1 0.59 0.34 0.93
Ui19 0.39 0.53 0.92
(−)-Epi 0.59 0.33 0.92
PBd2 0.28 0.63 0.91
PCt1 0.28 0.61 0.90
Th 0.58 0.31 0.89
Ui11 0.51 0.36 0.87
Ui12 0.46 0.38 0.84
Ui10 0.25 0.50 0.75
(+)-Cat 0.18 0.56 0.74
Ui16 0.35 0.38 0.73
Ui18 0.36 0.31 0.68
3.4. Antibacterial Effects of the Cone Extracts
The antibacterial effect of four cone extracts (EHGC, EHMC, NSGC, NSMC) was measured using three antimicrobial assays (DDT, MIC and MIC with the following growth curve). In the case of DDT, which was used as a qualitative method [77], the antibacterial activity of the extracts was evaluated visually by measuring the diameter of the inhibition zones around the paper disc. All tested extracts exhibited a very weak inhibition against the Gram-positive strainS. aureusand did not form any area of inhibition with the Gram- negative strainE. coli(Table8). Earlier studies on Norway spruce reported antibacterial effects on Gram-positive bacteria, such asS. aureus[78,79] and no effect or very low effect on the Gram-negative bacteria [80]; however, these studies investigated sapwood, heartwood and resin samples and not the cones.
Table 8.Antibacterial activity of cone extracts (1 mg/mL in 1% DMSO) by disc diffusion test.
Bacterial Strain Positive Control EHGC EHMC NSGC NSMC
S. aureus ++++ + + + +
E. coli ++++ - - - -
++++ Strong activity (zone of inhibition > 15 mm); + Very weak activity (zone of inhibition around 1 mm);
- No activity.
The findings of the DDT were supported by evaluation of other antimicrobial assays (MIC and growth curve). The tested concentration range for MIC assay was measured from 0.016 mg/mL to 1.0 mg/mL. All of the investigated extracts exhibited antibacterial activity of both bacterial strains after 15 h, although extracts showed a higher antibacterial effect on the Gram-positive bacteriumS. aureus. An inhibitory effect was detected in the whole concentration range, resulting in the IC50values summarized in Table9. The inhibitory effects of the NSGC sample were so low that they could not be evaluated. A difference in inhibitory effect between the extracts of green and mature eastern hemlock cones was not observed, which showed the overall best IC50value of 0.25 mg/mL.
Table 9.IC50values of cone extracts (1 mg/mL in 1% DMSO).
Bacterial Strain IC50(mg/mL)
EHGC EHMC NSGC NSMC
S. aureus 0.50 0.50 - 0.25
E. coli - - - -
The investigation of bacterial growth curves (Figures4and5) was also evaluated as a following assay in order to determine a more accurate MIC value (Table10) due to a wider concentration range after 20 h. The growth curve ofS. aureuswas inhibited by all tested extracts. The highest inhibition was observed in the cases of extracts EHMC (0.004 mg/mg) and NSMC (0.008 mg/mL), demonstrating that mature cones exhibit higher antibacterial activity than green cones, despite green cones showing higher antioxidant activity compared to mature cones in general [44]. A possible explanation of this may be that green tissues also contain higher amounts of nutrients (e.g., sugars, amino acids, etc.), which can be of a reducing type, thus contributing significantly to high antioxidant capacity, yet with no or even reverse (growth inducing) bioactive effects due to being nutrients. Such an effect is lower in mature cones. This explanation is justified by the fact that, according to earlier studies of the authors in the case of the two investigated taxa, the polyphenol pool of the green and mature cones is similar (unpublished results). Fyhrquist et al. [81]
tested extracts prepared from Norway spruce needles and bark and recorded a promising antibacterial effect againstS. aureusandBacillus cereus(MIC 0.01075 mg/mL) as well as against Gram-negativeSalmonella enterica(MIC 0.043 mg/mL).
In this study, none of the tested extracts showed inhibition on theE. colistrain, as seen in the example of NSCG extract (Figure3). Similar results had been determined for the sapwood and heartwood extracts of Norway spruce earlier [82], while the study of Tanase et al. [83] revealed an antibacterial effect of polyphenols extracted from Norway spruce bark against Gram-negative bacteria with a MIC of 7.5 mg/mL. Tanase et al. [83]
revealed an antibacterial effect of polyphenols extracted from Norway spruce bark against Gram-negative bacteria with a MIC of 7.5 mg/mL, while Haman et al. investigated the effects of essential oils obtained from wood residues ofPicea abiesagainst the growth of E. coli[84].
Semerci et al. [85] compared the methanolic extracts of the cones of five coniferous taxa and concluded that there was a measurable antibacterial activity againstE. coli. only in the case ofCedrus libani.
Forests2021,12, 1189 17 of 22
Forests 2021, 12, 1189 17 of 23
Table 9. IC50 values of cone extracts (1 mg/mL in 1% DMSO).
Bacterial Strain IC50 (mg/mL)
EHGC EHMC NSGC NSMC
S. aureus 0.50 0.50 - 0.25
E. coli - - - -
The investigation of bacterial growth curves (Figures 4 and 5) was also evaluated as a following assay in order to determine a more accurate MIC value (Table 10) due to a wider concentration range after 20 h. The growth curve of S. aureus was inhibited by all tested extracts. The highest inhibition was observed in the cases of extracts EHMC (0.004 mg/mg) and NSMC (0.008 mg/mL), demonstrating that mature cones exhibit higher anti- bacterial activity than green cones, despite green cones showing higher antioxidant activ- ity compared to mature cones in general [44]. A possible explanation of this may be that green tissues also contain higher amounts of nutrients (e.g., sugars, amino acids, etc.), which can be of a reducing type, thus contributing significantly to high antioxidant capac- ity, yet with no or even reverse (growth inducing) bioactive effects due to being nutrients.
Such an effect is lower in mature cones. This explanation is justified by the fact that, ac- cording to earlier studies of the authors in the case of the two investigated taxa, the poly- phenol pool of the green and mature cones is similar (unpublished results). Fyhrquist et al. [81] tested extracts prepared from Norway spruce needles and bark and recorded a promising antibacterial effect against S. aureus and Bacillus cereus (MIC 0.01075 mg/mL) as well as against Gram-negative Salmonella enterica (MIC 0.043 mg/mL).
Figure 4. Growth curves of S. aureus with (A) Eastern hemlock green cone, (B) Eastern hemlock mature cone, (C) Norway spruce green cone, (D) Norway spruce mature cone extracts.
Figure 4.Growth curves ofS. aureuswith (A) Eastern hemlock green cone, (B) Eastern hemlock mature cone, (C) Norway spruce green cone, (D) Norway spruce mature cone extracts.
Forests 2021, 12, 1189 18 of 23
Figure 5. Growth curves of E. coli with Norway spruce green cone extracts.
Table 10. MIC values of cone extracts (1 mg/mL in 1% DMSO) determined from growth curves.
Bacterial Strain MIC (mg/mL)
EHGC EHMC NSGC NSMC
S. aureus 0.125 0.004 1.000 0.008
E. coli - - - -
In this study, none of the tested extracts showed inhibition on the E. coli strain, as seen in the example of NSCG extract (Figure 3). Similar results had been determined for the sapwood and heartwood extracts of Norway spruce earlier [82], while the study of Tanase et al. [83] revealed an antibacterial effect of polyphenols extracted from Norway spruce bark against Gram-negative bacteria with a MIC of 7.5 mg/mL. Tanase et al. [83]
revealed an antibacterial effect of polyphenols extracted from Norway spruce bark against Gram-negative bacteria with a MIC of 7.5 mg/mL, while Haman et al. investigated the effects of essential oils obtained from wood residues of Picea abies against the growth of E.
coli [84].
Semerci et al. [85] compared the methanolic extracts of the cones of five coniferous taxa and concluded that there was a measurable antibacterial activity against E. coli. only in the case of Cedrus libani.
In a comparative study of the essential oils of four Pinus species, Mitic et al. [86] ob- served that the sensitivity of the tested bacterial pathogens is related to the cell wall struc- ture. Different mechanisms of action can explain the antimicrobial activities of cones, and their wide variety of molecular components can act at multiple levels [87]. Generally, Gram-negative bacteria are more resistant than Gram-positive bacteria because the cell wall does not allow entrance into the cell of hydrophobic molecules present in the cone extracts [88,89]. Nevertheless, some exceptions have been shown [90,91].
4. Conclusions
The present study evaluated the cone extractives of Norway spruce and eastern hem- lock using multiassay antioxidant capacity measurements, liquid chromatography/diode array detection/tandem mass spectrometry. A scoring system was implemented to evalu- ate data of the correlation analysis and factor analysis of the data to identify the com- pounds which contribute most to the high antioxidant capacity of the cone extracts. In Norway spruce, the compounds with the highest antioxidant efficiency were found to be Figure 5.Growth curves ofE. coliwith Norway spruce green cone extracts.
Table 10.MIC values of cone extracts (1 mg/mL in 1% DMSO) determined from growth curves.
Bacterial Strain MIC (mg/mL)
EHGC EHMC NSGC NSMC
S. aureus 0.125 0.004 1.000 0.008
E. coli - - - -
In a comparative study of the essential oils of four Pinus species, Mitic et al. [86]
observed that the sensitivity of the tested bacterial pathogens is related to the cell wall structure. Different mechanisms of action can explain the antimicrobial activities of cones, and their wide variety of molecular components can act at multiple levels [87]. Generally, Gram-negative bacteria are more resistant than Gram-positive bacteria because the cell wall does not allow entrance into the cell of hydrophobic molecules present in the cone extracts [88,89]. Nevertheless, some exceptions have been shown [90,91].
4. Conclusions
The present study evaluated the cone extractives of Norway spruce and eastern hem- lock using multiassay antioxidant capacity measurements, liquid chromatography/diode array detection/tandem mass spectrometry. A scoring system was implemented to evalu- ate data of the correlation analysis and factor analysis of the data to identify the compounds which contribute most to the high antioxidant capacity of the cone extracts. In Norway spruce, the compounds with the highest antioxidant efficiency were found to be piceatannol- O-hexoside and coumaric acid conjugates. In eastern hemlock, the kaempferol conjugates, as well as the procyanidin C trimer isomer and a hitherto-unidentified compound, were shown to have the highest antioxidant efficiency. Surprisingly, the compounds with the highest concentrations (N. spruce: coumaric acid derivative 6; e. hemlock: chlorogenic acid) did not exhibit the highest antioxidant efficiency. The green and mature cone extracts did not suggest any promising antimicrobial activity againstE. coli; an inhibitory effect was only observed onS. aureus, with the best values for mature cones of both taxa. The results indicate that the mature cone extracts of N. spruce and e. hemlock exhibit higher antimicrobial activity againstS. aureusstrain and may serve as a potential source of nat- ural antimicrobials for various purposes. This warrants further investigation. The other bioactive effects of the extracts also need to be evaluated in the future.
Supplementary Materials:The following are available online athttps://www.mdpi.com/article/
10.3390/f12091189/s1, Table S1: Peak areas (from UV 250–380 nm chromatograms) of the different compounds separated from aqueous acetonic extracts of Norway spruce cones. FRAP and TPC indicate the antioxidant capacity of the extracts, Table S2: Results of the factor analysis involving the FRAP and TPC antioxidant capacity as well as peak areas of Norway spruce cone extracts. Factor loadings were calculated with the Varimax normalized method. Only the highest factor values (>0.7) were indicated. Cumulative total variance of the three factors was: 93.76%; Table S3: Peak areas (from UV 250–380 nm chromatograms) of the different compounds separated from aqueous/acetonic extracts of eastern hemlock cones. FRAP and TPC indicate the antioxidant capacity of the extracts;
Table S4: Results of the factor analysis involving the FRAP and TPC antioxidant capacity as well as peak areas of eastern hemlock cone extracts. Factor loadings were calculated with the Varimax normalized method. Only the highest factor values (>0.7) were indicated. Cumulative total variance of the four factors was 90.9%.
Author Contributions:Conceptualization, T.H., E.V.-R., L.N. and M.V.; methodology, E.V.-R., N.S.;
software, L.N.; formal analysis, L.N.; investigation, N.S. and E.V.-R.; resources, writing—original draft preparation, T.H., E.V.-R., L.N., N.S., M.V.; writing—review and editing, T.H., L.A., S.V. and M.V.; visualization, T.H. and M.V.; project administration, L.A.; funding acquisition, L.A. Please turn to the CRediT taxonomy for the term explanation. Authorship must be limited to those who have contributed substantially to the work reported. All authors have read and agreed to the published version of the manuscript.
Funding:The research was made in frame of the “EFOP-3.6.1-16-2016-00018—Improving the role of research, development, and innovation in higher education through institutional developments assisting intelligent specialization in Sopron and Szombathely”. The research was supported by the ÚNKP-20-5-12 New National Excellence Program of the Ministry for Innovation and Technology from the source of the National Research, Development and Innovation Fund and by the János Bolyai Research Scholarship of the Hungarian Academy of Sciences and by the ERDF “Multidis- ciplinary research to increase application potential of nanomaterials in agricultural practice” (No.
CZ.02.1.01/0.0/0.0/16_025/0007314).
![Table 1. Liquid chromatographic/mass spectrometric identification of the major extractives in the cones of Norway spruce (S) and eastern hemlock (H); t r : retention time; [M-H] − : parent ion; MS/MS: major fragment ions; n.i.: no ions.](https://thumb-eu.123doks.com/thumbv2/9dokorg/751736.31837/5.892.58.833.187.1158/liquid-chromatographic-spectrometric-identification-extractives-norway-retention-fragment.webp)