Structural and magnetic study of the iron cores in iron(III)- polymaltose pharmaceutical ferritin analogue Ferrifol®
I.V. Alenkina, V. Kovacs Kis, I. Felner, E. Kuzmann, Z. Klencsár, M.I. Oshtrakh
PII: S0162-0134(20)30230-0
DOI: https://doi.org/10.1016/j.jinorgbio.2020.111202
Reference: JIB 111202
To appear in: Journal of Inorganic Biochemistry Received date: 6 April 2020
Revised date: 6 July 2020 Accepted date: 11 July 2020
Please cite this article as: I.V. Alenkina, V.K. Kis, I. Felner, et al., Structural and magnetic study of the iron cores in iron(III)-polymaltose pharmaceutical ferritin analogue Ferrifol®, Journal of Inorganic Biochemistry (2020), https://doi.org/10.1016/
j.jinorgbio.2020.111202
This is a PDF file of an article that has undergone enhancements after acceptance, such as the addition of a cover page and metadata, and formatting for readability, but it is not yet the definitive version of record. This version will undergo additional copyediting, typesetting and review before it is published in its final form, but we are providing this version to give early visibility of the article. Please note that, during the production process, errors may be discovered which could affect the content, and all legal disclaimers that apply to the journal pertain.
© 2020 Published by Elsevier.
Journal Pre-proof
Structural and magnetic study of the iron cores in iron(III)-polymaltose pharmaceutical ferritin analogue Ferrifol®
I.V. Alenkinaa, V. Kovacs Kisb,c, I. Felnerd, E. Kuzmanne, Z. Klencsárb, M.I. Oshtrakha,*
aDepartment of Experimental Physics, Institute of Physics and Technology, Ural Federal University, Ekaterinburg, 620002, Russian Federation;
bCentre for Energy Research, Konkoly-Thege Miklós út. 29-33, 1121 Budapest, Hungary;
cInstitute of Environmental Sciences, University of Pannonia, H-8200 Veszprém, Egyetem út. 10. Hungary;
dRacah Institute of Physics, The Hebrew University, Jerusalem, 91904 Israel;
eLaboratory of Nuclear Chemistry, Institute of Chemistry, Eötvös Loránd University, Budapest, Hungary
Abstract
Iron(III)-polymaltose pharmaceutical ferritin analogue Ferrifol® was investigated by high resolution transmission electron microscopy (HRTEM), X-ray diffraction, thermogravimetry, electron magnetic resonance (EMR) spectroscopy, dc magnetization measurements and 57Fe Mössbauer spectroscopy to get novel information about the structural arrangement of the iron core.
The Ferrifol® Mössbauer spectra measured in the range from 295 to 90 K demonstrated non- Lorentzian two-peak pattern. These spectra were better fitted using a superposition of 5 quadrupole doublets with the same line width. The obtained Mössbauer parameters were different and an unusual line broadening with temperature decrease was observed. Measurements of the Ferrifol®
Mössbauer spectra from 60 to 20 K demonstrated a slow decrease of magnetic relaxation in the iron core. Zero-field-cooled and field-cooled magnetization measurements revealed a blocking temperature at ~33 K and paramagnetic state of the Ferrifol® iron core at higher temperatures.
Isothermal magnetization measurements at 5 K show that the saturation magnetic moment is ~0.31 emu/g. X-band EMR spectroscopy measurements revealed the presence of different magnetic species in the sample. Transmission electron microscopy demonstrated that the size of the iron cores in Ferrifol® is in the range 2–6 nm. The lattice periodicity in these iron cores, measured on the HRTEM images, appeared to be vary in the range 2.2–2.7 Å. This can be best understood as sets of close packed O(OH) layers in ferrihydrite cores without long range correlation.
Keywords: Ferrifol® and ferritin; Iron core; Mössbauer spectroscopy; Magnetization measurements; High resolution transmission electron microscopy
__________________________________________
*Corresponding author: E-mail oshtrakh@gmail.com
Journal Pre-proof
Introduction
Iron is an essential element for living systems which is involved in many biological processes from oxygen transport till electron transport. The organism’s needs in iron for iron-containing proteins synthesis are realized through iron deposition and release by iron storage protein ferritin.
This macromolecule consists of spherical multi-subunit shell with an internal cavity of 10 nm which contains a nanosized ferrihydrite core (approximate formulae are 5Fe2O39H2O or (FeOOH)8(FeO:ОРО3Н2)) with up to 4500 Fe atoms (see reviews [1–8]). This protein deposits iron in non-toxic bioavailable form. However, iron deficiency resulting from various causes such as hereditary diseases, pregnancy, blood loss, insufficient dietary iron intake (nutritional deficiency), etc., leads to serious consequences for the organism and health known as iron deficiency anemia (see, for example, [9, 10]). Therefore, in the case of iron deficiency anemia an external source of iron is required. The most effective pharmaceuticals designed to replenish iron deficiency and treat anemia appeared to have a very close structure to ferritin with non-toxic iron, thus they can be supposed as ferritin synthetic analogues. These analogues also contain nanosized iron core in the forms of β-FeOOH or ferrihydrite as determined by their initial iron source before synthesis: the first form appeared in the presence of Cl– ions, when FeCl2 was used for preparation. The obtained ferric hydrous oxide core was covered by protective polysaccharide shell imitating the ferritin coat in the native protein. Various polysaccharides can be used for the shell such as dextran, dextrin, polymaltose, etc. Manufactured iron(III)-oxyhidroxides–polysaccharide complexes can be produced as solutions for injections (for example, Imferon®), tablets and drops/syrup (for instance, Maltofer®). Note that the tablets containing iron(III)–polymaltose complexes appeared to be much more effective drugs for oral administration than tablets with ferrous compounds [11]. Therefore, ferritin pharmaceutical analogues are of interest for the study in comparison with the native protein.
One of the most interesting problems in this case is associated with the iron core structure in both ferritin and its pharmaceutical analogues because it could be directly related to their biological functions and effectiveness for anemia treatment. Various structural investigations of ferritin iron cores by transmission electron microscopy (TEM), X-ray absorption spectroscopy and electron nanodiffraction resulted in a variety of iron core models [12–19]. Applications of magnetization and Mössbauer spectroscopy measurements in the study of various ferritins and its pharmaceutical analogues demonstrated spread approaches also (see, for example, [20–29], for review see [30–32]).
Using Mössbauer spectroscopy in our earlier studies of ferritin and some pharmaceutical analogues (iron-dextran complexes including Imferon®, iron-polymaltose complexes Ferrum Lek and Maltofer®) we developed heterogeneous iron core models in order to fit their Mössbauer spectra, which implies different regions/layers in ferric hydrous oxide cores with corresponding different
Journal Pre-proof
quadrupole splitting mainly [33–42]. Moreover, recently we observed unusual temperature dependences of some Mössbauer parameters for ferritin and Ferrum Lek [39] and then for Maltofer® which were interpreted as a result of rearrangement of more and less close-packed FeOOH regions/layers in the iron cores [42]. Preliminary study of another iron-polymaltose complex Ferrifol® using Mössbauer spectroscopy at selected temperatures showed similar anomalies [41, 43] which must be analyzed in detail. Therefore, in this work we present extended studies of the iron core in Ferrifol® by means of high resolution TEM (HRTEM), X-ray diffraction (XRD), thermogravimetry (TG), electron magnetic resonance (EMR) spectroscopy, dc magnetization measurements and 57Fe Mössbauer spectroscopy in a wide temperature range.
Materials and methods
Powdered sample of Ferrifol® (CTS Chemical Industries Ltd., Israel) was prepared from about 1/3 of tablet containing 100 mg of Fe. For Mössbauer measurements the Ferrifol® powder was placed into Plexiglas sample holder with a diameter of 2 cm and tightly pressed accounting the final sample thickness to be ~8 mg Fe/cm2. In some cases, 100 mg of powdered lyophilized human liver ferritin (prepared as shown in [34]) placed into similar sample holder was used as a reference material.
TEM and HRTEM images of Ferrifol® and ferritin were obtained at the Centre for Energy Research (Budapest) using (i) a JEOL 3010 transmission electron microscope at 300 keV (LaB6 cathode, 0.17 nm point-to-point resolution, UHR pole piece) equipped with GIF and (ii) a FEI‐
Themis 200 G3 transmission electron microscope at 200 keV with a CS corrected objective lens (FEG, point resolution is around 0.09 nm in HREM mode and 0.16 nm in STEM mode).
Suspension samples for TEM analysis were prepared using distilled water. A drop of the resulting suspension was deposited onto ultrathin carbon coated gold TEM grid (Ted Pella). The HRTEM images were analyzed using the Digital Micrograph (Gatan Tridiem) software.
X-ray powder diffraction of Ferrifol® powdered tablet was measured using the XRD–7000 powder diffractometer (Shimadzu) operated at 40 kV and 30 mA with CuK radiation using a monochromator, scanned over 2 from 5 to 80 at the Ural Federal University (Ekaterinburg).
Thermogravimetry of Ferrifol® was carried out using SETSYS Evolution (Setaram) at the Institute of Solid State Chemistry, Ural Branch of the Russian Academy of Sciences (Ekaterinburg) in order to have the weight of inorganic part for magnetization measurements.
Magnetization measurements on 46.6 mg powdered Ferrifol® mounted in gel-caps were performed using a SQUID magnetometer MPMS-5S (Quantum Design) in the temperature range from 300 K to 5 K at the “Racah” Institute of Physics, the Hebrew University (Jerusalem). The
Journal Pre-proof
weight was further corrected for inorganic part only using our TG data. The differential SQUID sensitivity was 10–7 emu.
X-band EMR spectroscopy measurements of Ferrifol® were performed at the Institute of Physics, Budapest University of Technology and Economics (Budapest), with a Bruker ElexSys E500 X-band spectrometer by recording the first derivative of the microwave absorption power with respect to the applied magnetic field. Measurements were carried out at temperatures in the range from 140 K to 290 K: (i) on 20 mg of powdered Ferrifol® sample at 290 K and (ii) on a sample prepared as a mixture of 20 mg of Ferrifol® powder with ~250 mg KBr powder, in order to avoid texture and orientation of magnetic particles. The conditions of EMR measurements involved a modulation frequency of 100 kHz, modulation amplitude of 1 G, microwave power of
~2 mW and microwave frequency of f 9.3 GHz. The spectra were scanned in the field range of 100–10900 G with a sweep time of ~84 s. The magnetic field axis of the obtained spectra was rescaled according to f0 9.33 GHz for further processing. Fitting and decomposition of EMR spectra was carried out by using the MossWinn software [44] that was complemented for this purpose with auxiliary libraries providing the fitting functions for the EMR signal of powders made of magnetic particles with either uniaxial or cubic magnetocrystalline anisotropy.
57Fe Mössbauer spectra of Ferrifol® were measured in the two different temperature ranges.
In the range from 295 to 90 K we have used Mössbauer spectrometric system with a high velocity resolution, build on the base of SM-2201 spectrometer and temperature variable liquid nitrogen cryostat with moving absorber at the Ural Federal University (Ekaterinburg). This spectrometer operates with a saw-tooth shape velocity reference signal formed by the digital-analogue converter using discretization of 212 (quantification using 4096 steps). Detailed description and the advances of this system were given in [45, 46] and references therein. The 57Со(Rh) source of ~1.0×10⁹ Bq (Ritverc GmbH, St. Petersburg, Russian Federation, an initial activity was of ~1.8×10⁹ Bq) was used at room temperature. The spectra were measured in transmission geometry and registered in 4096 channels. Statistical count rates for Ferrifol® were in the range of (3.6–3.8)×105 counts per channel with the signal-to-noise ratios in the range from 113 to 137. The measured Mössbauer spectra were further computer fitted using the UNIVEM-MS program with a least squares procedure using the Lorentzian line shape. Parameters determined for the measured spectra were isomer shift, δ, quadrupole splitting, ΔEQ, line width, Γ, relative subspectrum area, A, and normalized statistical criterion of fitting quality χ2. The best fits were determined using differential spectrum (the difference between experimental and calculated spectra), χ2 and physical meaning of the spectral parameters. Calibration of the velocity scale and control of the velocity signal in the small velocity range were performed using the reference absorber of sodium nitroprusside (SNP) with a thickness of 5 mg Fe/cm2. The line shape of SNP was a pure Lorentzian and the value
Journal Pre-proof
measured in 4096 channels was 0.2310.002 mm/s. The velocity resolution in the spectra measured by SM-2201 spectrometer in the small velocity range was of ~0.001 mm/s per channel.
Additionally, we used the large velocity range with calibration by means of the reference absorber of -Fe foil with a thickness of 7 m (the spectrum lines were also narrow and Lorentzian). This velocity range was used for the 90 K Ferrifol® Mössbauer spectrum measurement. The instrumental (systematic) errors for each spectrum point and for the hyperfine parameters were equivalent to 0.5 and 1 channel, respectively. If an error calculated with the fitting procedure (statistical or fitting error) for these parameters exceeded the instrumental (systematic) error, a larger error was used. The values of isomer shift are given relative to –Fe at 295 К.
The Mössbauer spectra of Ferrifol® sample were measured at 20 K, 40 K and 60 K using a KFKI-type spectrometer with a triangular velocity reference signal and an APD close cycle liquid helium cryostat at the Eötvös Loránd University (Budapest). The 57Со(Rh) source of ~0.8×10⁹ Bq (Ritverc GmbH, St. Petersburg, Russian Federation) was used at room temperature. The spectrum was measured in transmission geometry with a moving source in the large velocity range and registered in 250-channel mirror spectra with further folding. Statistical count rates for the Ferrifiol® spectra were in the range ~(4.0–5.0)×105 counts per channel with the signal-to-noise ratios of 38–40. Calibration of the velocity scale was done with the same reference absorber of -Fe as mentioned above. The velocity resolution in these spectra was ~0.09–0.10 mm/s per channel.
These spectra were fitted using MossWinn code [44] and UNIVEM-MS program to obtain qualitative characteristics only. The values of magnetic hyperfine field, Heff, were obtained in addition to above mentioned Mössbauer parameters.
Results and discussion
TEM image of Ferrifol® sample shown in Fig. 1a demonstrates dispersed nanoparticles (iron cores) with variety of shapes between spherical and ellipsoidal. The particles’ size distribution was estimated using the ratio between the major and minor axes of ellipsoid particles’ shape (Fig. 1b) and by particles’ diameter evaluated using spherical fit (Fig. 1c). These particles have sizes in the range of 2–6 nm. Similar ellipsoid shape with 6 nm average size of the iron cores was observed in another iron-polymaltose complex Ferrum Lek [47].
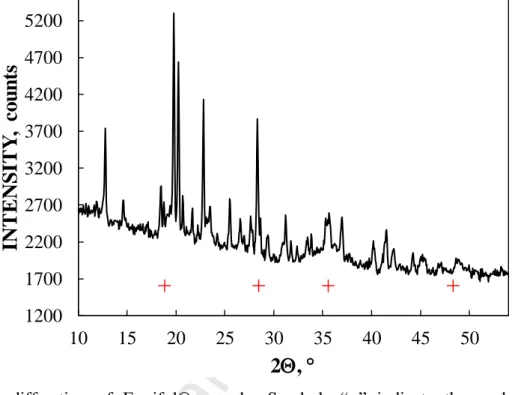
XRD pattern of Ferrifol® is shown in Fig. 2. A comparison of peak positions for akaganéite and ferrihydrite showed that the iron core in Ferrifol® consists of ferrihydrite instead of akaganéite which was observed in the other iron-polymaltose complexes Ferrum Lek and Maltofer® (see [40]).
The mass loss and heat flow in Ferrifol® determined by TG are shown in Fig. 3. The weight of inorganic part of Ferrifol® was determined as ~24 % of the initial sample weight. This result
Journal Pre-proof
appeared to be similar to that obtained for Ferrum Lek and Maltofer® while smaller than the mass loss for ferritin (~33 %) [40]. The weights of the inorganic parts in Ferrifol® and ferritin will be used for the quantitative magnetization measurements shown below.
Fig. 1. Transmission electron microscopy image of Ferrifol® (a), the ratio between the major and minor axes of ellipsoid particles’ shape (b) and distribution of particles’ diameter evaluated using spherical fit (c).
The temperature dependence of zero-field-cooled (ZFC) and field-cooled (FC) magnetization M(T) curves measured at 250 Oe and the isothermal field dependence of the magnetization M(H) measured at 5 and 295 K are displayed in Fig. 4. A pronounced peak at 14 K is observed in ZFC plot Fig. 4a (inset) and the two curves merge at blocking temperature TB = 33 K. In that sense this behavior is very similar to pure ferritin shown in Fig. 4b. Above TB both curves up to 300 K
b c
a
Journal Pre-proof
exhibits a typical paramagnetic (PM) shape and adheres to the Curie-Weiss (CW) law: (T) = 0
+C/(T–), where = (M/H), 0 is the temperature independent part, C is the Curie constant, and is the CW temperature. The extracted PM parameters are: 0 =2.110–6 emu/g Oe, C = 0.0158(1) emu K/g Oe and = –3.7(2) K. The negative value indicates clearly the presence of anti- ferromagnetic exchange forces in Ferrifol® at low temperatures below TB.
Fig. 2. X-ray diffraction of Ferrifol® sample. Symbols “+” indicate the peak positions for ferrihydrite (ICDD 01-073-8408).
Fig. 3. Thermogravimetry of Ferrifol® sample.
1200 1700 2200 2700 3200 3700 4200 4700 5200
10 15 20 25 30 35 40 45 50
INTENSITY, counts
2,
0 2 4 6 8 10
20 30 40 50 60 70 80 90 100
0 200 400 600 800 1000
HEAT FLOW, W/g
MASS, %
TEMPERATURE, C
Journal Pre-proof
Fig. 4. Comparison of magnetization measurements for inorganic part (iron cores) in Ferrifol® and ferritin: zero-field-cooled (ZFC) and field-cooled (FC) curves measured at indicated fields (a and b) and isothermal magnetization curves (c, d and e). Exp is experimental points, Par is paramagnetic contribution, MS is the saturation magnetic moment, HC is coercive field.
The isothermal M(H) curves measured at 5 and 295 K (Fig. 4c) confirm this picture. At 5 K, the magnetization first increases linearly up to 10–15 kOe and then tends to saturate. This M(H) plot clearly reveals an admixture of magnetic and PM components and can be fitted as: M(H) = MS +
pH, where the saturation moment (corrected) MS = 1.29 emu/g, is the intrinsic magnetic phase(s) contribution, and pH (p = 2.210–5 emu T/g Oe) is the linear PM contribution (Fig. 4d). This MS
is 20% higher than that of pure Ferritin shown in Fig. 4e. Thus, below TB an admixture of two
Ferrifol® Ferritin
Ferrifol® Ferrifol®
Ferritin
Journal Pre-proof
magnetic states exist, namely, part of the sample is PM and part seems to be anti-ferromagnetically ordered. On the other hand, M(H) at 295 K is linear with the slope of 7.65 emu T/g Oe, up to 50 kOe (Fig. 4c), indicating a pure PM state above TB of the entire material.
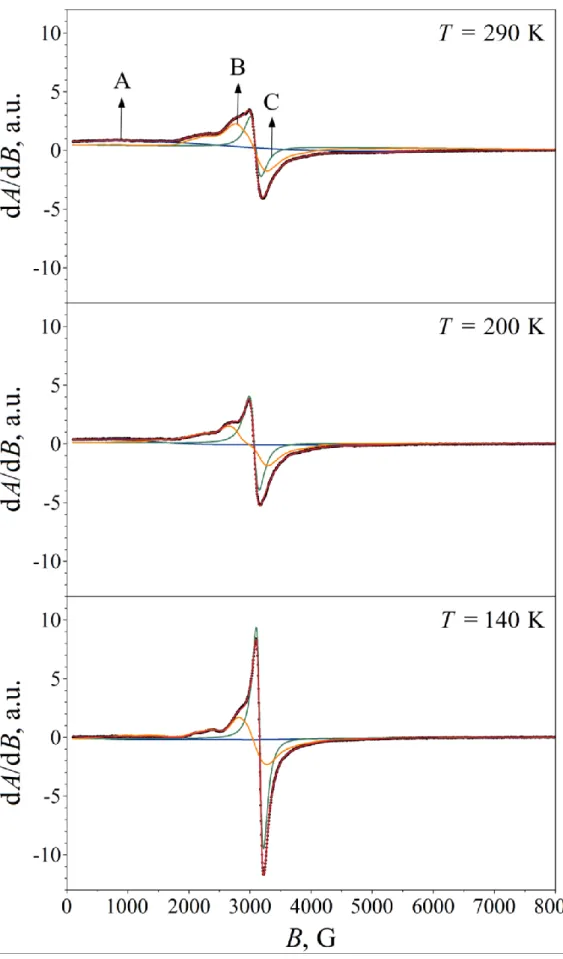
The room temperature X-band EMR spectrum of the original Ferrifol® powder (Fig. 5) reveals several groups of components. The signal group around B 1000 G may originate from magnetic particles whose easy magnetization axis tends to align along the externally applied magnetic field. The broad signal group at around B 2500 G may refer to magnetic particles with a random orientation of their easy magnetization axis, whereas the relatively sharp signal at B 3000 G indicates the presence of paramagnetic or superparamagnetic particles in the sample. When the same sample is mixed with KBr powder (in order to ensure random orientation of easy magnetization axes), the signal group formerly around B 1000 G merges with the central (B 2500–3000 G) region, and the peak of a very broad, low-amplitude signal becomes apparent in its former position (Fig. 6). The latter signal, having a peak-to-peak width of pp 3.7 kG at T = 290 K, may refer to randomly oriented magnetic particles with a relatively large magnetic anisotropy field.
Fig. 5. X-band EMR spectrum of original Ferrifol® powder measured at T = 290 K.
With decreasing temperature this latter ferromagnetic resonance signal (referred to as signal
“A” in the followings, see Fig. 6) shifts towards lower fields, reflecting a simultaneous increase in the effective magnetization of the corresponding particles. During the fit of the spectra the asymmetry of the corresponding signal was well accounted for by assuming that it originates from magnetic particles with a large negative cubic magnetocrystalline anisotropy. The intrinsic g factor of this signal at 290 K was derived to be 2.26, with a magnetic anisotropy field of BA = 2K1/MS – 0.244 T, where K1 stands for the (apparently negative) first-order cubic magnetocrystalline
Journal Pre-proof
anisotropy constant and MS denotes the saturation magnetization. A possible source of this component is magnetite that is known to display negative cubic magnetocrystalline anisotropy at room temperature [48–50]. Taking K1 = –1.08×10⁴ J/m3 and MS = 4.72×10⁵ A/m (as found for synthetic single crystals of magnetite [48]), we get BA –0.046 T, roughly 20% of the value we have deduced. However, ultrafine (10 nm in diameter) magnetite nanoparticles were shown to exhibit considerably larger magnitude (K1 –5.8×10⁴ J/m3) of the effective first-order cubic magnetocrystalline anisotropy constant in ferrofluids [49], which value yields BA = 2K1/MS – 0.246 T in good agreement with the value we found for signal “A”. Therefore, it is plausible to attribute signal “A” to a tiny amount of magnetite.
The relatively narrow singlet “C” (Fig. 6) was fitted with a Lorentzian derivative characterized by g 2.15 and pp 175 G at 290 K. The absolute as well as the relative intensity of this singlet is clearly enhanced with decreasing temperature, which is the expected behavior in case of paramagnets for which the temperature dependence of the power of microwave absorption should reflect that of the static magnetic susceptibility. The corresponding particles may then also contribute to the non-saturating part of the magnetization curve of Ferrifol® at 5 K (Fig. 4).
The signal group “B” can be associated with magnetic particles displaying different values of a moderate magnetic anisotropy field. This signal group could be fitted by assuming that the associated particles display uniaxial magnetic anisotropy with a distribution in their effective magnetic anisotropy field. Particle size distribution as well as diversity in the shape of the particles may both contribute to such a distribution in the effective magnetic anisotropy field. In the fits shown in Fig. 6, signal group “B” is composed of components displaying either negative or positive uniaxial magnetic anisotropy field. Negative uniaxial (magnetocrystalline) anisotropy (easy plane of magnetization) may be associated with ferrihydrite particles (with hexagonal crystal structure [51, 52]) without strong anisometricity. At the same time, positive uniaxial anisotropy (easy magnetization axis) may develop in anisometric particles (Fig. 1) due to magnetic shape anisotropy.
The Mössbauer spectra of Ferrifol® measured in the temperature range from 295 to 90 K and the spectrum of ferritin measured at 98 K are shown in Fig. 7. Recently, it was shown that non- Lorentzian line shape of the 295 K and 220 K Ferrifol® spectra could be fitted using a distribution of quadrupole splittings with further decomposition of distribution shapes using at least 4 peaks that indicated slightly different 57Fe microenvironments in the iron core [43]. Therefore, we used the previously considered heterogeneous iron core model to fit the Mössbauer spectra of ferritin and its pharmaceutical analogues Ferrum Lek and Maltofer® as well [41, 42]. The results of the Ferrifol®
spectra fits are shown in Fig. 7: all spectra were fitted with a superposition of five quadrupole doublets with similar isomer shifts, different quadrupole splitting and the same line width as a free parameter which was varied during the fit.
Journal Pre-proof
Fig. 6. X-band EMR spectra of Ferrifol® powder mixed with KBr powder and measured at the indicated temperatures (black dots), along with the subcomponents and fit envelop fitted to the spectra (solid lines).
Journal Pre-proof
Fig. 7. Mössbauer spectra of Ferrifol® measured in the temperature range from 295 K to 90 K and ferritin measured at 98 K. Indicated components are the results of the best fits. The differential spectra are shown on the bottom of the spectra.
We can see that this fitting model developed for ferritin, Ferrum Lek and Maltofer® is also applied for Ferrifol® and fitted well all Mössbauer spectra in the range from 295 K to 90 K. Again, we observed an unusual line broadening as the temperature is decreased which is shown in Fig. 8 for both Ferrifol® and ferritin. Earlier, we have shown that observed anomalous line broadening cannot be a result of: (i) the cryostat vibrations, (ii) sample particles vibrations in case of moving absorber and (iii) an increase of the effective samples thickness with temperature decrease [39].
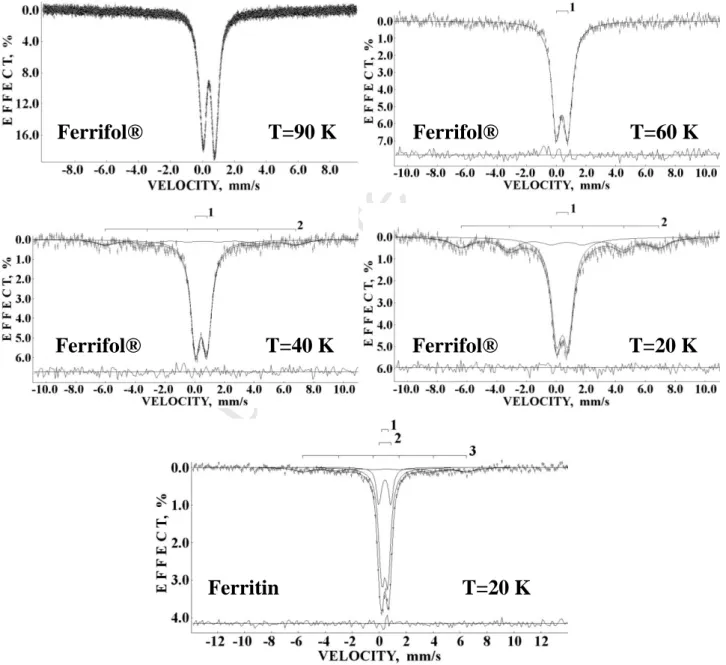
However, the effect of slowing down of magnetic relaxation in nanosized iron cores in Ferrifol® should be checked. For this reason, Mössbauer spectra of Ferrifol® were measured in a large velocity range at temperatures of 90 K, 60 K, 40 K and 20 K and compared with the Mössbauer spectrum of ferritin at 20 K (see Fig. 9). It is clearly seen that the magnetically split component appears in the Ferrifiol® spectrum below 60 K only: at 40 K A17 %, Heff~400 kOe while at 20 K A34 %, Heff~413 kOe. In case of the ferritin Mössbauer spectrum, a weak magnetic sextet (A17 %, Heff~380 kOe) can be seen at 20 K. This means that the anisotropy energy barrier
T=295 K
Ferrifol® Ferrifol® T=220 K Ferrifol® T=170 K
T=140 K
Ferrifol® Ferrifol® T=125 K Ferrifol® T=105 K
T=98 K
Ferrifol® Ferrifol® T=90 K Ferritin T=98 K
Journal Pre-proof
for the iron cores in ferritin is a bit smaller than that in Ferrifol®. Similar results were obtained by ZFC-FC magnetization measurements (Fig. 4) showed that the blocking temperature for Ferrifol®
(~33 K) was higher than that for ferritin (~22 K). These facts indicate that the line broadening in the Mössbauer spectrum of Ferrifol® resulting from the magnetic relaxation factor should started at higher temperatures than that for ferritin. However, we can see from Fig. 8 that the line broadening starts for ferritin at so-called critical temperature T0 ~150 K while that for Ferrifol® is about ~138 K. Therefore, we can exclude relaxation factor as the main reason of the unusual line broadening in the Mössbauer spectra of Ferrifol® with temperature decrease as suggested in [39, 42]. In this case anomalous line broadening could be related to some internal processes in the iron core which are more dominant at low temperatures down to 90 K.
Fig. 8. Unusual temperature dependent line broadening observed for the Ferrifol® Mössbauer spectra in comparison with that of ferritin. T0 – is a conventional critical temperature of crossing two different slopes (indicated with dashed lines) for the line width temperature dependences.
When comparing the decomposition of EMR spectra (Fig. 6) with that of the 57Fe Mössbauer spectra (Fig. 7) one should consider that the characteristic time through which the applied X-band
0.238 0.258 0.278 0.298 0.318 0.338 0.358
80 100 120 140 160 180 200 220 240 260 280 300
LINE WIDTH, mm/s
TEMPERATURE, K
– Ferrifol®
– ferritin
T
0=~150 K
T
0=~138 K
Journal Pre-proof
EMR spectroscopy samples the magnetic state of the material is ca. 2 orders of magnitude shorter than the corresponding time characteristic to 57Fe Mössbauer spectroscopy. Consequently, particles that contribute with ferri- or ferromagnetic signals to the EMR spectrum may appear as a superparamagnetic component in the corresponding 57Fe Mössbauer spectrum. Furthermore, it should also be considered that while antiferromagnetic iron bearing materials may not produce an EMR signal, they can readily contribute to the 57Fe Mössbauer spectra. It should also be mentioned that the measured EMR spectra may also be contributed by signals originating from minute amounts of paramagnetic ions other than Fe3+, which possibility was not considered in the present analysis.
Fig. 9. Mössbauer spectra of Ferrifol® at temperatures of 90 K, 60 K, 40 K and 20 K and ferritin at 20 K measured in the large velocity range. Indicated components are the result of the best fits. The differential spectra are shown at the bottom of the fitted spectra.
Ferrifol® Ferrifol®
Ferrifol® Ferrifol®
Ferritin
T=90 K T=60 K
T=40 K T=20 K
T=20 K
Journal Pre-proof
Based on the heterogeneous iron core model for the fitting of the Mössbauer spectra of Ferrifol®, we can assign the quadrupole doublet with the smallest EQ value to the most close- packed FeOOH regions/layers in the iron core while that with the largest EQ value can be related to the less close-packed FeOOH regions/layers. In this case we can consider the temperature dependence of and EQ values for the corresponding quadrupole doublets related to different regions/layers in the iron core in the range from 295 K to 90 K as shown in Fig. 10. These dependences are similar to those observed earlier for ferritin, Ferrum Lek and Maltofer® [42]. The values of demonstrate different character of temperature dependences for the two quadrupole doublets with the smallest EQ values and that of the rest three quadrupole doublets with intermediate and the largest EQ values, in which the values unusually tend to decrease below 120–140 K. An increase of EQ values with temperature demonstrates different behavior also.
Three quadrupole doublets with the largest EQ values show much more rapid increase of EQ values below 120 K as compared to the two other quadrupole doublets. These results may be related to some structural disorders in the corresponding FeOOH regions/layers resulting in some variations in the 57Fe hyperfine parameters.
Fig. 10. Temperature dependencies of Mössbauer hyperfine parameters for Ferrifol®: doublet 1,
doublet 2, doublet 3, doublet 4, doublet 5.
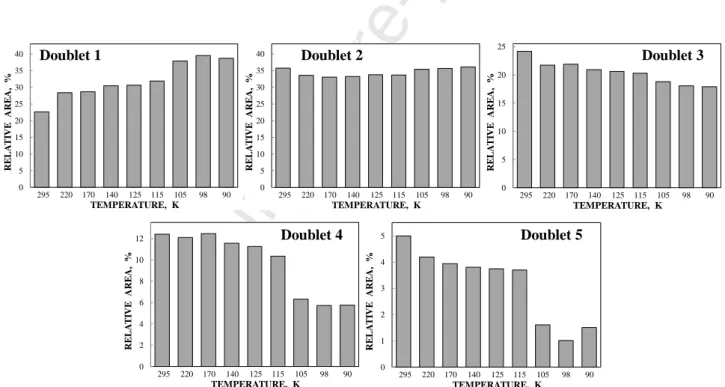
Further, we compare temperature dependences of the relative areas of the Ferrifol®
Mössbauer spectra components between 295 and 90 K (Fig. 11). It is interesting to observe different tendencies in the temperature dependences of A for different components. In case of the most close- packed region/layer in the core (quadrupole doublet 1) the relative area increases when temperature
0.310 0.330 0.350 0.370 0.390 0.410 0.430 0.450 0.470
80 100 120 140 160 180 200 220 240 260 280 300
ISOMER SHIFT, mm/s
TEMPERATURE, K
0.400 0.600 0.800 1.000 1.200 1.400 1.600 1.800 2.000 2.200 2.400
80 100 120 140 160 180 200 220 240 260 280 300
QUADRUPOLE SPLITTING, mm/s
TEMPERATURE, K
Journal Pre-proof
decreases while the second most close-packed region/layer in the core (quadrupole doublet 2) remains almost the same. In contrast, three less close-packed layers/regions demonstrate a tendency of the relative areas to decrease when temperature decreases. Therefore, we can suggest that the decrease with temperature of the less close-packed regions/layers in the core accompanies with increasing the most close-packed region/layer in the core. In this case the low-temperature rearrangements in the iron core may take place with variations (i) in the areas of these regions/layers and (ii) in corresponding Mössbauer hyperfine parameters. Moreover, this rearrangement can increase the internal dynamics in the core which accompanied by an anomalous line broadening and a decrease in the absorption effect below 125 K as can be seen in Fig. 7. This result may confirm earlier data of the EXAFS study of ferritin iron core, which demonstrated a considerable structural disorder in the core at low temperatures, which the authors supposed as a possible low temperature phase transition [53]. In any case, the obtained results confirm the heterogeneous iron core model to fit Mössbauer spectra of ferritin and its pharmaceutical analogues and associate different quadrupole doublets with more or less close-packed FeOOH regions/layers in the core.
Fig. 11. Different variations of the relative areas of five quadrupole doublets obtained from the Mössbauer spectra of Ferrifol® with temperature decrease.
To check this model, we obtained HRTEM images of both Ferrifol® (Fig. 12) and ferritin (Fig. 13) as well as the Fourier transforms (FT) of areas of ca. 5050 nm were calculated to characterize the average structure of the nanosized iron cores. The iron cores in these images constitute ordered domains with lattice periodicities between 2.0 and 2.7 Å for both Ferrifol® and
0 5 10 15 20 25 30 35 40
RELATIVE AREA, %
TEMPERATURE, K
295 220 170 140 125 115 105 98 90 0
5 10 15 20 25 30 35 40
RELATIVE AREA, %
TEMPERATURE, K
295 220 170 140 125 115 105 98 90 0
5 10 15 20 25
RELATIVE AREA, %
TEMPERATURE, K
295 220 170 140 125 115 105 98 90
0 2 4 6 8 10 12
RELATIVE AREA, %
TEMPERATURE, K
295 220 170 140 125 115 105 98 90 0
1 2 3 4 5
RELATIVE AREA, %
TEMPERATURE, K
295 220 170 140 125 115 105 98 90
Doublet 1 Doublet 2 Doublet 3
Doublet 4 Doublet 5
Journal Pre-proof
ferritin. However, while the FT of ferritin mostly contains discrete, point like maxima, indicating individual nanocrystalline domains (Fig. 13), the FT of Ferrifol® (Fig. 12b) is dominated by two broad and diffuse rings at 2.6 and 2.1 Å. This implies that the average structure of Ferrifol® iron cores is less ordered and/or their average domain size is smaller than those of ferritin. The rings on the FT of Ferrifol® are consistent with ferrihydrite.
Fig. 12. High resolution transmission electron microscopy image of Ferrifol®: 5050 nm area (a), its Fourier transform demonstrating the diffuse rings due to the poorly ordered structure and/or the small average domain size (b) and enlarged area marked by white box in (a) with indicated lattice spacings of individual iron cores (c).
Fig. 13. High resolution transmission electron microscopy image of ferritin (a) and the corresponding Fourier transform of 5050 nm area (b). The scale is the same as in Fig. 12. Some iron cores are enlarged in the insert.
Journal Pre-proof
To get a closer view of the ordering state of individual Ferrifol® iron cores, detailed HRTEM analysis was carried out (Fig. 14). Based on HRTEM, three types of lattice images could be distinguished. (1) In the most cases the actual orientation of crystalline nanosized iron cores allows the imaging of lattice periodicity in only one direction (e.g. Fig. 14a–c). This periodicity varies between 2.2 and 2.8 Å, which can be identified as the distance of Fe-O(H) layers in ferrihydrite structure. The variation of this distance indicates heterogeneity of the iron cores, probably related to the disordered structure. (2) In some cases, lattice fringes could be measured in two directions, which allow identification of crystal structure and orientation (e.g. Fig. 14d). (3) The third group comprises partially or fully disordered iron cores (Fig. 14e–i). These iron cores are either amorphous (e.g. Fig. 14h and i) being sometimes closely attached to nanocrystalline domains (Fig.
14e) or exhibit a complex nanostructure with more and less ordered parts (Fig. 14f and g). As these particles are extremely small (20–30 Å in size, which are around 5–10 unit cells), it is difficult and maybe useless to interpret these variations in terms of crystal lattice. However, it can be stated that the Ferrifol® iron cores represent heterogeneous structures of different ordering states, which can be interpreted as sets of Fe-O(OH) layers without long range correlation. The nanoscale heterogeneity, the small domain size and the low overall degree of ordering might be related to an uneven distribution of iron atoms between O(OH) layers. Variation of oxidation state also cannot be excluded. Thus, HRTEM supports a complex heterogeneous iron core structure with different interlayer distances and distribution of iron atoms, as well as possible presence of tiny amount of iron oxides other than ferrihydrite or akaganéite in Ferrifol®, a pharmaceutical analogue of ferritin.
Conclusion
Pharmaceutical iron(III)-polymaltose complex Ferrifol® used for treatment of iron deficiency anemia was studied by means of transmission electron microscopy, X-ray diffraction, thermogravimetry, dc magnetization measurements, electron magnetic resonance and 57Fe Mössbauer spectroscopy in a wide temperature range and compared with similar results for ferritin and two other iron(III)-polymaltose complexes Ferrum Lek and Maltofer®.
HRTEM of Ferrifol® revealed small domains of 2–6 nm without long range correlation and an uneven distribution of iron atoms in the interstitial sites of close-packed O(OH) layers was deduced. ZFC and FC magnetization measurements indicate anti-ferromagnetic behavior up to the blocking temperature of 33 K. At higher temperatures, the material seems to be paramagnetic. EMR spectra displayed components that could be associated with a tiny amount of magnetite, a paramagnetic species and ferrihydrite displaying a distribution in the uniaxial magnetic anisotropy field.
Journal Pre-proof
Fig. 14. Lattice images of individual Ferrifol® iron cores observed using high resolution transmission electron microscopy. Explanation is given in the text.
The Mössbauer spectra of Ferrifol® measured in the temperature range from 295 K to 90 K were fitted using the heterogeneous iron core model, which appeared to be suitable also for our previously ferritin and its pharmaceutical analogues studies. The obtained spectral components (five quadrupole doublets) were related to the more and less close-packed iron core regions/layers in the Ferrifol® iron cores according to the value of quadrupole splitting. Anomalous temperature dependencies of some Mössbauer parameters with temperature decreasing were observed in this temperature range for Ferrifol® while slowing down of the magnetic relaxation led to magnetically split component appearance in the Mössbauer spectra below 60 K only. These observed anomalies were associated with the low temperature structural rearrangements of the more and less close- packed FeOOH regions/layers in the iron cores. This rearrangement implies a decrease of the area
Journal Pre-proof
of less close-packed regions/layers which alteration into the more close-packed regions/layers leads to increase of the total area of the latter.
Acknowledgements
The authors wish to thank Prof. Ferenc Simon (Institute of Physics, Budapest University of Technology and Economics, Budapest, Hungary) for making available the applied spectrometer for recording the EMR spectra and Dr. A.V. Chukin (Institute of Physics and Technology, Ural Federal University, Ekaterinburg, Russian Federation) for XRD measurements. This work was supported by the Ministry of Science and Higher Education of the Russian Federation and Act 211 of the Government of the Russian Federation, contract № 02.A03.21.0006. V.K.K. was supported by the János Bolyai Postdoctoral Fellowship of the Hungarian Academy of Sciences and the ÚNKP-19-4 New National Excellence Program of the Ministry for Innovation and Technology. HRTEM facility at Centre for Energy Research was granted by the European Structural and Investment Funds, grant no. VEKOP-2.3.3-15-2016-00002. This work was in part supported by the Hungarian National Research, Development and Innovation Office – NKFIH (K115784, K115913 and K134770). This work was carried out within the Agreement of Cooperation between the Ural Federal University (Ekaterinburg) and the Eötvös Loránd University (Budapest).
References
1. P. Aisen, I. Listowsky, Iron transport and storage proteins. Annu. Rev. Biochem. 49 (1980) 357–393.
2. E.C. Theil, Ferritin: structure, gene regulation, and cellular function in animals, plants, and microorganisms. Annu. Rev. Biochem., 56 (1987) 289–315.
3. P.M. Proulx-Curry, N.D. Chasteen, Molecular aspects of iron uptake and storage in ferritin.
Coord. Chem. Rev., 144 (1995) 347–368.
4. N.D. Chasteen, P.M. Harrison, Mineralization in ferritin: an efficient means of iron storage.
J. Struct. Biol., 126 (1999) 182–194.
5. K.J. Hintze, E.C. Theil, Cellular regulation and molecular interactions of the ferritins. Cell.
Mol. Life Sci., 63 (2006) 591–600.
6. P. Arosio, R. Ingrassia, P. Cavadini, Ferritins: a family of molecules for iron storage, antioxidation and more. Biochim. Biophys. Acta, 1790 (2009) 589–599.
7. R.R. Crichton, J.-P. Declercq, X-ray structures of ferritins and related proteins. Biochim.
Biophys. Acta, 1800 (2010) 706–718.
Journal Pre-proof
8. E.C. Theil, R.K. Behera, T. Tosha, Ferritins for chemistry and for life. Coord. Chem. Rev., 257 (2013) 579–586.
9. G.J. Handelman, N.W. Levin, Iron and anemia in human biology: a review of mechanisms.
Heart Fail Rev., 13 (2008) 393–404.
10. R. Crichton, Iron Metabolism – From Molecular Mechanisms to Clinical Consequences.
Forth Edition. John Wiley & Sons, Ltd., 2016, 556 pp.
11. J.E. Toblli, R. Brignoli, Iron(III)-hydroxide Polymaltose Complex in Iron Deficiency Anemia. Arzneimittel-Forschung (Drug Research), 57 (2007) 431–438.
12. W.H. Massover, Ultrastructure of ferritin and apoferritin: a review. Micron, 24 (1993) 389–437.
13. J.M. Cowley, D.E. Janney, R.C. Gerkin, P.R. Buseck, The structure of ferritin cores determined by electron nanodiffraction. J. Struct. Biol., 131 (2000) 210–216.
14. J.M. Cowley, Applications of electron nanodiffraction. Micron, 35 (2004) 345–360.
15. C. Quintana, J.M. Cowley, C. Marhic, Electron nanodiffraction and high-resolution electron microscopy studies of the structure and composition of physiological and pathological ferritin. J. Struct. Biol., 147 (2004) 166–178.
16. M.-S. Joo, G. Tourillon, D.E. Sayers, E.C. Theil, Rapid reduction of iron in horse spleen ferritin by thioglycolic acid measured by dispersive X-ray absorption spectroscopy. Biol. Met., 3 (1990) 171–175.
17. N. Galvez, B. Fernandez, P. Sanchez, R. Cuesta, M. Ceolin, M. Clemente-Leon, S.
Trasobares, M. Lopez-Haro, J.J. Calvino, O. Stephan, J.M. Dominguez-Vera, Comparative structural and chemical studies of ferritin cores with gradual removal of their iron contents. J. Am.
Chem. Soc., 130 (2008) 8062–8068.
18. Y.-H. Pan, K. Sader, J.J. Powell, A. Bleloch, M. Gass, J. Trinick, A. Warley, A. Li, R.
Brydson, A. Brown, 3D morphology of the human hepatic ferritin mineral core: new evidence for a subunit structure revealed by single particle analysis of HAADF-STEM images. J. Struct. Biol., 166 (2009) 22–31.
19. J.D. Lopez-Castro, J.J. Delgado, J.A. Perez-Omil, N. Galvez, R. Cuesta, R.K. Watt, J.M.
Domınguez-Vera, A new approach to the ferritin iron core growth: influence of the H/L ratio on the core shape. Dalton Trans., 41 (2012) 1320–1324.
20. R.A. Brooks, J. Vymazal, R.B. Goldfarb, J.W. Bulte, P. Aisen, Relaxometry and magnetometry of ferritin. Mag. Res. Med., 40 (1998) 227–235.
21. S.H. Kilcoyne, A. Gorisek, Magnetic properties of iron dextran. J. Mag. Mag. Mater., 177–181 (1998) 1457–1458.
22. F.J. Lázaro, A. Larrea, A.R. Abadía, Magnetostructural study of iron–dextran. J. Mag.
Journal Pre-proof
Mag. Mater., 257 (2003) 346–354.
23. J.H. Jung, T.W. Eom, Y.P. Lee, J.Y. Rhee, E.H. Choi, Magnetic model for a horse-spleen ferritin with a three-phase core structure. J. Mag. Mag. Mater., 323 (2011) 3077–3080.
24. K.A. Berg, L.H. Bowen, S.W. Hedges, R.D. Bereman, C.T. Vance, Identification of ferrihydrite in polysaccharide iron complex by Mössbauer spectroscopy and X-ray diffraction. J.
Inorg. Biochem., 22 (1984) 125–135.
25. T.G. St. Pierre, S.H. Bell, D.P.E. Dickson, S. Mann, J. Webb, G.R. Moore, R.J.P.
Williams, Mössbauer spectroscopic studies of the cores of human, limpet and bacterial ferritins.
Biochim. Biophys. Acta., 870 (1986) 127–134.
26. R.B. Frankel, G.C. Papaefthymiou, G.D. Watt, Variation of superparamagnetic properties with iron loading in mammalian ferritin. Hyperfine Interact., 66, (1991) 71–82.
27. E.R. Bauminger, P.M. Harrison, D. Hechel, I. Nowik, A. Treffry, How does the ferritin core form? Hyperfine Interact., 91 (1994) 835–839.
28. E.M. Coe, L.H. Bowen, R.D. Bereman, J.A. Speer, W.T. Monte, L. Scaggs, A study of an iron dextran complex by Mössbauer spectroscopy and X-ray diffraction. J. Inorg. Biochem., 57 (1995) 63–71.
29. F. Funk, G.J. Long, D. Hautot, R. Büchi, I. Christl, P.G. Weidler, Physical and chemical characterization of therapeutic iron containing materials: a study of several superparamagnetic drug formulations with the β-FeOOH or ferrihydrite structure. Hyperfine Interact., 136 (2001) 73–95.
30. G.C. Papaefthymiou, The Mössbauer and magnetic properties of ferritin cores. Biochim.
Biophys. Acta, 1800 (2010) 886–897.
31. A.A. Kamnev, K. Kovács, I.V. Alenkina, M.I. Oshtrakh, Mössbauer spectroscopy in biological and biomedical research. In: V.K. Sharma, G. Klingelhofer, T. Nishida, editors, Mössbauer Spectroscopy: Applications in Chemistry, Biology and Nanotechnology. First Edition, John Wiley & Sons, Inc., 2013; p. 272–291.
32. A.A. Kamnev, A.V. Tugarova, Sample treatment in Mössbauer spectroscopy for protein- related analyses: Nondestructive possibilities to look inside metal-containing biosystems. Talanta, 174 (2017) 819–837.
33. M.I. Oshtrakh, E.A. Kopelyan, V.A. Semionkin, A.B. Livshits, V.E. Krylova, T.M.
Prostakova, A.A. Kozlov, An analysis of iron–dextran complexes by Mössbauer spectroscopy and positron annihilation technique. J. Inorg. Biochem., 54 (1994) 285–295.
34. M.I. Oshtrakh, V.A. Semionkin, P.G. Prokopenko, O.B. Milder, A.B. Livshits, A.A.
Kozlov, Hyperfine interactions in the iron cores from various pharmaceutically important iron–
dextran complexes and human ferritin: a comparative study by Mössbauer spectroscopy. Int. J. Biol.
Macromol., 29 (2001) 303–314.
Journal Pre-proof
35. M.I. Oshtrakh, O.B. Milder, V.A. Semionkin, P.G. Prokopenko, A.B. Livshits, A.A.
Kozlov, A.I. Pikulev, An analysis of quadrupole splitting of the Mössbauer spectra of ferritin and iron–dextran complexes in relation to the iron core microstructural variations. Z. Naturforsch., 57a, (2002) 566–574.
36. M.I. Oshtrakh, O.B. Milder, V.A. Semionkin, Mössbauer spectroscopy with high velocity resolution in the study of ferritin and Imferon: preliminary results. Hyperfine Interact., 185 (2008) 39–46.
37. M.I. Oshtrakh, I.V. Alenkina, S.M. Dubiel, V.A. Semionkin, Structural variations of the iron cores in human liver ferritin and its pharmaceutically important models: a comparative study using Mössbauer spectroscopy with a high velocity resolution. J. Mol. Struct., 993 (2011) 287–291.
38. I.V. Alenkina, M.I. Oshtrakh, Yu.V. Klepova, S.M. Dubiel, N.V. Sadovnikov, V.A.
Semionkin, Comparative study of the iron cores in human liver ferritin, its pharmaceutical models and ferritin in chicken liver and spleen tissues using Mössbauer spectroscopy with a high velocity resolution. Spectrochim. Acta, Part A: Molec. and Biomolec. Spectroscopy, 100 (2013) 88–93.
39. M.I. Oshtrakh, I.V. Alenkina, E. Kuzmann, Z. Klencsár, V.A. Semionkin, Anomalous Mössbauer Line Broadening for Nanosized Hydrous Ferric Oxide Cores in Ferritin and its Pharmaceutical Analogue Ferrum Lek in the Temperature Range 295–90 K, J. Nanopart. Res., 16 (2014) 2363.
40. I.V. Alenkina, M.I. Oshtrakh, Z. Klencsár, E. Kuzmann, A.V. Chukin, V.A. Semionkin,
57Fe Mössbauer spectroscopy and electron paramagnetic resonance studies of human liver ferritin, Ferrum Lek and Maltofer®. Spectrochim. Acta, Part A: Molec. and Biomolec. Spectroscopy, 130 (2014) 24–36.
41. M.I. Oshtrakh, I.V. Alenkina, V.A. Semionkin, The 57Fe hyperfine interactions in human liver ferritin and its iron-polymaltose analogues: the heterogeneous iron core model, Hyperfine Interact., 237 (2016) 145.
42. M.I. Oshtrakh, I.V. Alenkina, Z. Klencsár, E. Kuzmann, V.A. Semionkin, Different 57Fe microenvironments in the nanosized iron cores in human liver ferritin and its pharmaceutical analogues on the basis of temperature dependent Mössbauer spectroscopy. Spectrochim. Acta, Part A: Molec. and Biomolec. Spectroscopy, 172 (2017) 14–24.
43. I.V.Alenkina, I.Felner, E.Kuzmann, M.I.Oshtrakh, Characterization of the iron core in Ferrifol®, a pharmaceutical analogue of ferritin, using Mössbauer spectroscopy and magnetization measurements. J. Mol. Struct., 1183 (2019) 281–286.
44. Z. Klencsár, E. Kuzmann, A. Vértes, User-friendly software for Mössbauer spectrum analysis. J. Radioanal. Nucl. Chem., 210 (1996) 105–118.
45. M.I. Oshtrakh, V.A. Semionkin, Mössbauer spectroscopy with a high velocity resolution:
Journal Pre-proof
advances in biomedical, pharmaceutical, cosmochemical and nanotechnological research.
Spectrochim. Acta A Mol. Biomol. Spectrosc., 100 (2013) 78–87.
46. M.I. Oshtrakh, V.A. Semionkin, Mössbauer Spectroscopy with a High Velocity Resolution: Principles and Applications. In: Proceedings of the International Conference
“Mössbauer Spectroscopy in Materials Science 2016”, Eds. J. Tuček, M. Miglierini, AIP Conference Proceedings. AIP Publishing, Melville, New York, 2016, 1781, 020019.
47. M. Koralewski, M. Pochylski, J. Gierszewski, Magnetic properties of ferritin and akaganéite nanoparticles in aqueous suspension. J. Nanopart. Res., 15 (2013) 1902.
48. L.R. Bickford, Jr., Ferromagnetic Resonance Absorption in Magnetite Single Crystals.
Phys. Rev., 78 (1950) 449–457.
49. V.K. Sharma, F. Waldner, Superparamagnetic and ferrimagnetic resonance of ultrafine Fe3O4 particles in ferrofluids. J. Appl. Phys., 48 (1977) 4298–4302.
50. R. Aragón, Cubic magnetic anisotropy of nonstoichiometric magnetite. Phys. Rev. B, 46 (1992) 5334–5338.
51. B. Singh, M. Gräfe, N. Kaur, A. Liese, Applications of Synchrotron-Based X-Ray Diffraction and X-Ray Absorption Spectroscopy to the Understanding of Poorly Crystalline and Metal-Substituted Iron Oxides. Developments in Soil Sci., 34 (2010) 199–254.
52. M.P. Weir, T.J. Peters, J.F. Gibson, Electron spin resonance studies of splenic ferritin and haemosiderin. Biochim. Biophys. Acta, 828 (1985) 298–305.
53. S.M. Heald, E.A. Stern, B. Bunker, E.M. Holt, S.L. Holt, Structure of the iron-containing core in ferritin by the extended X-ray absorption fine structure technique. J. Am. Chem. Soc., 101 (1979) 67–73.
Journal Pre-proof
CONFLICT OF INTEREST
The authors have no conflict of interest.
Journal Pre-proof
GRAPHICAL ABSTRACT
The Mössbauer spectra of pharmaceutical ferritin analogue Ferrifol® (T=295–90 K) were fitted using five quadrupole doublets. The blocking temperature for the largest iron cores is 33 K. High resolution transmission electron microscopy shows the lattice periodicity in the Ferrifol® iron cores in the range 2.2–2.7 Å.
T=170 K
Ferrifol® Ferrifol®
Ferrifol®
Journal Pre-proof
HIGHLIGHTS
Ferrifol® is an iron(III)-polymaltose pharmaceutical ferritin analogue
Magnetization measurements of Ferrifol® demonstrate a blocking temperature at ~33 K
The lattice periodicity in the Ferrifol® iron cores varies in the range 2.2–2.7 Å