Research Article
Olaparib: A Clinically Applied PARP Inhibitor Protects from Experimental Crohn ’ s Disease and Maintains Barrier Integrity by Improving Bioenergetics through Rescuing Glycolysis in Colonic Epithelial Cells
Dominika Kovács ,1 Viola Bagóné Vántus ,1Eszter Vámos ,1Nikoletta Kálmán ,1 Rudolf Schicho ,2,3Ferenc Gallyas ,1,4,5and Balázs Radnai 1
1Department of Biochemistry and Medical Chemistry, Medical School, University of Pécs, 7624 Pécs, Hungary
2Division of Pharmacology, Otto Loewi Research Center, Medical University of Graz, Universitätsplatz 4, 8010 Graz, Austria
3BioTechMed, 8010 Graz, Austria
4Szentagothai Research Centre, University of Pecs, 7624 Pecs, Hungary
5HAS-UP Nuclear-Mitochondrial Interactions Research Group, 1245 Budapest, Hungary
Correspondence should be addressed to Balázs Radnai; balazs.radnai@aok.pte.hu Received 18 April 2021; Accepted 24 August 2021; Published 15 September 2021
Academic Editor: Mariaurea Matias Sarandy
Copyright © 2021 Dominika Kovács et al. This is an open access article distributed under the Creative Commons Attribution License, which permits unrestricted use, distribution, and reproduction in any medium, provided the original work is properly cited.
Crohn’s disease (CD) is an inflammatory disorder of the intestines characterized by epithelial barrier dysfunction and mucosal damage. The activity of poly(ADP-ribose) polymerase-1 (PARP-1) is deeply involved in the pathomechanism of inflammation since it leads to energy depletion and mitochondrial failure in cells. Focusing on the epithelial barrier integrity and bioenergetics of epithelial cells, we investigated whether the clinically applied PARP inhibitor olaparib might improve experimental CD. We used the oral PARP inhibitor olaparib in the 2,4,6-trinitrobenzene sulfonic acid- (TNBS-) induced mouse colitis model.
Inflammatory scoring, cytokine levels, colon histology, hematological analysis, and intestinal permeability were studied. Caco-2 monolayer culture was utilized as an epithelial barrier model, on which we used qPCR and light microscopy imaging, and measured impedance-based barrier integrity, FITC-dextran permeability, apoptosis, mitochondrial oxygen consumption rate, and extracellular acidification rate. Olaparib reduced the inflammation score, the concentration of IL-1βand IL-6, enhanced the level of IL-10, and decreased the intestinal permeability in TNBS-colitis. Blood cell ratios, such as lymphocyte to monocyte ratio, platelet to lymphocyte ratio, and neutrophil to lymphocyte ratio were improved. In H2O2-treated Caco-2 monolayer, olaparib decreased morphological changes, barrier permeability, and preserved barrier integrity. In oxidative stress, olaparib enhanced glycolysis (extracellular acidification rate), and it improved mitochondrial function (mitochondrial coupling efficiency, maximal respiration, and spare respiratory capacity) in epithelial cells. Olaparib, a PARP inhibitor used in human cancer therapy, improved experimental CD and protected intestinal barrier integrity by preventing its energetic collapse; therefore, it could be repurposed for the therapy of Crohn’s disease.
1. Introduction
Inflammatory bowel disease (IBD) is a chronic and remitting inflammatory disease of the gut. More than 1 million inhab- itants in the USA and approximately 2.5 million in Europe suffer from IBD, and its incidence is permanently rising [1].
IBD exhibits two main forms, namely, ulcerative colitis (UC) and Crohn’s disease (CD), and it appears in flare-up and remission phases [2]. Although UC and CD are two dis- tinct forms of IBD, they share the phenomenon of epithelial barrier dysfunction. Barrier failure often results in increased intestinal permeability, a condition called“leaky gut”[3]. In
Volume 2021, Article ID 7308897, 17 pages https://doi.org/10.1155/2021/7308897
this disorder, the gut microbiota can directly enter the colonic tissue and induce the activation of immune cells causing chronic inflammation [4, 5]. The initiators of increased gut permeability are not clearly elucidated, but it is often suggested that increased permeability is a conse- quence of altered energy metabolism and mitochondrial dys- function of intestinal epithelial cells (IEC) [6]. For example, investigations with conplastic mouse strains, which share the same nuclear genome but have different mitochondrial genomes, demonstrated that those mice with high mucosal respiratory chain activity and elevated concentration of ATP develop less intense colitis than those that produce a smaller amount of mucosal ATP [7]. In CD patients, increased mucosal permeability in the ileum was accompa- nied by mitochondrial swelling and decreased ATP concen- tration [8]. In addition, the activity of complex II (CII), a part of the mitochondrial electron transport chain (ETC), was found to be abolished in the colon of UC patients [9].
Another group found lower levels of CI and CIV in IBD patients compared to control subjects and also measured lower ATP concentrations [10]. Furthermore, enhanced lac- tate levels were found in CD patients in comparison with healthy individuals, which correlated with the disease activity [11]. All these results suggest mitochondrial dysfunction, dis- turbed oxidative phosphorylation, and enhanced glycolytic activity in the mucosa of IBD patients.
Under physiological conditions, IECs use butyrate as a primary energy source [12]. Butyrate is produced by several species of the microbiota, and it is catabolized in IECs viaβ- oxidation and citric acid cycle (CAC) [13–15]. In addition, dehydrogenases of these catabolic pathways reduce NAD+ and FAD to NADH+H+ and FADH2 which promote the reduction of the mitochondrial respiratory chain CI and CII [16]. Thereafter, CI, CIII, and CIV pump protons across the inner membrane from the matrix to the intermembrane space raising a proton gradient [16]. At the end of ETC, CIV consumes O2and reduces it to H2O. Finally, the proton gra- dient drives FOF1-ATPase, which produces ATP from ADP and Pi[16].
However, in inflammation, mitochondrial dysfunction and mitochondria-derived ROS increase. Under these cir- cumstances, IECs switch their metabolism from oxidative phosphorylation (OXPHOS) to aerobic glycolysis [13, 17].
In aerobic glycolysis, glucose transforms to lactate without oxygen consumption, although sufficient amount of oxygen is present in the cells [18]. In this situation, glycolysis pro- duces ATP and, as a by-product, lactate is synthesized from pyruvate by lactate dehydrogenase [17]. Since the mitochon- dria are a major source of ROS [19], the catabolic pathway via glycolysis and lactate dehydrogenase bypasses the mito- chondria and do not feed mitochondrial ROS generation [20]. Thus, the cell shuts down the mitochondria to protect itself from mitochondrial ROS [21]. This concept is strengthened by the findings that proinflammatory cyto- kines (TNF-α, IL-1β, and IFN-γ) increased the rate of gly- colysis in rat enterocytes and also triggered ATP turnover [22]. Also C. rodentiuminfection in mice induced aerobic glycolysis and enhanced the level of sodium-glucose trans- porter 4 and lactate dehydrogenase A. At the same time,
enzymes of CAC and OXPHOS were downregulated [23].
Most importantly, a strong expression of glycolytic enzymes was found in the colon of IBD patients [24]. In active CD, lactate levels were significantly higher compared to the con- trol subjects [11]. Therefore, in colitis, aerobic glycolysis becomes the main source of ATP. Nevertheless, in severe inflammation, activation of the enzyme poly(ADP-ribose)- polymerase-1 (PARP-1) blocks glycolysis [25], i.e., it termi- nates the “last safe way” of energy production and forces the cells along the death pathway causing strong mucosal damage with severe ulceration and compromised barrier function.
PARP-1 has been long involved in cancer development and inflammation. Accordingly, PARP-1-/- mice were pro- tected in 2,4,6-trinitrobenzene sulphonic acid- (TNBS-) induced colitis [26] and pharmacological inhibitors of PARP-1 improved dextran sodium sulfate-induced [27]
and TNBS-induced colitis [28] in rodents. PARP-1 is acti- vated by DNA damage and catalyzes polyADP-ribosylation (PARylation) of numerous nuclear proteins using NAD+as a substrate [29]. This process is a part of the DNA damage response leading to activation of the DNA repair enzymes [30]. However, excessive PARP activation can totally deplete NAD+ pools, which makes cellular energy metabolism impossible [31]. Several lines of evidence demonstrate that PARP activation not only depletes NAD+ pools but also inhibits the enzyme hexokinase, which catalyzes thefirst step of glycolysis [25]. As a result, repressed glycolysis cannot feed CAC with Acetyl-CoA (produced by pyruvate dehydro- genase from the glycolytic end-product pyruvate), and CAC is not able to reduce NAD+and FAD to feed mitochondrial ETC and OXPHOS [32], so PARP-induced mitochondrial dysfunction originates, at least partially, from the decreased substrateflow from glycolysis to CAC and ETC [25]. Since, in severe colitis, glycolysis is the main source of ATP (because of mitochondrial shutdown) [21] and also glycoly- sis is inhibited by PARP [25], IECs have to face with ener- getic collapse and they lose the ability to form a strong and continuous barrier [7].
In the present study, we investigated whether olaparib, a PARP inhibitor used in human cancer therapy, has a benefi- cial effect in a CD mouse model and, accordingly, whether it could be repurposed for CD treatment. To answer this ques- tion, we applied olaparib during a TNBS-induced experi- mental colitis model. Additionally, since IECs are the first line of defence in the colon and barrier interruption is a hall- mark of IBD, we used Caco-2 colonic epithelial cells and investigated barrier function and energy productionin vitro.
2. Materials and Methods
2.1. Animals and Experimental Colitis. Male CD1 mice (Jackson Laboratory, Bar Harbor, ME, USA) were bred and maintained at the SPF animal facility of the Department of Immunology and Biotechnology, Medical School, University of Pécs. At the age of 6-8 weeks, they were transported to our animal house facility and acclimatized for 2 weeks under standardized circumstances. Standard laboratory chow and water were available ad libitum. Experimental procedures
were approved by the Animal Research Review Committee of the University of Pécs, Medical School (Permit number:
BA02/2000-4/2017). For the colitis experiments, we used the vehicle (VEH), TNBS, and TNBS+olaparib (TNBS+olap) treatment groups. In total, 72 animals were used; 1 mouse died during the experiments before evaluation. In our exper- imental setting, every group contained 3-9 animals. We per- formed 3 independent experiments including in total 9 VEH, 26 TNBS, 9 TNBS+20 mg olaparib, and 27 TNBS +50 mg olaparib). The age-matched (8-10 weeks), sex- matched (male), and bodyweight-matched (30-40 g) animals were randomly divided into groups by a technician. During the experiments, mice were individually housed to avoid aggressive behavior. Individual housing was approved by the Animal Research Review Committee of the University of Pécs. The experimental period lasted in total for 4 days (Figure 1(a)). On day 1, olaparib treatment started (pretreat- ment), and thereafter, we administered it daily once for 3 times (thus, in total, we performed 4 olaparib treatments).
On day 0, animals were treated with TNBS (1 bolus), and on day 3, mice were anesthetized and euthanized. Olaparib (AZD2281, MedChemExpress, New Jersey, USA) was administered intraperitoneally (single injection) on the day before TNBS challenge, followed by daily administration for 3 days at the dose of 20 or 50 mg/kg bodyweight. The applied dose of olaparib was selected based on literature data [33]. The vehicle group received sterile distilled water con- taining 4% DMSO and 30% PEG300. After 12 hrs fasting, mice were anesthetized with 5% isoflurane (Baxter Hungary Ltd., Budapest, Hungary) in 100% oxygen in an anaesthetic chamber. Colitis was induced by a single intracolonic injec- tion of TNBS (4 mg in 100μl of 30% ethanol; Sigma-Aldrich, Missouri, USA) through a catheter inserted 3 cm into the colon. The VEH group received an equal volume of 30% eth- anol. Animals were weighed daily during the experiment and sacrificed 72 hrs after TNBS administration. Mice were anesthetized with 5% isoflurane and decapitated gently by a dedicated surgical scissor to collect the highest possible amounts of trunk blood. This technique was approved by the Animal Research Review Committee of the University of Pécs. Trunk blood was collected; the colons were removed, measured, weighted, and opened longitudinally to detect the macroscopic colon damage. Tissue samples were processed for further analyses. Treatments and macro- scopical scoring were carried out blind.
2.2. Intestinal Permeability Measurement.Intestinal perme- ability was determined by measuring the concentration of fluorescein isothiocyanate (FITC)-dextran (40 kDa; Sigma- Aldrich Missouri, USA) in serum. 3 days after TNBS treat- ment, FITC-dextran solution (100μl of a 60 mg/ml solution) was administered intrarectally. Serum was collected 1 hour after the administration, and fluorescence intensities were detected by a Promega GloMax plate reader (excitation, 490 nm; emission, 510–570 nm). A standard curve was gen- erated from a serial dilution of FITC-dextran in PBS.
2.3. Hematological Analysis. At the endpoint of the TNBS model, mice were anesthetized with 5% isoflurane and
decapitated gently by a dedicated surgical scissor, and trunk blood was collected directly into microtainer tubes (Becton Dickinson, Hungary) containing EDTA as an anticoagulant.
Hematological parameters were determined by a Sysmex XN-1000-V Multispecies Hematology Analyzer (Sysmex America Inc., USA) within 2 hours of sampling. Lymphocyte to monocyte ratio (LMR), platelet to lymphocyte ratio (PLR), neutrophil to lymphocyte ratio (NLR), and neutro- phil to monocyte ratio (NMR) were calculated from the absolute cell counts for each animal separately.
2.4. Macroscopic Scoring. Colonic tissue damage score was assessed by a macroscopic scoring system described previ- ously [34]. Briefly, individual points were added for ulcers (0.5 points for each 0.5 cm), adhesions (0 points = absent, 1 point = 1 adhesion, and 2 points = 2 or more adhesions or adhesions to organs), colon shortening, based on a mean length of a healthy colon (1 point =>15%, 2 points =>25%), wall thickness (measured in mm), consistency of the stool, and the presence of blood in the stool (hemorrhage, fecal blood, or diarrhea increase the total points by 1).
2.5. Histology of Colon Tissue. Segments of the distal colon were stapled flat onto a cardboard with the mucosal side up andfixed for at least 24 hrs in 10% neutral-buffered for- malin. Tissue was then dehydrated and embedded in paraf- fin, and standard hematoxylin staining was performed on 5μm thick sections. To this end, slides were deparaffinized, cleared in xylol, rehydrated in a descending ethanol series, stained with hematoxylin solution according to Gill II, and cleared in tap water. Images were taken with an Olympus DP50 camera and processed with cellSens imaging software (Olympus, Vienna, Austria).
2.6. Cytokine Levels of Colon Tissue. Levels of inflammatory cytokines IL-1β, IL-6, TNF-α, and IL-10 were measured in colon tissues. Tissue was homogenized mechanically in an extraction buffer supplemented with protease inhibitor cocktail (Sigma-Aldrich, Missouri, USA). Bradford assay (Bio-Rad Laboratories, California, USA) was used to mea- sure the concentration of total protein. Subsequently, nor- malization of protein concentrations was performed and cytokine levels were determined by Ready-Set-Go ELISA kits (eBioscience, California, USA) according to the manufac- turer’s instructions.
2.7. Epithelial Cell Culture.The Caco-2 human colon carci- noma epithelial cell line was purchased from the American Type Culture Collection (ATCC, Virginia, USA) and cul- tured in Eagle’s minimum essential medium (Biosera, France) supplemented with 20% fetal bovine serum (Corn- ing, New York, USA) and 1% nonessential amino acid solu- tion (Sigma-Aldrich, Missouri, USA). Cells were maintained in a humidified incubator containing 5% CO2at 37°C.
2.8. RNA Isolation and qPCR.Total RNA was extracted from the Caco-2 monolayer using NucleoSpin RNA Plus kit (Macherey-Nagel, Germany) according to the manufac- turer’s protocol. It was quantified using a Nanodrop spectro- photometer and Qubit 2.0 fluorometer (Thermo Fisher
Evaluation TNBS administration
(4 mg/animal; ir)
Days –1 0 1 2 3
Olaparib administration (50 or 20 mg/kg; ip)
(a)
0
VEH 80
90 100
Weight change (%)
110
1 2
Time (day)
3 4
TNBS
TNBS+olap (50) ns ns
TNBS+olap (20) (b)
TNBS+VEH TNBS+olap (50)
(c)
0 VEH TNBS TNBS+
olap (20) ns
TNBS+
olap (50) 2
4 6 8 10 12 14
Macroscopic score ⁎
⁎⁎
(d)
TNBS+
olap (50)
0 VEH TNBS
1 2 3
Ulcer number ⁎⁎⁎
(e)
TNBS+
olap (50)
0 VEH TNBS
5 10 20
Ulcer length (mm)
15
⁎
(f) Figure1: Continued.
Scientific, USA). 1μg of total RNA was reverse-transcribed with M-MuLV RT (Maxima First-Strand cDNA Synthesis Kit, Thermo Fisher Scientific, USA). 100 ng cDNA was used in 20μl reactions for real-time PCR using the Xceed qPCR SG 2× Mix (Institute of Applied Biotechnologies, Praha- Strašnice, Czech Republic) and a CFX96 Touch Real-Time PCR Detection System (Bio-Rad, USA). After 40 cycles of PCR reaction, products were run on a 1.5% agarose gel using 20 bp DNA Ladder (Lonza, Basel, Switzerland). Data were analyzed byΔCt method. As a reference for gene expression, we used β-actin expression. Primers for the investigated gene expression were as follows: (i)β-actin (121 bp): forward 5′-GCATGGGTCAGAAGGATTCC-3′, reverse 5′-CAGA TTTTCTCCATGTCGTCCC-3′; (ii) PARP-1 (109 bp): for- ward 5′-CGAGTCGAGTACGCCAAGAG-3′, reverse 5′- CATCAAACATGGGCGACTGC-3′; (iii) PARP-2 (97 bp):
forward 5′-GCCAGCAAAAGGGTCTCTGA-3′, reverse 5′
-CATGAGCCTTCCCCACCTTG-3′; and (iv) PARP-3 (115 bp): forward 5′-CCTGAGGCTCATGGAGAGTTG-3′, reverse 5′-TGGAGCCATGGCCAAGAAAA-3′. The effi- ciency of the reactions was in all cases near 100%.
2.9. Impedance-Based Barrier Integrity Measurements.First, the epithelial barrier integrity was determined by measuring electrical impedance using xCELLigence RTCA DP Real- Time Cell Analyzer (ACEA Biosciences, California, USA).
Caco-2 cells were seeded on RTCA E-plates (E-plate 16) at a density of 105 cells/well. We applied the control (CTRL) and H2O2or H2O2+olaparib treatment groups. After attain- ing confluency, the monolayers were treated with different concentrations of H2O2 (100, 200, 500, and 1000μM) or with olaparib (10μM) as a pretreatment, 30 min before H2O2. The CTRL and H2O2treatment groups received the same amount of DMSO as the olaparib-treated cells. The cell index (CI) was continuously monitored by the equipment for 24 hours.
2.10. FITC-Dextran Epithelial Permeability Assay. Perme- ability was assessed by measuring theflux of FITC-dextran from the upper compartment to the lower compartment in Transwell plates (pore size 0.4μm; polyester membrane, Corning, New York, USA). Caco-2 cells were grown until full confluency in 12 well Transwell plates. Here, we applied the same treatment groups as described in the impedance- based technique. Cells were treated with 1000μM H2O2 or pretreated with 10μM olaparib for 30 minutes. After 24 hours, FITC-dextran solution (1 mg/ml) was added to the upper chamber. 1 hour later, a medium from the lower chamber was collected and thefluorescence intensities were detected by a Promega GloMax plate reader (Promega, USA) at 490- nm excitation and 510–570 nm emission wavelengths.
2.11. Determination of Apoptosis.Mouse Annexin V & Dead Cell Kit (Merck Millipore, Massachusetts, USA) was used for the quantitative analysis of live, early, and late apoptotic and necrotic cells. Caco-2 cells were seeded onto 6-well plates at a density of 106cells/well. Treatments and treatment groups were exactly the same as described above at the FITC- dextran assay. 24 hrs after treatment, cells were trypsinized and collected; sample preparation was performed as sug- gested by the manufacturer. Briefly, 100μL of cell suspen- sion was incubated with 100μl of Muse Annexin V &
Dead Cell reagent for 20 minutes, in the dark at room tem- perature. After staining, the assay was performed with a Muse Cell Analyzer (flow cytometer).
2.12. Seahorse XFp Cell Mito Stress Test.Measurement of the oxygen consumption rate (OCR) and extracellular acidifica- tion rate (ECAR) in Caco-2 monolayers was performed by a Seahorse XFp Extracellular Flux Analyzer (Agilent Technol- ogies, California, USA). The day before the assay, the Sea- horse XFp Sensor Cartridge was hydrated with XF Calibrant Solution and was kept at 37°C in a CO2-free incu- bator overnight. Caco-2 cells were seeded on XFp Miniplates
ns
TNBS+
olap (50)
0.0 VEH TNBS
0.1 0.2 0.4
FITC-dextran (𝜇
g/mL) 0.3
⁎ ⁎
(g)
Figure1: Olaparib treatment attenuated TNBS-induced colitis in mice. (a) Experimental protocol of TNBS-induced colitis and olaparib treatment. (b) Bodyweight changes (percentage of the initial bodyweight of each animal) in every experimental group. Data from one of three independent experiments are expressed asmean ± SEM(n= 4-7). (c) Representative images of hematoxylin staining of colon cross- sections from the TNBS- and TNBS+olap (50)-treated mice. Arrows indicate the most affected part of the colon tissue, the submucosa.
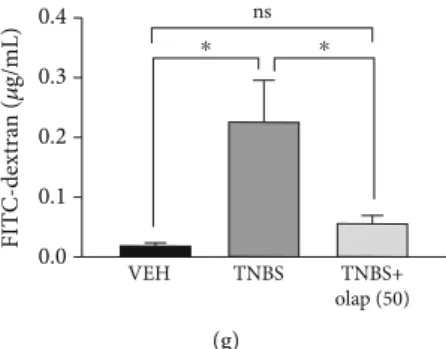
(d) Macroscopic score in every experimental group. Data combined from 2 separate experiments (n= 9-21). (e) Ulcer number and (f) ulcer length in the VEH, TNBS, and TNBS+olap (50) groups. Data combined from 3 separate experiments (n= 9-27). (g) Intestinal permeability based on the measurement of FITC-dextran in blood samples 3 days after TNBS treatment. Data from one of three independent experiments are expressed as mean ± SEM (n= 5-8); ns: not significant; ∗P< 0:05, ∗∗P< 0:01, and ∗∗∗P< 0:001. VEH:
vehicle; TNBS: 2,4,6-trinitrobenzene sulphonic acid; olap (50): 50 mg/kg olaparib; olap (20): 20 mg/kg olaparib.
at a density of1:5 × 10⁴cells/well. After reaching 100% con- fluence, cells were treated exactly as described at the FITC- dextran assay. After the treatment, a complete growth medium was replaced with an unbuffered, serum-free Agi- lent XF Base assay medium, pH 7.4. XFp Mito Stress Test Kit was used to test mitochondrial function. Injection of oli- gomycin, carbonyl cyanide-4 (trifluoromethoxy) phenylhy- drazone (FCCP), and the mix of rotenone and antimycin A allows determining the key bioenergetic parameters: basal respiration, ATP production-linked respiration (ATP pro- duction), maximal respiration, spare respiratory capacity, nonmitochondrial respiration, proton leak, and coupling efficiency. Oligomycin inhibits the FO subunit of the FOF1- ATP synthase, thereby indicating ATP-linked OCR, i.e., level of ATP synthesis. ATP-linked respiration is calculated by the difference between baseline OCR and OCR after oli- gomycin injection. Distracting nonmitochondrial respira- tion from the OCR after FCCP injection represents maximal respiration. FCCP is a mitochondrial uncoupler, which separates the activity of phosphorylation and oxida- tion. Under these circumstances, ETC might work with its maximum rate and consumes higher amounts of O2without developing membrane potential between the two sides of the mitochondrial inner membrane. Spare respiratory capacity is defined by the difference between maximal and basal res- piration. The mixture of rotenone and antimycin A inhibits CI and CIII, respectively; thus, mitochondrial ETC and O2 consumption are blocked. The final concentrations of the modulators were 1μM. OCR after rotenone/antimycin A injection represents nonmitochondrial respiration. ATP- linked respiration divided by basal respiration reveals cou- pling efficiency.
2.13. Light Microscopy Imaging.Caco-2 cells were seeded at a density of 106cells/well on 6-well plates. After reaching con- fluency, the monolayers were treated exactly as described at the FITC-dextran assay. 24 hours later, monolayers were visualized by EVOS XL Core Cell Imaging System (Thermo Fisher Scientific, USA) using a 20×objective.
2.14. Statistical Analysis. Experimental data were analyzed by using GraphPad Prism Software (GraphPad Software Inc., California, USA). Statistical difference between groups was established by Student’st-test, with Bonferroni correc- tion; P values less than 0.05 were considered statistically significant.
3. Results
3.1. Olaparib Improved TNBS-Colitis in Mice. To evaluate the effect of olaparib in experimental colitis, we used the TNBS-colitis model (Figure 1(a)), a mouse model of CD [35]. Olaparib was used as a pretreatment in 20 and 50 mg/kg bodyweight dose. On the one hand, olaparib failed to significantly ameliorate weight loss in TNBS-challenged animals (Figure 1(b)). But on the other hand, it decreased inflammation scores by more than ~50% in 50 mg/kg (n= 21), but not in 20 mg/kg dosage (n= 9) (Figure 1(d)).
Hence, we used 50 mg/kg dose in the further experiments.
Olaparib impeded histological injury in the colon (Figure 1(c)), reduced the number of ulcers (n= 27) (Figure 1(e)) and their lengths (n= 27) (Figure 1(f)), and most importantly, diminished FITC-dextran permeability (n= 8) (Figure 1(g)) compared to the CTRL group (n= 5).
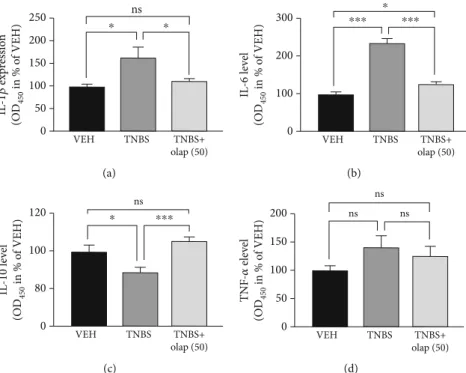
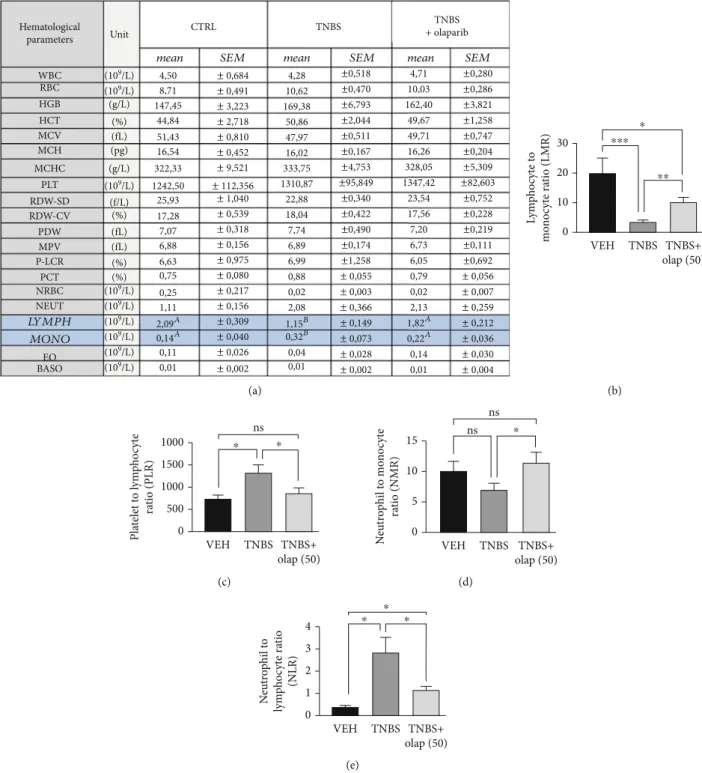
Levels of inflammatory cytokines were also modulated. Ola- parib diminished IL-1β(Figure 2(a)) and IL-6 (Figure 2(b)) proinflammatory cytokine levels, but enhanced anti- inflammatory IL-10 production (Figure 2(c)) in the colon (n= 13). Interestingly, we could notfind statistically signifi- cant alteration in the TNF-α level (Figure 2(a)). We also evaluated numerous hematological parameters in colitic mice (Figure 3(a)). We found only 2 parameters, namely, the amounts of lymphocytes and monocytes, which were sig- nificantly modulated by the treatments. In agreement with others’ findings on colitis models, TNBS substantially reduced lymphocyte number in mice (n= 9), while olaparib counteracted this effect (n= 20). In contrast, monocyte number was higher in the TNBS group (n= 9), whereas it was significantly less elevated in the TNBS+olaparib group (Figure 3(a)) (n= 20). We calculated specific blood cell ratios, which were previously shown to be changed in CD [36] based upon the individual blood cell counts. Similarly to CD, neutrophil to lymphocyte ratio (NLR) (Figure 3(e)) and platelet to lymphocyte ratio (PLR) (Figure 3(c)) were both increased in TNBS-colitis and they were markedly reduced by olaparib treatment. Again, as in CD, lymphocyte to monocyte ratio (LMR) (Figure 3(b)) was reduced in experimental colitis, and it was amended by the PARP inhib- itor. Unfortunately, TNBS-induced changes in the neutro- phil to monocyte ratio (NMR) (Figure 3(d)) did not reach statistical significance compared to the vehicle. However, olaparib improved NMR related to the TNBS-treated group.
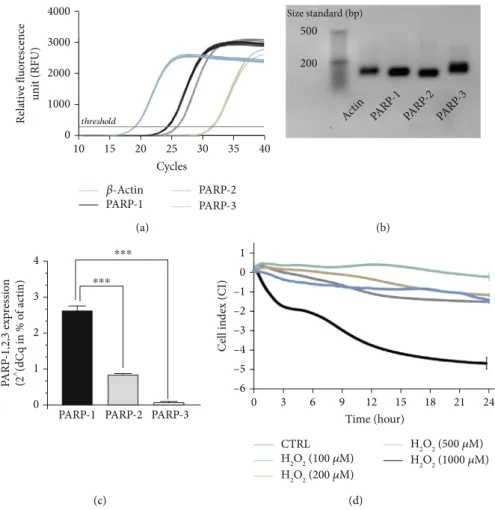
3.2. Caco-2 Colonic Epithelial Cells Expressed PARP-1, PARP-2 and PARP-3. Olaparib has been shown to inhibit three members of the PARP enzyme family, namely, PARP-1 (IC50= 5nM), PARP-2 (IC50= 1nM), and PARP- 3 (IC50= 4nM) [37]. Thus, we investigated the basal expres- sion profile of the three target isoforms in untreated Caco-2 cells forming a confluent monolayer. We detected continu- ous PARP-1, PARP-2, and PARP-3 mRNA expressions (Figures 4(a)–4(c) ), but with different expression rates (PARP-1>PARP-2>PARP-3) (Figure 4(c)). In Caco-2 cells, PARP-1 was the most highly expressed isoform. PARP-2 and PARP-3 mRNA expressions were at about ~9-fold and~335-fold weaker compared to PARP-1 (Figure 4(c)).
3.3. Olaparib Improved Barrier Function of Epithelial Monolayer in Oxidative Stress. Caco-2 monolayers are widely used as a model for intestinal epithelial barrier [38].
Since the activity of PARP-1, PARP-2, and PARP-3 isoforms can be induced by DNA-damage [39], and as oxidative stress induces mucosal injury in IBD [40, 41], we tested different H2O2concentrations (100-1000μM) on Caco-2 monolayers.
We assessed barrier integrity by an impedance-based tech- nique (Figure 4(d)). Lower concentrations of H2O2 (100- 500μM) did not considerably modify cell index (CI; calcu- lated from TEER impedance values) meaning they did not
impair barrier integrity. However, 1 mM H2O2rapidly and permanently decreased CI. After 24 hrs, 1 mM H2O2 strongly eroded the epithelial monolayer (Figure 4(d)). Con- sequently, in the further experiments, we applied 1 mM con- centration of H2O2 to challenge the barrier. Olaparib pretreatment, 30 min before H2O2 exposure, improved CI compared to H2O2-treated cells and protected monolayer integrity (Figure 5(b)). To confirm these findings, we also performed FITC-dextrantrans-epithelial permeability assay in the same model at the endpoint of the impedance-based measurement, after 24 hrs incubation (Figure 5(a)). We detected about ~20-fold increase in FITC-dextran fluores- cent intensity after H2O2treatment (i.e., FITC-dextran could pass the monolayer) in relation to CTRL. In contrast, ola- parib reduced H2O2-induced FITC-dextran permeability near to the level of control (Figure 5(a)). To even further refine our results, we performed microscopic imaging and observed morphological changes in the structure of epithe- lial monolayer after H2O2treatment. We realized compro- mised, in some places broken monolayer, with presumably dying cells, which lost their connection to neighbors in the monolayer. Olaparib prevented these morphological changes and kept the cells as an integral part of the barrier in their normal, epithelial phenotype (Figure 5(c)).
3.4. Olaparib Protected against Oxidative Stress-Induced Cell Death in Epithelial Barrier. To assess whether oxidative stress-induced barrier dysfunction involves epithelial cell death we performedflow cytometry analysis using Annexin V/7-AAD labeling (Figure 5(d)). H2O2 (1 mM) induced a
marked increase in the amount of 7-AAD positive dead, basically necrotic cells (5.87% of total cells; 4.89-fold increase) compared to CTRL. In addition, it enhanced the annexin V/7-AAD double-positive, late apoptotic cell num- ber (31.9% of total cells; 6.86-fold increase). In our hands, H2O2 had no significant effect on early apoptosis. Olaparib protected against H2O2-induced cell death, i.e., it reduced necrotic cell death (1.25% of total cells; 4.70-fold decrease) and late apoptosis (5.73%; 5.17-fold decrease) almost to the level of CTRL (Figure 5(d)).
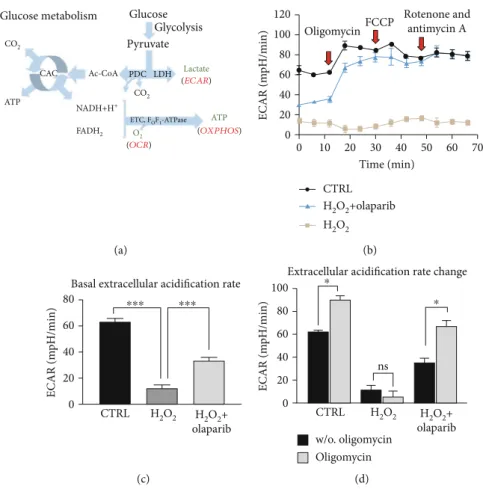
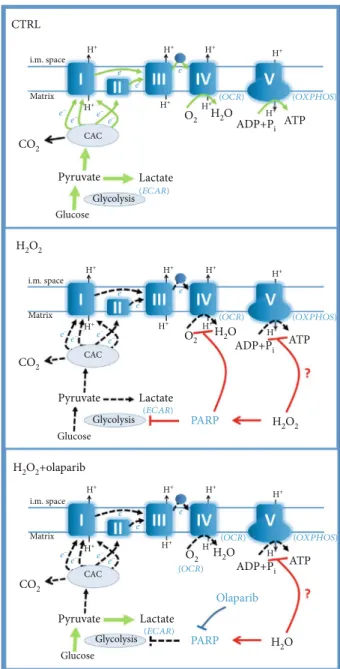
3.5. PARP Inhibition Recovered Glycolytic Activity Compromised by H2O2Treatment.In inflammation, colono- cytes switch their oxidative metabolism (butyrate consump- tion) to aerobic glycolysis and produce lactate [13, 17]
(Figure 6(a)). Thus, we investigated the glycolytic activity by measuring extracellular acidification rate (ECAR), i.e., lactate production (Figure 6(b)), two hours after H2O2treat- ment in the early phase of oxidative stress. H2O2 caused a dramatic collapse in basal ECAR (w/o oligomycin) com- pared to CTRL, which was markedly enhanced by olaparib (Figure 6(b) (1-3 points of the measurement) and Figure 6(c)). Oligomycin treatment increased ECAR both in the CTRL and H2O2+olaparib-treated cells compared to the untreated (w/o oligomycin) group but failed to stimulate acidification in the H2O2-damaged monolayer (Figure 6(b) (4-6 points of measurement) and Figure 6(d)). FCCP, rote- none, and antimycin A did not influence ECAR significantly in either treatment groups (Figure 6(b) (7-12 points of measurement)).
TNBS+
olap (50)
0 VEH TNBS
50 100
250 ns
IL-1𝛽 expression (OD450 in % of VEH)
150 200
⁎ ⁎
(a)
TNBS+
olap (50)
0 VEH TNBS
100 300
IL-6 level (OD450 in % of VEH) 200
⁎⁎⁎ ⁎⁎⁎
⁎
(b) ns
TNBS+
olap (50)
0 VEH TNBS
80 120
IL-10 level (OD450 in % o
f VEH) 100
⁎⁎⁎
⁎
(c)
ns ns
ns
TNBS+
olap (50)
0 VEH TNBS
50 200
TNF-𝛼 elevel (OD450 in % of VEH)
100 150
(d)
Figure2: Olaparib decreased colonic proinflammatory cytokine (IL-1βand IL-6) and increased anti-inflammatory IL-10 cytokine levels.
Cytokine levels of (a) IL-1β, (b) IL-6, (c) IL-10, and (d) TNF-α. Data combined from 2 separate experiments (n= 9-13) and expressed as mean ± SEM; ns: not significant;∗P< 0:05,∗∗P< 0:01, and∗∗∗P< 0:001. VEH: vehicle; TNBS: 2,4,6-trinitrobenzene sulphonic acid; olap (50): 50 mg/kg olaparib.
4,50 4,28 10,62 169,38 50,86 47,97 16,02 333,75 1310,87
22,88 18,04 7,74 6,89 6,99 0,88 0,02 2,08 8,71
147,45 44,84 51,43 16,54 322,33 1242,50
25,93 17,28 7,07 6,88 6,63 0,75 0,25 1,11
2,09A 1,15B
0,32B 0,04 0,01 0,14A
0,11 0,01
± 0,684
± 0,491
± 3,223
± 2,718
± 0,810
± 0,452
± 9,521
± 112,356
± 1,040
± 0,539
± 0,318
± 0,156
± 0,975
± 0,080
± 0,217
± 0,156
± 0,309
± 0,040
± 0,026
± 0,002 ± 0,002
± 0,028
± 0,073
± 0,149
± 0,366
± 0,003
± 0,055
±1,258
±0,174
±0,422
±0,490
±0,340
±95,849
±0,167
±4,753
±0,511
±2,044
±6,793
±0,470
±0,518
± 0,004
± 0,030
± 0,036
± 0,212
± 0,259
± 0,007
± 0,056
±0,692
±0,111
±0,228
±0,219
±0,752
±82,603
±0,204
±5,309
±0,747
±1,258
±3,821
±0,286
±0,280
0,01 0,14 0,22A 1,82A 2,13 0,02 0,79 6,05 6,73 17,56 7,20 23,54 1347,42
16,26 328,05
49,71 49,67 162,40
10,03 (109/L) 4,71
WBC RBC HGB HCT MCV MCH MCHC
PLT RDW-SD RDW-CV PDW MPV P-LCR PCT NRBC NEUT LYMPH
MONO EO BASO Hematological Unit
parameters
(109/L) (g/L)
(%) (fL) (pg) (g/L) (109/L)
(109/L) (109/L) (109/L) (109/L) (109/L) (109/L) (f/L)
(%)
(%) (%) (fL) (fL)
CTRL
mean SEM mean SEM mean SEM
TNBS TNBS
+ olaparib
(a)
0
VEH TNBS TNBS+
olap (50) 10
20 30
Lymphocyte to monocyte ratio (LMR) ⁎⁎
⁎⁎⁎
⁎
(b)
0
VEH TNBS TNBS+
olap (50) 500
1000 1000
Platelet to lymphocyte ratio (PLR)
1500
ns
⁎ ⁎
(c)
0
VEH TNBS TNBS+
olap (50) 5
10 15
Neutrophil to monocyte ratio (NMR)
ns
ns ⁎
(d)
0
VEH TNBS TNBS+
olap (50) 1
2 4
Neutrophil to lymphocyte ratio (NLR)
3
⁎
⁎ ⁎
(e)
Figure3: Olaparib modified hematological parameters and improved blood cell ratios in TNBS-treated mice. (a) Hematological parameters in the VEH, TNBS, and TNBS+olap (50) groups.Mean values ± SEMare shown in the table. A, B = different letters in each row indicate significant differences between groups (P< 0:05). Data combined from 3 separate experiments (n= 9-20). (b) Lymphocyte to monocyte ratio (LMR), (c) platelet to lymphocyte ratio (PLR), (d) neutrophil to monocyte ratio (NMR) (e), and neutrophil to lymphocyte ratio (NLR) values were calculated for each mouse individually before the averages were determined. Mean ± SEM is shown; ns: not significant;∗P< 0:05,∗∗P< 0:01, and ∗∗∗P< 0:001. Data are combined from 3 separate experiments (n= 9-20). Abbreviations: WBC:
white blood cell number; RBC: red blood cell number; HGB: hemoglobin; HCT: hematocrit; MCV: mean corpuscular volume; MCH:
mean corpuscular hemoglobin; MCHC: mean corpuscular hemoglobin concentration; PLT: platelet count; RDW-SD: red cell distribution width-standard deviation; RDW-CV: red cell distribution width-coefficient of variation; PDW: platelet distribution width; MPV: mean platelet volume; P-LCR: platelet large cell ratio; PCT: procalcitonin; NRBC: nucleated red blood cells; NEUT: neutrophil count; LYMPH:
lymphocyte count; MONO: monocyte count; EO: eosinophil count; BASO: basophil count.
3.6. PARP Inhibitor Olaparib Preserved Mitochondrial Respiration in H2O2-Induced Stress.Under physiologic con- ditions, butyrate is the main source of ATP in colonocytes [12], and butyrate metabolism involves dynamic mitochon- drial ETC activity and continuous OXPHOS [42]. Therefore, we investigated the activity of ETC and OXPHOS by mea- suring the oxygen consumption rate in our epithelial barrier model (Figure 7(a)). First, the basal respiration (OCR w/o oligomycin, green field on Figure 7(a)) was determined.
H2O2reduced basal respiration in epithelial cells compared to CTRL, and olaparib did not modulate this effect (Figure 7(b) (1-3 points of measurement and Figure 7(c)) indicating that olaparib had no effect on basal respiration.
After oligomycin treatment, the ATP production-linked OCR (OCR with oligomycin, yellow field on Figure 7(a)) can be measured that reflects the activity of OXPHOS and ATP generation. Oligomycin reduced OCR and OXPHOS
xoverall in all three experimental groups (Figure 7(b) (4-6 points of measurement]) and Figure 7(d)), but H2O2-treated cells consumed O2even to a lesser extent than CTRL, which suggested a reduced ATP production. Olaparib had no sig- nificant effect on the ATP-linked OCR in H2O2-treated cells (Figure 7(d)). Furthermore, olaparib ameliorated the H2O2- induced decline in coupling efficiency (Figure 7(e)). In con- trast, FCCP, an uncoupling agent that induces maximal res- piration in the mitochondria (OCR with FCCP, beige field on Figure 7(a)), enhanced OCR in all three groups in differ- ent extents (Figure 7(b) (7-10 points of measurement)). We detected the highest OCR in CTRL, the lowest in the H2O2- induced cells while olaparib counteracted the effect of H2O2 (Figure 7(b) (7-10 points of measurement) and Figure 7(f)).
FCCP application also determined spare respiratory capacity (blue field on Figure 7(a)). Spare respiratory capacity was intensely reduced by H2O2compared to CTRL, but olaparib
0
10 15 20 25 30
Cycles
35 40 1000
2000 3000
Relative fluorescence unit (RFU)
4000
threshold
𝛽-Actin PARP-1
PARP-2 PARP-3
threshold
(a)
Size standard (bp) 500 200
Actin PARP
-1 PARP
-2 PARP
-3
(b)
PARP-1,2,3 expression (2^(dCq in % of actin)
0 1 2 3 4
PARP-1 PARP-2 PARP-3
⁎⁎⁎
⁎⁎⁎
(c)
–6 –5 –4 –3 –2 –1 0 1
0 3 6 9 12 15 18 21 24
Time (hour)
Cell index (CI)
CTRL H2O2 (100 𝜇M) H2O2 (200 𝜇M)
H2O2 (500 𝜇M) H2O2 (1000 𝜇M)
(d)
Figure4: PARP-1, PARP-2, and PARP-3 are expressed in Caco-2 monolayers and high concentration of H2O2disrupted barrier integrity.
(a) Representative amplification curves of PARP-1, PARP-2, PARP-3, andβ-actin quantitative real-time PCR (each containing three biological replicates and three technical replicates (data for biological replicates is not shown)).β-Actin is used as reference gene. (b) Agarose gel electrophoresis of the PCR products of the amplification (after 40th cycles) introduced in (a). Nonquantitative gene amplicons visualized in a 1.5% agarose gel. (product size: β-actin: 121 bp, PARP-1: 109 bp, PARP-2: 97 bp, and PARP-3: 115 bp; size standard from LONZA DNA ladder, 20 bp). (c) Relative gene expression results (2^(-dCq mean)), where β-actin expression is considered 100% (data is not shown). The relative differences (dCq) between the average Cq for the β-actin and the mean Cq per individual samples (PARP-1, PARP-2, and PARP-3). (d) Effect of H2O2at different concentrations (100-1000μM) on the disruption of epithelial barrier integrity of Caco-2 monolayers. Electrical impedance was monitored every 3 minutes for 24 hours with an xCELLigence RTCA instrument. Impedance-related cell index (CI) values from one of three independent experiments are expressed as mean ± SD (n= 4-6).
0 CTRL 10 20 30
FITC-dextran permeability, (fluorescent intensity in AU)
H2O2 H2O2+ olaparib
⁎⁎⁎
(a)
–5 –4 –3 –2
Cell index
–1 0 1 2
0 3 6 9 12 15 18 Time (hours)
21 24 27
⁎⁎
⁎
CTRL H2O2 H2O2+olaparib
(b)
CTRL H2O2 H2O2+olaparib
(c)
0 1 2 3 4
0 1 2
Cell viabili
ty 3 4
CTRL H2O2 H2O2+olaparib
ANNEXIN V
Apoptosis profile
Dead 0.58%
Late Apop./Dead 3.64 %
94.06%
Live
1.72 % Early Apop.
0 1 2 3 4
0 1 2
Cell viability
0 0
Live 20 40 60 80 100 120
1 2 3 4
0 1 2
Cell viability Cell distribution (%)
3 4
olaparib
ANNEXIN V
Apoptosis profile
Dead 0.82 %
Late Apop./Dead 4.28 %
92.60 % Live
2.30 % Early Apop.
3 4
ANNEXIN V
Apoptosis profile
Dead 1.42%
Late Apop./Dead 29.68 %
94.06%
Live
4.52 % Early Apop.
0 1 2 3 4
0 1 2
Cell viabilit
y 3 4
ANNEXIN V
Apoptosis profile
Dead 0.34 %
Late Apop./Dead 5.44 %
88.64%
Live
5.68%
Early Apop.
Early Late
ns ns ns
ns ns ns
ns ns
Apoptosis
Total Dead
⁎
⁎⁎⁎
⁎⁎⁎
⁎⁎⁎
⁎⁎⁎
⁎⁎⁎
⁎⁎⁎
CTRL olaparib
H2O2 H2O2+olaparib (d)
Figure 5: Olaparib improved epithelial barrier integrity in H2O2-treated Caco-2 monolayers. Caco-2 monolayers were pretreated with 10μM olaparib for 30 minutes before 1 mM H2O2 treatment for 24 hours in all experimental settings. The CTRL and H2O2groups received the same amount of DMSO as the olaparib-treated cells. (a) FITC-dextran epithelial permeability assay. 40 kDa FITC-dextran (1 mg/ml) was added to the upper chamber of the Transwell plate. After 1 hour of incubation, the medium from the lower chamber was collected and thefluorescence intensities were measured. Data combined from 2 separate experiments (n= 4). (b) Electrical impedance monitoring of Caco-2 monolayers using E-Plates and xCELLigence RTCA instrument. Data from one of three experiments are expressed as mean ± SD (n= 4-6). (c) Representative light microscopy images of confluent Caco-2 monolayers after 24 hours treatment. (d) Determination of apoptosis and necrosis in Caco-2 monolayers analyzed by Muse Annexin V & Dead Cell Kit. Representative apoptosis profiles and the percentage of live, early apoptotic, late apoptotic, total apoptotic, and necrotic cells are presented. Data are combined from 2 separate experiments (n= 4) and expressed asmean ± SD; ns: not significant;∗P< 0:05,∗∗P< 0:01, and∗∗∗P< 0:001.
attenuated this reduction (Figure 7(g)). H2O2 reduced pro- ton leak (orange field on Figure 7(a)) compared to CTRL, and it was further reduced by olaparib in Caco-2 cells (Figure 7(h)).
4. Discussion
The anti-inflammatory role of PARP inhibition is thor- oughly established; however, introduction of PARP inhibi- tors into clinical therapy of anti-inflammatory diseases has not been initiated yet because of the potential risk in long- term use of the drugs [33]. In this study, we intended to pro- vide experimental support for repositioning the PARP inhib- itors (which are successfully applied in human cancer therapy) for the clinical management of the acuteflare-up periods of CD. For that purpose, we used a TNBS-induced experimental colitis model in mice, which is widely accepted for studying CD, since they share many pathological (clini- cal, histological, and biochemical) characteristics [35]. Fur- thermore, enhanced PARP-1 expression was found in the colon of rodents [43, 44] in experimental colitis models, as
well as in IBD patients [45], which makes the model more valuable for studying PARP inhibitors. In this report, we explicitly focused on the epithelial barrier function, cell sur- vival, and bioenergetics; hence, we used a Caco-2 monolayer as an in vitromodel of intestinal epithelial barrier [46]. We demonstrate that olaparib improves inflammation in TNBS-colitic mice and that it protects Caco-2 epithelial bar- rier in oxidative stress by rescuing glycolytic activity and by protecting some aspects of mitochondrial function.
In a recent review about repurposing PARP inhibitors for the therapy of nononcological diseases [33], Berger et al. did not consider IBD among those chronic diseases, in which the assumed benefits vs. the risks justifyfirst prior- ity of repurposing. However, the available preclinical data on IBD models successfully utilized outdated PARP inhibitors such as 3-aminobenzamide [47]. Our findings of in vivo anti-inflammatory effects of olaparib, a PARP inhibitor approved for human cancer therapy, may justify initiation of clinical trials for repurposing this drug for IBD therapy.
We hypothesize that PARP inhibition might be beneficial in the acute flare-ups of severe CD, where detrimental
Glucose metabolism Glucose Glycolysis Pyruvate
PDC LDH CO2
O2
ATP NADH+H+
ETC, FOF1-ATPase (OCR)
(OXPHOS) Lactate (ECAR)
FADH2 CO2
Ac-CoA CAC
ATP
(a)
0
0 10 20 30 40 50 60 Time (min)
70 20
40 60 80
ECAR (mpH/min)
100 120
CTRL H2O2+olaparib
OligomycinFCCP Rotenone and antimycin A
H2O2 (b)
0 20 40 60
ECAR (mpH/min)
80
Basal extracellular acidification rate
CTRL H2O2+
olaparib H2O2
⁎⁎⁎
⁎⁎⁎
(c)
0 20 40 60
ECAR (mpH/min)
100 80
CTRL H2O2+
olaparib w/o. oligomycin
H2O2 ns
Oligomycin
⁎ Extracellular acidification rate change⁎
(d)
Figure6: Olaparib improved aerobic glycolysis in Caco-2 monolayers exposed to H2O2-induced oxidative stress. Seahorse XFp Mito Stress test was performed after Caco-2 monolayers were pretreated with 10μM olaparib for 30 minutes and then treated with 1000μM H2O2for 2 hours. The CTRL and H2O2groups received the same amount of DMSO as the olaparib-treated cells. Oligomycin (1μM), FCCP (1μM), and the mixture of rotenone and antimycin A (1μM) were added sequentially during the measurement. (a) Schematic illustration of glucose metabolism. (b) Extracellular acidification rate (ECAR), (c) basal ECAR, and (d) ECAR changes are shown. ECAR changes were calculated by the difference between ECAR before and after oligomycin injection. Data combined from 2 separate experiments (n= 4);
ns: not significant; ∗P< 0:05, ∗∗P< 0:01, and ∗∗∗P< 0:001. Abbreviations: PDC: pyruvate dehydrogenase complex; LDH: lactate dehydrogenase; CAC: citric acid cycle; ETC: mitochondrial electron transport chain; ECAR: extracellular acidification rate; OCR: oxygen consumption rate; OXPHOS: oxidative phosphorylation.