Materials & Design
Volume 152, 15 August 2018, Pages 129-139 https://doi.org/10.1016/j.matdes.2018.04.050
Structure, Properties and Interactions in Ionomer/Lignin blends
Gábor Szabó
1,2, Dávid Kun
1,2,*, Károly Renner
1,2and Béla Pukánszky
1,21 Laboratory of Plastics and Rubber Technology, Department of Physical Chemistry and Materials Science, Budapest University of Technology and Economics, H-1521 Budapest, P.O.Box 91,
Hungary
2 Institute of Materials and Environmental Chemistry, Research Centre for Natural Sciences, Hungarian Academy of Sciences, H-1519 Budapest, P.O. Box 286, Hungary
*Corresponding author: Phone: +36-1-463-4337, Fax: +36-1-463-3474, Email:
kun.david@mail.bme.hu
2 Abstract
Blends were prepared from lignin and ionomers, i.e. ethylene-methacrylic acid copolymers partially neutralized with inorganic salts, to check the possible effect of ionic bonds on the structure and properties of the blends. Two lignosulfonates were used as the lignin component, and a low density polyethylene as well as an ethylene-acrylic acid copolymer without any neutralization as references. The lignin content of the blends varied between 0 and 60 vol%. The components were homogenized in an internal mixer and the blends were characterized by various methods including dynamic mechanical analysis, differential scanning calorimetry and tensile testing. The size of dispersed lignin particles was determined from scanning electron micrographs by image analysis.
Component interactions were estimated quantitatively by two different methods. All the studied properties of ionomer/lignin blends indicated the development of strong interactions between the components. The simultaneous action of hydrogen bonds of non-neutralized methacrylic acid moieties and ionic bonds resulted in the formation of small, dispersed lignin particles of the size of several tenth of a micron. Hydrogen bridges seem to improve interactions and compatibility somewhat more than ionic bonds. Ionomer/lignin blends with a reasonable combination of properties can be produced at moderate lignin contents.
Keywords: lignin blends, hydrogen bridges, ionic bonds, compatibility, mechanical properties, dispersed structure
3 Introduction
The drive towards sustainable economy recently increased the interest in biopolymers enormously. Such materials can be of biological origin, biodegradable or both. More and more research is done on natural polymers with the goal to use them in larger quantities in all areas of the economy.
Cellulose, starch, lignin, chitosan and chitin are produced by nature in very large quantities; they are easily available and usually cheap, often because they form as a side product in an industrial process.
Unfortunately, the direct use of natural polymers is problematic in the plastics industry because they are difficult to process and their properties are inferior to synthetic polymers currently used. All said above applies to lignin which is the natural polymer occurring in the second largest amount in nature [1]. Moreover, it is produced as a side product in the cellulose and bioethanol industry, thus its value added application in plastics could result in considerable economical gain [2,3].
Recently many attempts are made to use lignin in plastics, either in blends or as a reactive component of resins. Blends have been and are made from the most various polymers, i.e. from polyethylene (PE) [4-6] and polypropylene (PP) [7-11], poly(ethylene-oxide) [12,13], polystyrene (PS) [14,15], poly(vinyl chloride) [16-18], polycarbonate (PC) [15], poly(ethylene terephthalate) (PET) [15,19], and various biopolymers like poly(lactic acid) [20-22], polycaprolacton [23], poly(butylene succinate) [24], poly(hydroxybutyrate) [25], etc. Phenol formaldehyde [26-28] and epoxy resins [29- 31] as well as polyurethanes [32-34] have been also prepared with lignin as a reactive component.
Wide varieties of structures and properties have been reported for polymer/lignin blends. Authors observed heterogeneous structures, but also complete miscibility for example in PP/lignin blends [35], which, in view of the strong polarity of lignin, seems to be rather strange. Our previous studies on polymer lignin blends showed that lignin is immiscible with PP, forms large particles in the PP matrix and the blend has very poor properties [7]. Interfacial adhesion could be improved through the application of a functionalized polymer, maleated PP, but the properties, especially deformability, remained poor [7]. Polymers with aromatic rings [15], and even more those containing groups capable for hydrogen bonding [6], resulted in blends with much better properties. However, structure was always heterogeneous and deformability small, thus the practical utilization of these blends is questionable.
The structure and properties of lignin depends on the extraction technology used for its production. Kraft lignin forms in large quantities during cellulose production, but most of it is used as a source of energy in the technology. Lignosulfonates are available is much smaller quantities, but they are used in secondary, usually niche applications in various areas such as the formulation of concrete [36,37] and oil well drilling muds [38], animal feed pelleting [39], dust control [40], and chemical production [41,42]. Lignosulfonates contain a number of methoxy, hydroxyl, acidic and aromatic groups in their structure, but also ionic, sulfonate groups. Accordingly, they can develop dispersion, aromatic π electron and hydrogen bond interactions with polymers, but they are capable of forming also ionic bonds. Although blends have been prepared from lignosulfonates and a wide variety of
4 polymers, quite surprisingly, practically no attempt has been made to combine them with ionomers.
Ionomers are mostly ethylene-acrylic acid or ethylene-methacrylic acid copolymers which are partially neutralized with various, the most often zinc and sodium ions. Consequently, besides dispersion interactions and hydrogen bonds ionomers could form also ionic bonds with lignosulfonates resulting in stronger interactions, better homogeneity and properties. However, up to now the advantage offered by electrostatic interactions was used only in the extraction of organosolv lignin by ionic liquids or in the dissolution of cellulose. The beneficial effect of ionic bonds is demonstrated well by the work of Kilpeläinen at al. [43], who demonstrated the complete dissolution of wood, including its lignin component, in aromatic ionic liquids.
Considering the crucial role of component interactions in the determination of the structure and properties of polymer/lignin blends [2,3], the goal of our work was to prepare blends from lignin and ionomers, estimate the role of various types of interactions in them and determine their structure and properties. Several commercial ionomers neutralized with zinc and sodium ions, respectively, were used in the study combined with two lignosulfonates with calcium and sodium counter ions to check the effect of the valence of the ion on blend properties. Interactions were estimated quantitatively by various methods, structure was studied by electron microscopy, while mechanical properties were characterized by tensile testing. Structure-property correlations as well as relevance for practice are discussed in the final section of the paper.
Experimental Materials
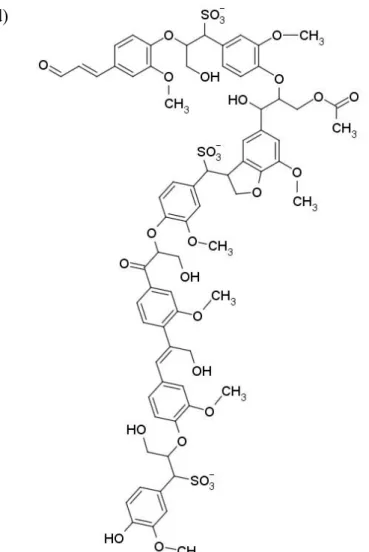
The type, source and the most important characteristics of the polymers used in the experiments are summarized in Table 1. The polyethylene (LDPE) was obtained from MOL Group, Hungary, while the ethylene-acrylic acid copolymer (EAc) and the ionomers from DuPont, USA. The structure of the ionomers is presented in Fig. 1. Most of the data in Table 1 was supplied by the producer, but the composition of the polymers was determined by us with Fourier transform infrared (FTIR) spectroscopy and inductively coupled plasma optical emission spectrometry. PE and the EAc copolymer were used as reference materials. Instead of their trade name ionomers are identified according to their counter ion as ZnMer1 or 2, or NaMer1 or 2, respectively. The two lignosulfonate samples used in the experiments were kindly supplied by Burgo Group, Italy. The Bretax CRO2 grade (CaLS) is the product of cellulose production and the counter ion of the sulfonate groups is calcium.
The lignin used has small molecular weight (Mn = 1400-2400 g/mol), and it contains various amounts of inorganic salts and sugar. The Bretax SRO2 (NaLS) has the same characteristics, but the counter ion is sodium. Whenever in further discussion lignin is mentioned, we always mean lignosulfonate under this term. One possible model structure of the lignin molecule is also presented in Fig. 1. The amount of lignin increased from 0 to 60 vol% in 10 vol% steps in the blends.
5 Table 1 The most important characteristics of the polymers used as matrix materials in the experiments;
identification, properties and chemical composition
Trade name Abbrev. Composition (mol%) Den-
sity (g/cm3)
MFRa (g/10 min)
Tmb
(°C) Tfc
(°C) (Meth)ac-
rylic acid
Meth- acrylate
iBu- acrylate
Tipolen FA 244-51 LDPE – – – 0.92 0.3 106 91
Nucrel 31001 EAc 3.5 – – 0.94 1.3 99 80
Surlyn 1601 NaMer1 0.9 1.4 – 0.94 1.3 98 68
Surlyn 8150 NaMer2 1.5 2.4 – 0.97 4.5 84 40
Surlyn 1706 ZnMer1 1.4 2.4 – 0.95 0.7 90 54
Surlyn 9020 ZnMer2 2.4 2.7 1.8 0.96 1.0 85 64
a) 190 °C/2.16 kg; b) melting point; c) freezing point
a)
b)
c)
6 d)
Figure 1. Chemical structure of the polymers used as matrix in the study and a model molecule of the lignin studied; a) EAc, b) NaMer, c) ZnMer2, d) lignosulfonate.
Sample preparation
The components were homogenized in a Brabender W 50 EHT internal mixer at 190 °C set temperature, 42 cm3 charge volume, 50 rpm and 10 min mixing time after the addition of lignin. Torque and temperature were recorded during mixing and used in further analysis. Plates of 1 mm thickness were compression molded at 190 °C using a Fontijne SRA 100 machine. After storing the plates for one week at room temperature, tensile bars were machined from them for further testing.
Characterization
In order to determine relaxation transitions and the glass transition temperature of the polymer, dynamic mechanical thermal analysis (DMTA) was carried out on specimens with 50 x 5 x 1 mm dimensions between -150 and the melting of the specimen at 1 Hz frequency, 10 μm deformation and 2 °C/min heating rate. Transitions were studied also by differential scanning calorimetry (DSC) using
7 a Perkin Elmer DSC 7 apparatus. The measurements were performed in two heating and one cooling runs between 30 and 130 °C with heating and cooling rates of 10°C/min. The weight of the samples was 3-5 mg in each case. Mechanical properties were characterized by tensile testing using an Instron 5566 universal testing machine. Gauge length was 80 mm and the test was done at 10 mm/min cross- head speed. The structure of the blends was analyzed by scanning electron microscopy (SEM) using a Jeol JSM 6380 LA apparatus. Thin slices were cut from the 1 mm thick plates using a Leica EM UC6 microtome at -80 °C and then the lignosulfonate was dissolved from the slices by soaking them in distilled water for 24 hours at ambient temperature. The average size and the size distribution of dispersed lignin particles were determined by image analysis. The blends were studied also by FTIR spectroscopy and rotational viscometry, but the results are not discussed in the paper thus further details are omitted here.
Results and discussion
The results are presented in several sections. The properties and structure of the blends are shown in the first two sections followed by the estimation and discussion of component interactions in the subsequent one. Correlations between structure and properties are analyzed in the next part of the paper together with comments on consequences for practice.
Properties
The processability of the blends is an important practical aspect. Among other factors, it is determined by viscosity. The lignosulfonates used cannot be melted and processed, because of the strong interactions among lignin molecules. The torque measured during the homogenization of the components is proportional to viscosity thus offers information about the processability of the blends.
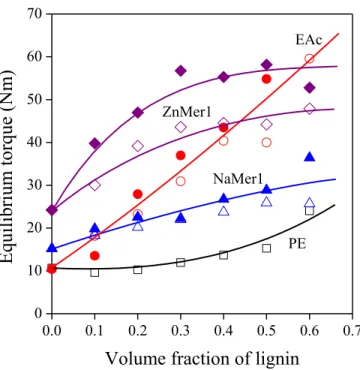
Equilibrium torque is plotted against lignin content in Fig. 2. Only selected correlations are shown in the figure, because the presentation of all twelve series would have overcrowded the figure leading to confusion and making understanding difficult. Torque values change in a wide range and cover the entire area of the plot. The melt flow rate of the polymer is not the determining factor (see Table 1), since the PE used as reference has the smallest melt flow rate (MFR) while its blends have the smallest viscosity at the same time (Fig. 2). PE behaves differently from the ionomers; the shape of the torque vs. lignin content correlation is different from the rest. The behavior of the EAc copolymer is somewhere between the two groups, its viscosity depends almost linearly on lignin content.
Apparently, interactions play an important role in the determination of viscosity. Lignosulfonates having sodium counter ions are marked with empty, while those containing calcium with full symbols.
Blends with CaLS seem to have larger viscosity practically in all cases. The difference might indicate the role of the valence of the ion, but the inherent properties of the two lignin samples might be different as well. Nevertheless, differences in viscosity as a function of lignin type and ionomer composition indicate that the interaction of the components is a crucial factor in the case of these blends.
8
0.0 0.1 0.2 0.3 0.4 0.5 0.6 0.7 0
10 20 30 40 50 60 70
Equilibrium torque (Nm)
Volume fraction of lignin
PE EAc
ZnMer1
NaMer1
Figure 2. Equilibrium torque measured during the homogenization of the components plotted against lignin content. Symbols: () LDPE, () EAc, () NaMer1, () ZnMer1; full symbols: CaLS, empty symbols: NaLS.
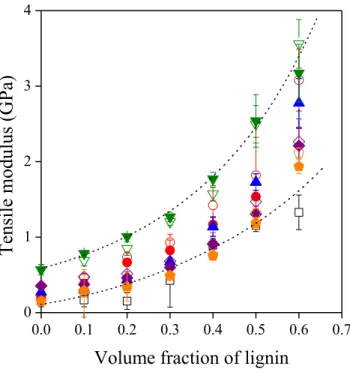
The stiffness of the blends is plotted against lignin content in Fig. 3. Modulus increases steeply with increasing lignin content, as expected. Lignin molecules are small, the interactions among them are strong, thus lignin is a stiff material, and consequently it increases the modulus of the ionomers quite substantially. Stiffness covers a very wide range; it increases from a few tenths to more than 3.5 GPa at the largest lignin content for the NaMer2/NaLS blend. It is somewhat surprising that unlike torque, the modulus of the various blends do not differ very much, but stiffness is not as sensitive to interactions as viscosity or mechanical properties measured at larger deformations.
9
0.0 0.1 0.2 0.3 0.4 0.5 0.6 0.7 0
1 2 3 4
Tensile modulus (GPa)
Volume fraction of lignin
Figure 3. Effect of lignin content on the stiffness of the polymer/lignin blends. Symbols are the same as in Fig. 2. Additional symbols: () NaMer2, () ZnMer2.
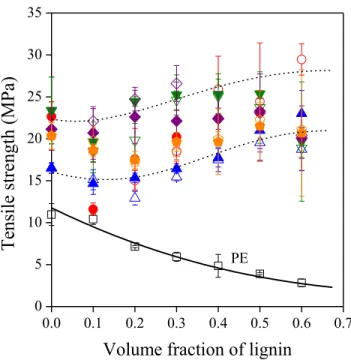
Tensile strength is plotted against the lignosulfonate content of the blends in Fig. 4. Clear difference can be observed between the behavior of PE used as reference and the rest of the polymers including the EAc copolymer. After a slight decrease at small lignin contents, tensile strength increases with increasing lignin concentration. The peculiar shape of the correlations results from the changing deformability of the samples. The elongation-at-break of the neat matrix polymers is very large, between 200 and 500 %, but it decreases drastically with increasing amount of lignin and becomes less than 10 % above 40 vol% lignosulfonate content. Although tensile strength values cover some range, they are rather similar to each other in both tendency and value. The similar behavior of the EAc copolymer to the ionomers indicates that hydrogen bonds are at least as important in improving compatibility as ionic bonds; in fact, based on these results, the effect of the two kinds of interactions cannot be distinguished from each other.
10
0.0 0.1 0.2 0.3 0.4 0.5 0.6 0.7 0
5 10 15 20 25 30 35
Tensile strength (MPa)
Volume fraction of lignin
PE
Figure 4. Dependence of tensile strength on the composition of the ionomer/lignin blends studied.
Symbols are the same as in Figs. 2 and 3.
Structure
The composition dependence of properties presented in the previous section indicates the development of much stronger interactions in the EAc copolymer and ionomer blends than in polyethylene. These interactions should result in dissimilar structure as well. The structure of ionomer/lignin blends can be rather complicated. The polymers have a crystalline phase, ionic species form clusters or aggregates [44-48] and lignin generates either a homogeneous or a heterogeneous structure. Miscible blends could not be prepared from any of the polymers (LDPE, PP, PS, PC, glycol modified PET, ethylene-vinyl alcohol copolymers) used as matrix previously and lignin in preceding projects [6,7,15].
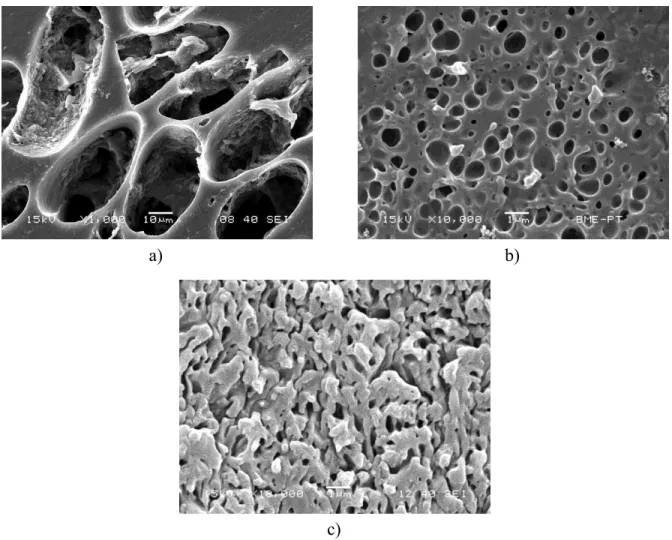
The structure of polymer lignin blends is demonstrated with a few SEM micrographs in Fig. 5.
A micrograph recorded on a PE/lignin blend at 30 vol% lignin content is shown in Fig. 5a. Large lignin particles are dispersed in polyethylene indicating the poor interaction of the two components. Although heterogeneous structure forms also in the ionomers, the size of the dispersed particles is about two order of magnitudes smaller as shown by Fig. 5b as an example (see the different scale). Even the appearance of an interpenetrating network (IPN) like structure is observed at large lignin contents in some of the blends (Fig. 5c). Such IPN like structure has never been detected in any of the blends
11 studied before [6,7,15] that indicates the good interaction of the ionomers and lignin. Improved interaction and small dispersed particles might result from ionic, but also from H-bonding interactions, since all the copolymers contain non-neutralized acrylic or methacrylic acid.
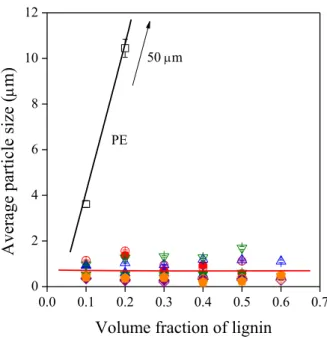
Particle size was determined quantitatively by image analysis. The dependence of particle size on lignin content is presented in Fig. 6. In accordance with Fig. 5, the average particle size is very large in PE; it is around 4 m already at 10 vol% lignin and goes up to around 50 m with increasing lignin content. On the other hand, the average size of dispersed lignin particles is much smaller in EAc and in the ionomers, changes between 0.2 and 1.8 m, and practically does not depend on composition.
The composition of the polymer and the type of the counter ion of the lignosulfonate affect particle size, but only within this range.
a) b)
c)
Figure 5. Representative SEM micrographs demonstrating the structure of the polymer/lignin blends studied. a) LDPE, 30 vol% lignin, b) ZnMer1, 30 vol% lignin, c) IPN structure in a ZnMer1 blend, 50 vol% lignin. Note the different scale in micrograph a) and b), c).
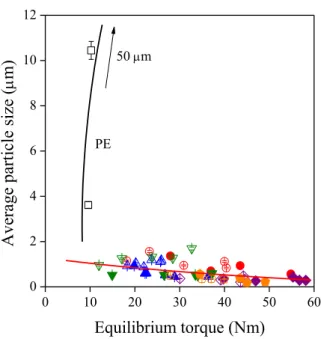
12 The size of the original lignin particles is around 80 m. The final size of the particles depends on thermodynamic and kinetic factors, i.e. on interactions and the shear forces prevailing during mixing. The effect of kinetics is shown in Fig. 7 in which particle size is plotted against the equilibrium torque measured during homogenization. Particle size increases in PE due to coalescence, and slightly decreases in the rest of the blends. The very small effect of kinetics proves that interactions are strong in the ionomer blends and thermodynamics dominates particle size.
0.0 0.1 0.2 0.3 0.4 0.5 0.6 0.7 0
2 4 6 8 10 12
Average particle size (m)
Volume fraction of lignin
50 m
PE
Figure 6. Effect of lignin content on the average size of dispersed lignin particles in the polymer lignin blends studied. Symbols are the same as in Figs. 2 and 3.
13
0 10 20 30 40 50 60
0 2 4 6 8 10 12
Average particle size (m)
Equilibrium torque (Nm)
50 m
PE
Figure 7. Independence of particle size of kinetic effects in the EAc and the ionomer blends studied.
Symbols are the same as in Figs. 2 and 3.
Interactions
The fact of the formation of strong interactions is established, but the estimation of their strength is quite difficult, especially in the present case. The easiest way to obtain a rough estimate about interactions is the calculation of the Flory-Huggins interaction parameter [49,50] from Hildebrand solubility parameters [51]. These latter can be taken from handbooks or can be calculated from the group contributions of Small [52], Hoy [53] or van Krevelen [54]. Unfortunately, group contributions do not exist for ionic moieties, thus this route cannot be followed. Interactions can be estimated also from thermal analysis [55-58], either from DMTA or from DSC measurements.
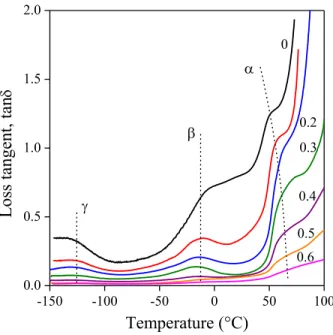
DMTA traces, or more exactly, the temperature dependence of loss tangent, are presented in Fig. 8 for the ZnMer2/NaLS blends. Three transitions can be observed on the traces. The one detected at the lowest temperature at around -125 °C is usually assigned to the movement of methylene units [59-62], the transition appearing around -20 °C belongs to the movement of branches [60-64], while the highest to the transition of segments attached to crystals [59,65] or in our cases also to ionic clusters.
According to the results, this latter transition shifts towards higher temperatures with increasing lignin content. The position of none of the peaks depends on lignin content in PE/lignin blends. Obviously, interactions result in decreasing mobility in ionomer/lignin blends. The effect of lignin content on mobility can be seen much better in Fig. 9, in which the temperature of the transition of the polymer is plotted against lignin content. The effect depends on the type of the ionomer and the lignin and
14 covers a relatively wide range. Unfortunately, these results cannot be transformed into a quantitative measure of the strength of interaction.
-150 -100 -50 0 50 100
0.0 0.5 1.0 1.5 2.0
Loss tangent, tan
Temperature (°C)
0.6 0.5 0.4 0.3 0.2 0
Figure 8. Temperature dependence of the loss tangent of ZnMer2/NaLS blends. Effect of lignin content. Shift in the temperature of the α relaxation.
0.0 0.1 0.2 0.3 0.4 0.5 0.6
40 50 60 70 80 90
Temperature of transition (°C)
Volume fraction of lignin
ZnMer1
NaMer1 ZnMer2
PE
15 Figure 9. Dependence of the transition temperature of the relaxation of polymer/lignin blends on lignin content. Symbols are the same as in Figs. 2 and 3.
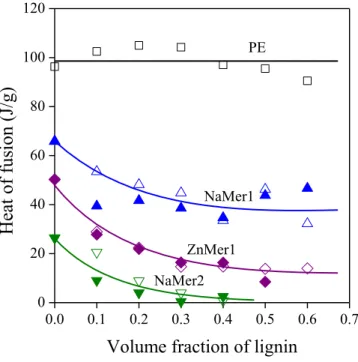
Strong interactions influence also crystalline structure in the blends of a crystalline and an amorphous polymer [55,56]. Both the melting temperature of the crystals and crystallinity decreases with increasing strength of interaction. The heat of fusion of selected blends is presented in Fig. 10 as a function of lignin content. Crystallinity does not change in polyethylene indicating poor interactions, but it decreases quite considerably in the blends of the EAc copolymer and the ionomers. The slope and extent of the decrease differs slightly for the various polymer/lignin blends depending on the composition of the components. Melting temperature also decreases slightly with increasing lignin content in the ionomer blends.
0.0 0.1 0.2 0.3 0.4 0.5 0.6 0.7 0
20 40 60 80 100 120
Heat of fusion (J/g)
Volume fraction of lignin
PE
NaMer1
ZnMer1 NaMer2
Figure 10. Heat of fusion of the polymer component of polymer/lignin blends plotted against their lignin content. Symbols are the same as in Figs. 2 and 3.
Changes in melting temperature allows the quantitative estimation of the Flory-Huggins interaction parameter with the help of the Nishi-Wang approach [55], which is based on the Flory- Huggins lattice model and relates the melting point of the crystalline component to the interaction parameter in the following way
2
21 2
2 0
1 1
1
H V
V R T
Tm m (1)
16 where Tm0 and Tm are the melting points of the crystalline component alone and in the blend, respectively, R the universal gas constant, V1 and V2 the molar volume of the repeat units of the two components, H2 the enthalpy of fusion of the crystalline polymer and 2 its volume fraction in the blend. Eq. 1 can be rearranged to
2
22 2
0 1
H
V T B
Tm m (2)
If the experimental values are plotted according to Eq. 2, a straight line should be obtained and B can be calculated from its slope. B is related to the Flory-Huggins interaction parameter in the following way
T R
V B 1
(3)
The composition dependence of the melting temperature of selected blends is presented in Fig.
11 in the representation of Eq. 2. Straight lines are obtained in most cases with various slopes from which can be derived. Occasionally the fit is not very good, because of the small changes and the standard deviation of the measurement. The calculated Flory-Huggins interaction parameters are listed in Table 2. They have negative values, but the model of Nishi and Wang [55] yields inherently negative interaction parameters indicating complete miscibility that is obviously not true in our case.
Nevertheless, the interaction parameters determined are related to the strength of interactions, and were shown to correlate well with values derived from other approaches [6]. Differences among the blends are rather large. The value obtained for PE is practically the smallest showing the development of weak interactions, while the strength of interaction is the strongest in the EAc/lignin blends. Apparently, hydrogen bonds improve compatibility more than ionic interactions. The rest of the values are between these two extremes. CaLS develops stronger interaction with the polymers than NaLS, thus also the valence of the ion attached to the sulfonate group seems to influence interactions.
17
0.0 0.1 0.2 0.3 0.4
350 360 370 380 390
Melting temperature (K)
Lignin content, 2
NaMer1 PE
EAc ZnMer1
Figure 11. Melting temperature of selected polymer/lignin blends plotted in the representation of the Nishi-Wang approach [55]. See Eq. 2. Symbols are the same as in Figs. 2 and 3.
Another way to estimate the strength of interactions in a heterogeneous polymer system, a composite or a blend, is to use a simple model describing the composition dependence of yield stress [66,67] and tensile strength [68]. For the latter the model can be expressed in the following form [68]
exp
5 . 2 1
1
0 n B
T
T
(4)
where T and T0 are the true tensile strength (T = and = L/L0, where L is the ultimate and L0 the initial gauge length of the specimen) of the blend and the matrix, respectively, n is a parameter taking into account strain hardening, is the volume fraction of the dispersed component and B is related to its relative load-bearing capacity, i.e. to the extent of reinforcement, which, among other factors, depends also on interfacial adhesion. If we transform Eq. 4 into a linear form and plot the natural logarithm of reduced tensile strength against the volume fraction of the dispersed component, we should obtain a straight line, the slope of which is proportional to the load-bearing capacity of the reinforcement, and under certain conditions to the strength of interactions. The tensile strength of selected blends is plotted in this way in Fig. 12. The correlations are linear indeed with different slopes showing dissimilar interfacial adhesion. The B values determined are also listed in Table 2. We can see that the reliability of the approach is much better than that of the Nishi-Wang approach (see
18 determination coefficients, R2), but the obtained values convey the same message. The weakest interaction develops in PE, while the strongest in the EAc copolymer. The rest of the values are very similar between these two boundary cases. Both approaches used for the quantitative estimation of interactions led to the same result showing the development of relatively strong component interactions in the studied ionomer/lignin blends. However, at the same time they also indicate that hydrogen bonds are more beneficial in improving compatibility than ionic bonds, a result that is rather surprising.
0.0 0.1 0.2 0.3 0.4 0.5 0.6 0.7 1
2 3 4 5 6
ln(reduced strength, Tred)
Volume fraction of lignin
PE NaMer1
EAc ZnMer1
Figure 12. Calculation of the reinforcing effect of lignin in the polymer/lignin blends studied. Tensile strength is plotted according to the linearized form of Eq. 4. Symbols are the same as in Figs. 2 and 3.
Table 2 Quantities characterizing the interaction of the components calculated from the Nishi-Wang approach [55] and the composition dependence of tensile strength [68]
Blend Nishi-Wang (Eq. 1) Tensile strength (Eq. 4)
R2a B R2a
LDPE/NaLS -0.001 0.2369 1.07 0.9377
EAc/CaLS -0.486 0.9052 6.01 0.9815
EAc/NaLS -0.390 0.8500 5.16 0.9913
NaMer1/CaLS -0.049 0.4518 4.63 0.9985
NaMer1/Na/LS -0.081 0.3082 4.23 0.9932
NaMer2/CaLS -0.040 0.9252 3.18 0.9745
NaMer2/NaLS -0.014 0.9959 3.21 0.9705
19
ZnMer1/CaLS -0.215 0.7764 3.19 0.9933
ZnMer1/NaLS -0.104 0.6545 3.12 0.9783
ZnMer2/CaLS -0.213 0.4869 3.70 0.9981
ZnMer2/NaLS -0.190 0.5240 4.09 0.9969
a) determination coefficient showing the goodness of the fit Structure-property correlations
The development of strong interactions between lignin and the polymers used in this study, with the exception of PE, of course, was confirmed by both the direct evaluation of the primary results and the use of various theoretical approaches. On the other hand, we could draw very few conclusions about how interactions relate to the composition of the polymers (comonomer content, functional groups) or the type of the ion used either for the neutralization of the ionomers or as a counter ion in the lignosulfonate samples. Several results indicated that the acid content of the polymers has a stronger effect on interactions than their ionic group content. The correlation of the Flory-Huggins interaction parameter determined by the Nishi-Wang approach [55] and the (meth)acrylic acid content of the polymers is presented in Fig. 13 to confirm the above statement. The value of decreases drastically with increasing acid concentration showing a strong effect of this compositional variable on the strength of interaction.
The other approach to estimate interactions quantitatively was the evaluation of the composition dependence of mechanical properties. B values determined from the yield stress (By) and tensile strength (B) of the composites are plotted against the (meth)acrylic acid content of the polymers used as matrix. Two unambiguous correlations are obtained again indicating that with increasing acid content the load bearing capacity of dispersed lignin particles increases (Fig. 14). However, if we plot B values against the ion concentration of the same polymers, we can observe no correlation or some decrease at most (Fig. 15), showing that increasing ion concentration results in the deterioration of mechanical properties.
20
0.0 0.2 0.4 0.6 0.8 1.0 1.2
-0.6 -0.5 -0.4 -0.3 -0.2 -0.1 0.0 0.1
FH interaction parameter
-COOH concentration (mmol/cm3)
Figure 13. Correlation between the Flory-Huggins interaction parameter derived from the Nishi-Wang approach and the concentration of free (meth)acrylic acid in the polymers. Symbols: () 1st heating run, () 2nd heating run.
0.0 0.2 0.4 0.6 0.8 1.0 1.2
0 2 4 6 8
Parameter B
-COOH concentration (mmol/cm3)
By
B
Figure 14. Dependence of parameter B derived from the tensile properties of the blends on the concentration of free acid groups. B is related to the load bearing capacity of the blends and interactions.
Symbols: () tensile strength, B, () tensile yield stress, By.
21
0.0 0.2 0.4 0.6 0.8
0 2 4 6 8
Parameter B
Ion concentration (mmol/cm3)
Figure 15. Slight negative effect of ion concentration on the reinforcing effect lignin in polymer/lignin blends. Symbols: () tensile strength, B, () tensile yield stress, By; full symbols: LDPE.
The obtained results are difficult to interpret or they outright contradict the expectations. One would expect ionic bonds to have a positive effect on homogeneity and properties. We must consider, however, that the separation of the effects of the concentration of ionic and acidic groups is very difficult. We used commercial polymers, in which comonomer content, neutralization, acid content and ion content changed more or less arbitrarily, at least from our point of view. The apparently negative effect of ion concentration might result also from cluster formation; with increasing number of ions the size of the clusters increases [47] and they cannot interact with lignin. On the other hand, ions must have some effect on structure formation, since considering all the blends prepared up to now [6,7,15], the smallest particles formed in the ionomers and traces of a co-continuous phase has not been observed before either. Obviously, in order to separate the effect of acidic and ionic groups on the structure and properties of ionomer/lignin blends, further experiments must be carried out, in which acidic groups are neutralized systematically.
Conclusions
All properties of ionomer/lignin blends indicate the development of strong interactions between the components compared to the dispersion forces forming in the PE/lignin blends used as references.
Strong interactions resulted in the increase of strength, the decrease of deformability, shift in the transition temperature of the matrix polymer and the decrease of the melting temperature as well as the
22 heat of fusion of the latter. The simultaneous action of hydrogen bonds of partially neutralized methacrylic acid moieties and ionic bonds resulted in the formation of small, dispersed lignin particles of the size of several tenth of a micron. The quantitative estimation of interactions by the Nishi-Wang approach and the evaluation of the composition dependence of mechanical properties confirmed the formation of strong interactions. Unambiguous correlations could not be established among the chemical composition of the ionomers, the ions used for their neutralization, the counter ion of the lignosulfonate used and structure, as well as properties. Hydrogen bridges seem to improve interactions and compatibility somewhat more than ionic bonds. In spite of the development of strong interactions, heterogeneous structure formed in the studied ionomer/lignin blends, complete miscibility could not be achieved. The properties of the blends cover a wide range and materials with a reasonable combination of properties can be produced at moderate lignin contents. Above 40 vol% lignin, the blends become extremely brittle for any practical application. Plasticization and chemical modification might lead to further improvement in properties.
Acknowledgements
The authors are indebted to Balázs Podolyák and Henrik Christopher Benke for sample preparation and the evaluation of experimental data. The research on the structure-property correlations of polymeric materials was financed by the National Scientific Research Fund of Hungary (OTKA Grant No. K 120039 and PD 112489) and by the Competitive Central Hungary Operative Programme (VEKOP-2.3.2.-16-2017-00013).
References
1. Sarkanen, K.V.; Ludwig, C.H. Lignins: Occurrence, Formation, Structure and Reactions; John Wiley & Sons, Inc.: New York, 1971.
2. Doherty, W.O.S.; Mousavioun, P.; Fellows, C.M. Value-adding to cellulosic ethanol: Lignin polymers. Ind. Crop. Prod. 2011, 33, 259–276.
3. Kun, D.; Pukánszky, B. Polymer/lignin blends: Interactions, properties, applications. Eur. Polym.
J. 2017, 93, 618–641.
4. Sadeghifar, H.; Argyropoulos, D.S. Correlations of the Antioxidant Properties of Softwood Kraft Lignin Fractions with the Thermal Stability of Its Blends with Polyethylene. ACS Sustainable Chem. Eng. 2015, 3, 349–356.
5. Sadeghifar, H.; Argyropoulos, D.S. Macroscopic Behavior of Kraft Lignin Fractions: Melt Stability Considerations for Lignin–Polyethylene Blends. ACS Sustainable Chem. Eng. 2016, 4, 5160–5166.
6. Podolyák, B.; Kun, D.; Renner, K.; Pukánszky, B. Hydrogen bonding interactions in poly(ethylene-co-vinyl alcohol)/lignin blends. Int. J. Biol. Macromol. 2017, 107, 1203-1211.
23 7. Bozsódi, B.; Romhányi, V.; Pataki, P.; Kun, D.; Renner, K.; Pukánszky, B. Modification of
interactions in polypropylene/lignosulfonate blends. Mater. Des. 2016, 103, 32–39.
8. Chen, F.; Liu, W.; Shahabadi, S.I.S.; Xu, J.; Lu, X. Sheet-Like Lignin Particles as Multifunctional Fillers in Polypropylene. ACS Sustainable Chem. Eng. 2016, 4, 4997–5004.
9. Blanco, I.; Cicala, G.; Latteri, A.; Saccullo, G.; El-Sabbagh, A.M.M.; Ziegmann, G. Thermal Characterization of a Series of Lignin-Based Polypropylene Blends. J. Therm. Anal. Calorim.
2017, 127, 147–153.
10. Sugano-Segura, A.T.R.; Tavares, L.B.; Rizzi, J.G.F.; Rosa, D.S.; Salvadori, M.C.; dos Santos, D.J. Mechanical and thermal properties of electron beam-irradiated polypropylene reinforced with Kraft lignin, Radiat. Phys. Chem. 2017, 139, 5–10.
11. Ye, D.; Kong, J.; Gu, S.; Zhou, Y.; Huang, C.; Xu, W.; Zhang, X. Selective aminolysis of acetylated lignin: Toward simultaneously improving thermal-oxidative stability and maintaining mechanical properties of polypropylene. Int. J. Biol. Macromol. 2017, 108, 775-781.
12. Kubo, S.; Kadla, J.F. Poly(Ethylene Oxide)/Organosolv Lignin Blends: Relationship between Thermal Properties, Chemical Structure, and Blend Behavior. Macromolecules 2004, 37, 6904–
6911.
13. Imel, A.E.; Naskar, A.K.; Dadmun, M.D. Understanding the Impact of Poly(ethylene oxide) on the Assembly of Lignin in Solution toward Improved Carbon Fiber Production. ACS Appl. Mater.
Interfaces 2016, 8, 3200–3207.
14. Victor, P.A.; Gonçalves, S.B.; Machado, F. Styrene/Lignin-Based Polymeric Composites Obtained Through a Sequential Mass-Suspension Polymerization Process. J. Polym. Environ.
2017, https://doi.org/10.1007/s10924-017-1078-2
15. Szabó, G.; Romhányi, V.; Kun, D.; Renner, K.; Pukánszky, B. Competitive Interactions in Aromatic Polymer/Lignosulfonate Blends. ACS Sustainable Chem. Eng. 2017, 5, 410–419.
16. Liu, F.; Xu, K.; Chen, M.; Cao, D. The Roles of Polyacrylate in Poly(vinyl chloride)-Lignin Composites. Polym. Compos. 2011, 32, 1399–1407.
17. Klapiszewski, Ł.; Pawlak, F.; Tomaszewska, J.; Jesionowski, T. Preparation and Characterization of Novel PVC/Silica–Lignin Composites. Polymers 2015, 7, 1767–1788.
18. Tomaszewska, J.; Klapiszewski, Ł.; Skórczewska, K.; Szalaty, T.J.; Jesionowski, T. Advanced organic-inorganic hybrid fillers as functional additives for poly(vinyl chloride). Polimery 2017, 62, 19–26.
19. Kim, S.; Park, J.; Lee, J.; Roh, H.-G.; Jeong, D.; Choi, S.; Oh, S. Potential of a Bio-disintegrable Polymer Blend Using Alkyl-chain-modified Lignin. Fiber. Polym. 2015, 16, 744–751.
20. Cicala, G.; Latteri, A.; Saccullo, G.; Recca, G.; Sciortino, L.; Lebioda, S.; Saake, B. Investigation on structure and thermomechanical processing of biobased polymer blends. J. Polym. Environ.
2017, 25, 750–758.
24 21. Cicala, G.; Saccullo, G.; Blanco, I.; Samal, S.; Battiato, S.; Dattilo, S.; Saake, B.
Polylactide/lignin blends. J. Therm. Anal. Calorim. 2017, DOI: 10.1007/s10973-017-6253-0 22. Ye, H.; Zhang, Y.; Yu, Z. Effect of Desulfonation of Lignosulfonate on the Properties of Poly
(Lactic Acid)/Lignin Composites. BioResources 2017, 12, 4810–4829.
23. Pucciariello, R.; D’Auria, M.; Villani, V.; Giammarino, G.; Gorrasi, G.; Shulga, G.
Lignin/Poly(ε-Caprolactone) Blends with Tuneable Mechanical Properties Prepared by High Energy Ball-Milling. J. Polym. Environ. 2010, 18, 326–334.
24. Sahoo, S.; Misra, M.; Mohanty, A.K. Effect of Compatibilizer and Fillers on the Properties of Injection Molded Lignin-Based Hybrid Green Composites. J. Appl. Polym. Sci. 2013, 127, 4110- 4121.
25. Angelini, S.; Cerruti, P.; Immirzi, B.; Scarinzi, G.; Malinconico, M. Acid-insoluble lignin and holocellulose from a lignocellulosic biowaste: Bio-fillers in poly(3-hydroxybutyrate). Eur.
Polym. J. 2016, 76, 63–76.
26. Lee, S.J.; Kim, H.J.; Cho, E.J.; Song, Y.; Bae, H.-J. Isolation and characterization of lignin from the oak wood bioethanol production residue for adhesives. Int. J. Biol. Macromol. 2015, 72, 1056–1062.
27. Zhao, M.; Jing, J.; Zhu, Y.; Yang, X.; Wang, X.; Wang, Z. Preparation and performance of lignin–phenol–formaldehyde adhesives. Int. J. Adhes. Adhes. 2016, 64, 163–167.
28. Klapiszewski, Ł.; Jamrozik, A.; Strzemiecka, B.; Koltsov, I.; Borek, B.; Matykiewicz, D.;
Voelkel, A.; Jesionowski, T. Characteristics of Multifunctional, Eco-Friendly Lignin-Al2O3
Hybrid Fillers and Their Influence on the Properties of Composites for Abrasive Tools.
Molecules 2017, 22, 1920.
29. Liu, W.; Zhou, R.; Goh, H.L.; Huang, S.; Lu, X. From Waste to Functional Additive: Toughening Epoxy Resin with Lignin. ACS Appl. Mater. Interfaces 2014, 6, 5810–5817.
30. Asada, C.; Basnet, S.; Otsuka, M.; Sasaki, C.; Nakamura, Y. Epoxy resin synthesis using low molecular weight lignin separatedfrom various lignocellulosic materials. Int. J. Biol. Macromol.
2015, 74, 413–419.
31. Xin, J.; Li, M.; Li, R.; Wolcott, M.P.; Zhang, J. Green Epoxy Resin System Based on Lignin and Tung Oil and Its Application in Epoxy Asphalt. ACS Sustainable Chem. Eng. 2016, 4, 2754–
2761.
32. Chung, H.; Washburn, N.R. Improved Lignin Polyurethane Properties with Lewis Acid Treatment. ACS Appl. Mater. Interfaces 2012, 4, 2840–2846.
33. Tavares, L.B.; Boas, C.V.; Schleder, G.R.; Nacas, A.M.; Rosa, D.S.; Santos, D.J. Bio-based polyurethane prepared from Kraft lignin and modified castor oil. eXPRESS Polym. Lett. 2016, 10, 927–940.
25 34. Bernardini, J.; Cinelli, P.; Anguillesi, I.; Coltelli, M-B.; Lazzeri, A. Flexible Polyurethane Foams Green Production Employing Lignin or Oxypropylated Lignin. Eur. Polym. J. 2015, 64, 147–
156.
35. Jeong, H.; Park, J.; Kim, S.; Lee, J.; Cho, J.W. Use of Acetylated Softwood Kraft Lignin as Filler in Synthetic Polymers. Fiber Polym. 2012, 13, 1310–1318.
36. Ramachandran, V.S. Concrete Admixtures Handbook; Noyes Publications: Park Ridge, 1994.
37. Arel, H.Ş.; Aydin, E. Effects of Ca-, Mg-, K-, and Na-lignosulfonates on the behavior of fresh concrete. Constr. Build. Mater. 2017, 157, 1084–1091.
38. Browning, W.C. Oil well drilling fluids. US 2771421 A, 1956.
39. Knodt, C.B. Feed Pelleting Process and The Resulting Product. US 3035920 A, 1963.
40. Anthone, R.; Parks, M.P. Composition and method for soil stabilization. US 4001033 A, 1977.
41. Northey, R.A. In Emerging Technology of Materials and Chemicals from Biomass; Rowell, R.M.; Schultz, T.P.; Narayan, R., Eds.; ACS Symp. Ser. 1992, 476, 146–175.
42. Goheen, D.W. Process of making methyl mercaptan. US 2840614 A, 1958.
43. Kilpeläinen, I.; Xie, H.; King, A.; Granstrom, M.; Heikkinen, S.; Argyropoulos, D.S. Dissolution of Wood in Ionic Liquids. J. Agric. Food Chem. 2007, 55, 9142–9148.
44. Longworth, R.; Vaughan, D.J. Physical Structure of Ionomers. Nature 1968, 218, 85–87.
45. Delf, B.W.; MacKnight, W.J. Low Angle X-Ray Scattering from Ethylene-Methacrylic Acid Copolymers and Their Salts. Macromolecules 1969, 2, 309–310.
46. Eisenberg, A.; King, M. Ion-Containing Polymers: v. 2: Physical Properties and Structure (Polymer Physics); Academic Press: New York, 1977.
47. Kim, J.-S.; Eisenberg, A. In Ionomers – Characterization, Theory, and Applications; Schlick, S., Ed.; CRC Press: New York, 1996; Chapter 2, pp. 7-34.
48. Winey, K.I.; Laurer, J.H.; Kirkmeyer, B.P. Ionic Aggregates in Partially Zn-Neutralized Poly(ethylene-ran-methacrylic acid) Ionomers: Shape, Size, and Size Distribution.
Macromolecules 2000, 33, 507–513.
49. Huggins, M.L. Theory of Solutions of High Polymers. J. Am. Chem. Soc. 1942, 64, 1712–1719.
50. Flory, P.J. Thermodynamics of High Polymer Solutions. J. Chem. Phys. 1942, 10, 51-61.
51. Krause, S. Polymer Compatibility. J. Macromol. Sci. – Revs. Macromol. Chem. 1972, 7, 251–
314.
52. Small, P.A. Some factors affecting the solubility of polymers. J. Appl. Chem. 1953, 3, 71–80.
53. Hoy, K.L. New Values of Solubility Parameters from Vapor Pressure Data. J. Paint Technol.
1970, 42, 76–118.
54. van Krevelen, D.W. Сhemical structure and properties of coal. Fuel 1965, 44, 229-242.
55. Nishi, T.; Wang, T.T. Melting Point Depression and Kinetic Effects of Cooling on Crystallization in Poly(viny1idene fluoride)-Poly (methyl methacrylate) Mixtures. Macromolecules 1975, 8, 909–915.
26 56. Szabó, P.; Epacher, E.; Belina, K.; Pukánszky, B. Effect of component interaction on the melting
and crystallization characteristics of PE/PIB blends. Macromol. Symp. 1998, 129, 137–149.
57. Kim, W.N.; Burns, C.M. Thermal Behavior, Morphology, and the Determination of the Flory- Huggins Interaction Parameter of Polycarbonate-Polystyrene Blends. J. Appl. Polym. Sci. 1987, 34, 945–967.
58. Szabó, P.; Pukánszky, B. Miscibility of Crystalline and Amorphous Polymers:
Polyethylene/Polyisobutylene blends. Macromol. Symp. 1998, 129, 29–42.
59. Illers, K.-H. Mechanisches Relaxationsverhalten und Struktur teilkristalliner Polymerer. Kolloid- Z., Z. Polymere 1969, 231, 622–659.
60. Alberola, N.; Cavaille, J.Y.; Perez, J. Mechanical γ and β relaxations in polyethylene - I. Glass transitions of polyethylene. Eur. Polym. J. 1992, 28, 935–948.
61. Alberola, N.; Cavaille, J.Y.; Perez, J. Mechanical γ and β relaxations in polyethylene - II.
Physical models of the mechanical γ relaxation in polyethylene. Eur. Polym. J. 1992, 28, 949–
953.
62. Willbourn, A.H. The glass transition in polymers with the (CH2)n group. Trans. Faraday Soc.
1958, 54, 717–729.
63. Stehling, F.C.; Mandelkern, L. The Glass Temperature of Linear Polyethylene. Macromolecules 1970, 3, 242–252.
64. Oakes, W.G.; Robinson, D.W. Dynamic electrical and mechanical properties of polythene over a wide temperature range. J. Polym. Sci. 1954, 14, 505–507.
65. Matsuoka, S.; Daane, J.H.; Bair, H.E.; Kwei, T.K. A further study of the properties of transcrystalline regions in polyethylene. J. Polym. Sci. Polym. Lett. 1968, 6, 87–91.
66. Turcsányi, B.; Pukánszky, B.; Tüdős, F. Composition dependence of tensile yield stress in filled polymers. J. Mater. Sci. Lett. 1988, 7, 160–162.
67. Turcsányi, B.; Pukánszky, B.; Tüdős, F. In Interfaces in Polymer, Ceramic, and Metal Matrix Composites; Ishida, H., Ed.; Elsevier: New York, 1988, pp. 467–477.
68. Pukánszky, B. Influence of interface interaction on the ultimate tensile properties of polymer composites. Composites 1990, 21, 255–262.
![Figure 11. Melting temperature of selected polymer/lignin blends plotted in the representation of the Nishi-Wang approach [55]](https://thumb-eu.123doks.com/thumbv2/9dokorg/1424986.120805/17.918.256.632.144.515/figure-melting-temperature-selected-polymer-plotted-representation-approach.webp)
