1
This accepted author manuscript is copyrighted and published by
1
Elsevier. It is posted here by agreement between Elsevier and
2
MTA. The definitive version of the text was subsequently
3
published in Waste Management, 76, 2018, DOI:
4
10.1016/j.wasman.2018.02.045 Available under license CC-BY-
5
NC-ND.
6 7
Rheological and mechanical properties of recycled polyethylene films contaminated by 8
biopolymer 9
10
D. Gerea, T. Cziganya,b,*
11 12
a Department of Polymer Engineering, Faculty of Mechanical Engineering, Budapest 13
University of Technology and Economics, H-1111 Budapest, Muegyetem rkp. 3, Hungary 14
b MTA-BME Research Group for Composite Science and Technology, H-1111 Budapest, 15
Muegyetem rkp. 3., Hungary 16
* corresponding author: czigany@eik.bme.hu 17
18
Abstract. Nowadays, with the increasing amount of biopolymers used, it can be expected that 19
biodegradable polymers (e. g. PLA, PBAT) may appear in the petrol-based polymer waste 20
stream. However, their impact on the recycling processes is not known yet; moreover, the 21
properties of the products made from contaminated polymer blends are not easily predictable.
22
Therefore, our goal was to investigate the rheological and mechanical properties of synthetic 23
and biopolymer compounds. We made different compounds from regranulates of mixed 24
polyethylene film waste and original polylactic acid (PLA) by extruison, and injection molded 25
specimens from the compounds. We investigated the rheological properties of the regranulates, 26
and the mechanical properties of the samples. When PLA was added, the viscosity and specific 27
volume of all the blends decreased, and mechanical properties (tensile strength, modulus, and 28
impact strength) changed significantly. Young’s modulus increased, while elongation at break 29
and impact strength decreased with the increase of the weight fraction of PLA.
30 31
Keywords: recycled polyethylene; polylactic acid; viscosity; pvT diagrams; mechanical 32
properties 33
34
2 1
1. Introduction 2
Nowadays most plastic (about 40% of all plastic) is processed by the packaging sector (Gilbert, 3
2017). The polymers most commonly used for packaging are low density polyethylene (LDPE), 4
linear low density polyethylene (LLDPE), high density polyethylene (HDPE), polypropylene 5
(PP), poly(ethylene terephthalate) (PET), polystyrene (PS) and polyvinyl chloride (PVC) 6
(Gilbert, 2017). The main fields of application of LDPE and LLDPE are reusable bags, trays 7
and containers, agricultural films and food packaging films (Andreoni et al., 2015). According 8
to Plastics News, PET (60%) and PE (35%) accounted for most recycled plastic, due to the 9
short lifetime of packaging materials (Biron, 2017). A wide variety of new products can be 10
produced from plastic waste, therefore it has to be collected and recycled (Andreoni et al., 2015, 11
Sharma and Bansal, 2016).
12
However, lately there has been great demand for packaging made from bioplastics. In 2015, the 13
global production of petroleum-based plastics exceeded 300 million tonnes (Emadian et al., 14
2017). Nevertheless, in 2014, 1.7 million tonnes of bioplastics were manufactured in the world 15
with almost 75% of the volume destined for the packaging market (Biron, 2017; Emadian et 16
al., 2017). According to European Bioplastics, bioplastics have three main groups: biobased, 17
non-biodegradable materials (bio-PE, bio-PET); biobased and biodegradable materials (PLA, 18
starch blends); and fossil-based and biodegradable materials (poly(buthylene-adipate-co- 19
terephthalate) (PBAT)). Shopping bags, mulch films, and yoghurt cans can be made from PLA 20
(Tábi et al., 2010). However, PLA (4.75 $/kg) is more expensive than PE (1.9 $/kg) or PET (1.6 21
$/kg) (Biron, 2017; Emadian et al., 2017).
22
The potential risk of contamination of the collected conventional plastics and the cost of 23
separation have an impact on the quality and processing of recycled materials. For example, 24
PLA and PET cannot be easily or cheaply sorted by sight or by separation methods based on 25
density because their densities are similar (Gent et al., 2009). Therefore, hybrid bioplastics 26
(blends of bio-based and petroleum-based polymers) appeared. While some biopolymers may 27
have little effect on recycled HDPE, the presence of biopolymers can significantly modify the 28
properties of PET (Cornell, 2007; La Mantia et al., 2012). The presence of biopolymers in post- 29
consumer plastic waste makes the recycling of bioplastic blends complicated (Soroudi and 30
Jakubowicz, 2013).
31
Yarahmadi et al., 2016 investigated the effects of reprocessing and recycling on PLA and a 32
PLA/HDPE blend. They used a commercially available (RTP Company) PLA/HDPE blend 33
which contained 39% PLA. To reduce compatibility problems, they used glycidyl methacrylate- 34
3
grafted PE as compatibilizer. The materials were evaluated after a varying number of processing 1
steps (up to 6 consecutive extrusions). Multiple processing of the blend did not significantly 2
change the elastic modulus, but elongation at break was significantly affected by the number of 3
extrusions. Two basic mechanisms can affect elongation at break. One is the degradation of one 4
or both polymers, which decreases elongation at break (La Mantia, 1996). The second is the 5
increased dispersion of the dispersed phase, which means smaller domain size and lower 6
interfacial tension, which causes an increase in elongation at break (Fortelný et al., 2011). The 7
results of Yarahmadi et al., 2016 indicated that multiple processing of a PLA/HDPE blend 8
caused increased dispersion of the PLA in the HDPE, and thus increased elongation at break.
9
Using SEM, they observed the cryofractured surfaces of the samples and found that the size of 10
the particles and holes in the blend extruded once were in the range of 1.0-1.4 μm, whereas in 11
the blend extruded six times, the range was 0.5-0.9 μm. The DSC thermograms of the blends 12
showed that the components of the blend were not miscible. The blending of PLA with HDPE 13
not only caused the crystallization of the PLA, but also led to a significant decrease in its cold 14
crystallization temperature and a significant increase in its melting peak temperature. HDPE 15
acted as a nucleating agent and lowered the surface free energy barrier toward nucleation and 16
thus initiated crystallization.
17
PLA has several advantages: it is recyclable, compostable and can be produced from renewable 18
resources. In addition, it has good stiffness and strength, but it has some disadvantages too, such 19
as moisture sensitivity, poor impact resistance and low heat deflection temperature. There are 20
numerous methods to modify its properties, such as plasticization, copolymerization, blending, 21
or producing composites (As’habi et al., 2013; Chow et al., 2016; Graupner et al., 2016; Imre 22
et al., 2014; Tábi et al., 2016).
23
Abdolrasouli et al., 2015 studied virgin PLA and PLA/PE blends which contained 10%, 20%
24
and 30% PE. They investigated the effects of PE content on morphology and the linear 25
viscoelastic properties of the melt. The minor phase was a linear low density polyethylene co- 26
polymer (PE) with butane as co-monomer. The samples were prepared with an internal mixer 27
(Brabender Plasticorder W50) at a temperature of 180°C. They studied the linear viscoelastic 28
behavior of the samples in the melt with a rheometric mechanical spectrometer (Paar Physica 29
UDS 200). They performed all the measurements at 180°C in a parallel plate fixture. When the 30
concentration of PE increased from 10% to 20%, the diameter of the dispersed phase increased 31
and the relaxation process became longer, leading to an increase in the storage modulus. The 32
blend containing 30% of PE showed higher elasticity than both PLA and the PE homo-polymer 33
4
in the low frequencies. Complex viscosity increased with the increase of the weight fraction of 1
PE, even if this effect was not significant in the higher (100-1000 1/s) shear rate range.
2
Only a few publications examine how the presence of biopolymers affects the properties of 3
conventional petrol-based polymers in their blends. However, according to a recent study of 4
Plastics Recyclers Europe, 2017 it is a considerable problem in Southern Europe because there, 5
in mixed film waste, the share of biodegradable plastics (e.g. starch, PLA, polybutylene adipate 6
terephthalate (PBAT)) is higher than in Northern Europe. Film production with recycled 7
plastics from Northern Europe worked normally, but holes and peaks occurred regularly when 8
recycled plastics from Southern Europe were used. The laboratory tests showed that most of 9
the degradation is caused by substances which are used for the production of biodegradable 10
polymers.
11
Nowadays, when mixed polyethylene film waste is recycled, it is a great problem that small 12
amounts (0.5-1.5%) of bioplastics are often mixed into synthetic polymers. The changes in the 13
properties of a product are not easily predictable, but they are very important to know for the 14
manufacturing of products. The novelty of this manuscript, compared to other publications, is 15
that our goal is not to develop a new blend to improve the properties of PLA or PE, but to 16
analyze the influence of bioplastic contamination in the petrol-based polymer waste stream on 17
the recycling process. Therefore, our goal was to investigate the rheological and mechanical 18
properties of synthetic and biopolymer compounds.
19 20
2. Experimental 21
2.1. Materials 22
LDPE, PP, HDPE and PET are the most common types of plastic processed by the packaging 23
industry and the composition of the plastic fraction of municipal solid waste by polymer type 24
was LDPE (27.9%), HDPE (14%), PP (17.5%) and PET (11.9%) in Europe (Dahlbo et al., 2018;
25
PlasticsEurope, 2016). According to Biron, 2017, PET (60%) and PE (35%) account for most 26
recycled plastic, PP accounting for only 2%. In 2014, PLA was the most used biodegradable 27
bioplastic (Emadian et al., 2017), therefore there is a chance that PE and PLA are mixed in the 28
polymer waste stream.
29
We used regranulates of mixed polyethylene film waste (MPE) (MFR (190°C, 2.16 kg): 0.56 30
g/10 min, density: 0.932 g/cm3), supplied by Jász-Plasztik Ltd. (Hungary). It is a post-industrial 31
mixed film waste, which typically contains 50% HDPE and 50% LDPE. We also used virgin 32
PLA type Ingeo 3100HP (MFR (210°C, 2.16 kg): 24 g/10 min, density: 1.24 g/cm3), supplied 33
by NatureWorks LLC. (USA).
34
5 1
2.2. Material preparation and processing 2
Six different MPE-PLA compounds (regranulates) (100/0, 98/2, 90/10, 75/25, 50/50, 0/100 3
wt/wt%) were produced with a Labtech Scientific LTE 26-48 co-rotating twin-screw extruder.
4
Before extrusion, PLA was dried at 100°C in a Memmert UF1060 hot air drying oven for 90 5
minutes. The screw diameter of the extruder was 26 mm and the length/diameter (L/D) ratio 6
was 48. The temperature profile of the extruder (from intake zone to die) was 190-195-195- 7
200-200-205-210-215-215-220-220-215°C. The melt pressure was 50-55 bar and the 8
throughput was 8 kg/h.
9
Before injection molding, the compounds were dried at 100°C in a Memmert UF1060 hot air 10
drying oven for 3 hours. The injection molded samples were made with an Engel ES 200/45 11
HL-V injection molding machine. Injection rate was 40 cm3/s, holding pressure was 800 bar, 12
holding time was 20 s, residual cooling time was 30 s, and melt and mold temperature were 13
225°C and 25°C, respectively. The mechanical tests were carried out on ISO standard dumbbell 14
shaped tensile specimens.
15 16
2.3. Methods 17
Before the rheological tests, the samples were dried at 100°C in a Memmert UNE 200 hot air 18
drying oven for 3 hours. The shear viscosity of the regranulates was measured with an Instron 19
Ceast SR20 capillary rheometer. The testing temperature in the capillary rheometer was set to 20
190°C. We carried out the measurements in the 100-20000 1/s shear rate range, using four 21
different capillaries: L1 = 5 mm, D1 = 1 mm; L2 = 10 mm, D2 = 1 mm; L3 = 20 mm, D3 = 1 mm;
22
L4 = 30 mm, D4 = 1 mm. We used Bagley correction to calculate true shear stress and the 23
Rabinowitsch analysis to calculate true shear rate. The specific volume (pvT diagram) of the 24
regranulates was measured with an Instron Ceast SR20 capillary rheometer. We determined the 25
specific volume with the direct method at 6 different pressures (50-1000 bar) and at 22 different 26
temperatures ranging from 230°C to 50°C (Carreau et al., 1997). We tested all the samples at 27
least 8 times; in every sample standard deviation was within 5% (therefore error bars are not 28
visible on the figures).
29
Tensile tests were carried out on an Instron 3369 universal testing machine. We calculated the 30
tensile modulus between 0.05% and 0.25% strain with a crosshead speed of 1 mm/min, and 31
determined tensile strength and elongation at break with a crosshead speed of 10 mm/min. The 32
measurements were performed on ISO 527-2/1B dumbbell shaped specimens with an overall 33
6
length of 150 mm and a cross-section of 4 mm × 10 mm. In every measurement, we tested at 1
least 5 specimens, and calculated the average value and standard deviation.
2
Impact strength was determined with the Izod impact test on a Zwick 5113.100/01 impact tester, 3
with pendulums of 2.75 J and 22 J. The measurements were performed on 2 mm notched ISO 4
180/A dumbbell shaped specimens with a length of 80 mm and a cross-section of 4 mm × 10 5
mm. The tests were performed at room temperature and at a relative humidity of 50%. In every 6
measurement we tested at least 10 specimens, and calculated the average and standard 7
deviation.
8
After drying the samples, we measured the residual moisture content with an aboni Hydrotracer 9
FLV water content analyzer. The absolute water content of the material was determined with a 10
chemical method, not based on weight loss during heating. The instrument warmed the PLA 11
granules to 140°C, therefore the water evaporated. The gaseous water reacted with the calcium 12
hydride reagent in a cooled area and hydrogen was formed. A gas sensor detected the hydrogen 13
concentration within the reactor and separate sensors detected the moisture of the ambient air, 14
which came into the reactor at the beginning of the measurement. The software considered these 15
in the calculation of the water content of the PLA granules.
16
The morphology of the blends was studied with a light microscope (Zeiss AXIO Imager M2m) 17
and a scanning electron microscope (Zeiss EVO MA 10). The SEM micrographs were taken 18
from cryo-fractured surfaces.
19
The core and the skin layer of the injection molded samples were investigated with a Bruker 20
Tensor 37 Fourier Transform Infrared Spectroscopy (FTIR) equipment (the resolution of the 21
instrument is better than 0.6 cm-1).
22 23
2.4. Processing experiments 24
In the experiments, MPE was mixed with original PLA (instead of PLA waste), because we did 25
not want to increase the number of influencing factors, we just wanted to discover the effect of 26
biodegradable polymer “contamination”.
27
In the case of PLA, according of the technical data sheet, a moisture content of less than 250 28
ppm (0.025%) is recommended before processing, to prevent hydrolytic degradation. In order 29
to model industrial conditions (PE flakes are usually dried for a short time after the 30
washing/cleaning process), we dried PLA for a shorter time and it had a moisture content of 31
457 ppm before extrusion. Modern film recycling systems (Erema, Starlinger) can process 32
materials (PE, PP) with up to 12% residual moisture. Therefore, drying temperature and/or time 33
can be reduced, and energy consumption, as well as production costs and CO2 emission can be 34
7
decreased. However, in the case of hydrophilic biopolymer (PLA) contaminants mixed in 1
synthetic polymers, hydrolytic degradation probably occurs. Melt temperature was 20°C higher 2
than the recommended value for PLA because of the processing melt temperature of MPE, 3
therefore thermal degradation probably occurred. After extrusion the different regranulates 4
looked like typical regranulates.
5 6 7 8
3. Results and discussion 9
3.1. Rheological properties of the regranulates 10
Figure 1 shows the shear viscosity curves of MPE and PLA before and after extrusion at 190°C.
11
Extrusion did not affect the viscosity of MPE, but after extrusion, the viscosity of PLA 12
decreased. In the case of PLA, this decrease was due to degradation reactions such as thermal 13
unzipping degradation, oxidative chain scission, inter- or intramolecular transesterification and 14
hydrolysis in the presence of moisture. Residual moisture after the drying process attacks the 15
ester linkages, causing chain scission and a decrease in molecular weight, and as a result, 16
viscosity decreases. Several researchers (Harris and Lee, 2012; Jamshidi et al., 1988;
17
Yarahmadi et al., 2016) came to similar conclusions about the degradation of PLA. Degradation 18
under processing takes place not only in sensitive polymers, such as PET or PLA, but also in 19
polymers that are relatively resistant to degradation, for example PE. In the case of PE, both 20
degradation and cross-linking occur after multiple processing, which can increase melt 21
viscosity. This is also supported by the results of Cornell, 2007.
22 23
a) b)
24
8
Figure 1. Viscosity curves of MPE and PLA before and after extrusion in the 100-2000 1/s 1
(a) and the 2000-20000 1/s (b) shear rate range 2
3
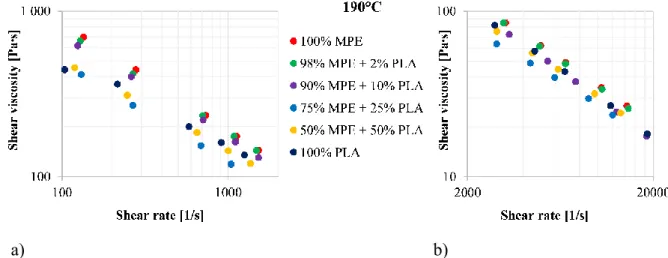
Figure 2 shows the shear viscosity curves of the six different regranulates in the 100-20000 1/s 4
shear rate range at 190°C. The results indicated that the presence of PLA can significantly affect 5
viscosity. The viscosity curves of all the blends showed a decrease in viscosity when PLA was 6
added but this effect was not significant in the 98/2 blend. The melt viscosities of MPE (100/0) 7
and PLA (0/100) were similar in the higher shear rate range (> 2000 1/s), but the viscosities of 8
the blends did not change according to the linear rule of mixtures. Incompatible blends usually 9
show negative deviation in rheological properties (e.g. viscosity, die swell). Therefore, the two 10
components were probably incompatible in the melt at least in the concentrations investigated 11
here. Hamad et al., 2012 found similar results for PLA/LDPE blends in the 0.1-200 1/s shear 12
rate range. They also observed that the viscosity of the blends indicates negative deviation 13
according to the linear rule of mixtures.
14 15
a) b)
Figure 2. Viscosity curves of the different MPE-PLA regranulates in the 100-2000 1/s (a) and 16
the 2000-20000 1/s (b) shear rate range 17
18
Figure 3 shows the pvT curves of the extruded MPE and PLA at 5 different pressures. The 19
specific volume decreased with the increase of pressure. The crystallization of MPE started at 20
~125°C, whereas the crystallization of PLA started at ~135°C. Shrinkage (the decrease of 21
specific volume) was 17% for MPE and 15% for PLA between 230 °C and 50 °C at 50 bar.
22 23
9
a) b)
Figure 3. pvT curves of the extruded MPE (a) and PLA (b) at different pressures 1
2
Figure 4 shows the pvT curves of the different regranulates. The melt pressure for film blowing 3
is about 200-300 bar in industrial extruders, therefore we analyzed the pvT curves at 250 bar.
4
Specific volume decreased with the increase of the weight fraction of PLA but this effect was 5
not significant in the 98/2 blend. This decrease was due to the higher density of PLA. The pvT 6
curve of blends can be estimated based on the rule of mixtures if the pvT curves of the 7
components are known.
8 9
10
Figure 4. pvT curves of the different MPE-PLA regranulates at 250 bar 11
12
3.2. Mechanical properties of the injection molded samples 13
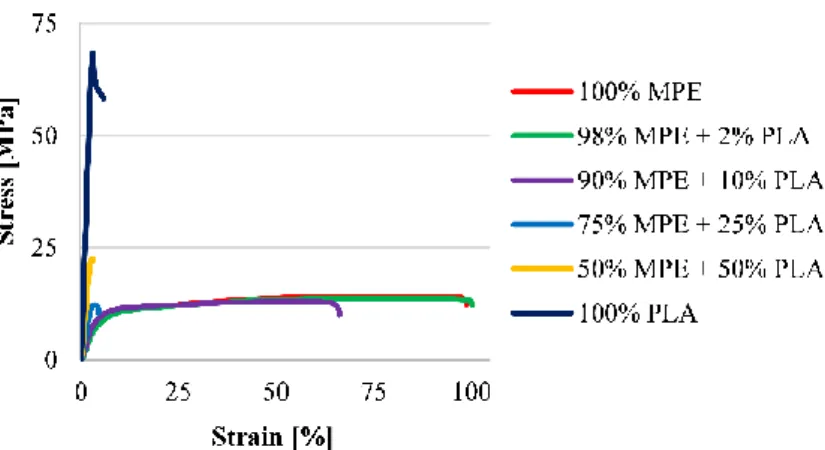
Figure 5 shows the tensile stress-strain curves of the six different samples. The curves show 14
that MPE was flexible and PLA was rigid. The stress-strain curves of all the blends showed a 15
decrease in elongation, but an increase in tensile strength when PLA was added, but this effect 16
was not significant in the 98/2 blend.
17
10 1
Figure 5. Tensile stress-strain curves of MPE-PLA samples with different weight fractions 2
3
Figure 6 and Table 1 show the mechanical properties of the injection molded samples. The 4
100/0 and the 98/2 blend had similar mechanical properties. Tensile strength decreased when 5
10 and 25 wt% PLA was added, but doubled when 50 wt% PLA was added. As the weight 6
fraction of PLA was increased from 0% to 50%, the Young’s modulus increased from 232 MPa 7
to 1137 MPa, while elongation at break decreased from 99.53 % to 3.08 %. In addition to the 8
presence of a rigid component (PLA), the degradation of PLA and the increased droplet size 9
(see Figure 9e-h) could also lead to a decrease in elongation at break when the weight fraction 10
of PLA was increased. The impact strength of the samples greatly decreased when 25 and 50 11
wt% PLA was added, but the 100/0, 98/2, 90/0 samples were not broken, even when the 22 J 12
pendulum was used. As the weight fraction of PLA was increased, tensile strength and the 13
Young’s modulus seemed to change along a parabola, while elongation at break decreased 14
sharply and stayed low, and no tendency could be observed for impact strength. These 15
mechanical properties of the blends did not change according to the linear rule of mixtures.
16
Similarly to rheological properties, the polymer blends are typically incompatible if the values 17
of Young’s modulus, elongation at break and stress at break are below the line of linear rule of 18
mixtures (negative deviation). These results show that PLA and MPE compose an incompatible 19
blend, which is confirmed by the rheological results. The trend of increasing Young’s modulus 20
and decreasing elongation at break well matched the results of Hamad et al., 2012, who studied 21
a PLA/LDPE blend.
22 23
11
a) b)
Figure 6. Tensile strength and elongation at break (a) and Young’s modulus (b) of the 1
different injection molded MPE-PLA samples 2
3 4 5
Property 100%
MPE
98% MPE + 2% PLA
90% MPE + 10% PLA
75% MPE + 25% PLA
50% MPE +
50% PLA 100% PLA Impact
Strength – Izod [kJ/m2]
not broken not broken not broken 6.07 ± 0.28 2.56 ± 0.11 3.75 ± 0.13
Table 1. Impact strength of the different injection molded MPE-PLA samples 6
7
3.3. Structure 8
After the tensile tests, it seemed that there was a core part which was flexible and a skin part 9
which behaved more rigidly. To prove this, we analyzed the cross sections of the tensile bars 10
with a light microscope (Figure 7) and an FTIR spectrometer (Figure 8). In the blends which 11
contained 2 and 10 wt% PLA, the dispersed PLA phases were not visible. However, in the case 12
of the 75/25 blend, the dispersed PLA component was visible in the MPE matrix, furthermore, 13
the structure of the 50/50 blend was close to co-continuous. The micrographs were taken from 14
the edge of the cross section, where both components could be found and the components were 15
not clearly layered. The outer surface of the samples was investigated by FTIR. In this analysis 16
the region between 800 and 1800 cm–1 is interesting, where the active ester and methyl groups 17
of PLA are located. A higher intensity in the –C=O ester carbonyl stretch region (~1720-1775 18
cm-1) was observed with the increase of the weight fraction of PLA. The peak maximum was a 19
12
wave number of 1752 cm-1; this peak is related to carboxylic end groups formed during the 1
hydrolysis of the ester bonds, which can indicate the degradation of PLA. This is supported by 2
Yarahmadi et al., 2016 and Badia et al., 2012, who observed the influence of multiple 3
processing of neat PLA and PLA blends on degradation. In Figure 8, at the same time, an 4
increase in signal intensity can be observed at the characteristic PLA peak at 1266 cm-1 (–CO 5
bend) and the peak of 1086 cm-1 with the increase of the weight fraction of PLA, which was 6
ascribed to symmetric stretching of the –C–O– band of ester groups. Figure 8 shows that the 7
symmetric deformation of the methyl –CH3 group occurred at 1381 cm–1 and 1266 cm–1, when 8
PLA content was increased from 10% to 50%. The changes in these peaks were also observed 9
by Ndazi and Karlsson, 2011, when they investigated the hydrolytic degradation of PLA and 10
by Vasile et al., 2017, when they studied PLA bionanocomposites for food packing. In Figure 11
8, the spectra demonstrated the presence of –CH3, –CH2 and C–H groups of highly aliphatic 12
components in the 2800-3000 cm-1 wavenumber range, due to the MPE component. A decrease 13
in signal intensity can be observed at the peak of 2848 cm-1 and the peak of 2916 cm-1 with the 14
increase of the weight fraction of PLA, which was ascribed to the stretching of the –C–H bond 15
of the alkanes. This is supported by Das and Tiwari, 2018 and Miandad et al., 2017, who 16
observed the pyrolysis of plastic waste.
17 18
a) b)
Figure 7. Changes in the morphology of MPE/PLA blends (a) 25 wt% PLA, b) 50 wt% PLA) 19
20
13 1
Figure 8. FTIR curves of the different MPE-PLA blends in the 500-3000 cm-1 wavenumber 2
range 3
4
We also studied the structure of the blends by SEM (Figure 9). The micrographs were taken 5
from cryo-fractured surfaces. In the case of the 98/2 blend, the dispersed PLA phase formed 6
only a few tenths of a micron droplets (droplet distribution) and then in the 90/10 blend the 7
divided droplets grew a few microns in size. In the blend that contained 25 wt% PLA, the 8
extended dispersed phases were deformed and the spherical droplets were converted to an 9
elongated fibrous shape. Finally, in the 50/50 blend a co-continuous phase formed. These results 10
are consistent with the results of light microscopy. In SEM micrographs, a typical morphology 11
of immiscible polymer blends could be seen if one of the components had a well-defined 12
spherical shape, very broad size distribution and a smooth fracture surface. These observations 13
are also confirmed by rheological and mechanical test results. Kim et al., 2004 had similar 14
results, when they investigated an 80/20 LDPE/PLA blend. Lu et al., 2016 also observed a co- 15
continuous phase morphology in PLA/HDPE blends (60/40 and 50/50) and a typical island-sea 16
type morphology in PLA/HDPE (40/60 and 20/80) blends.
17 18
14
a) b)
c) d)
e) f)
15
g) h)
i) j)
k) l)
Figure 9. Changes in the morphology of MPE/PLA blends (a-b) 0 wt% PLA, c-d) 2 wt%
1
PLA, e-f) 10 wt% PLA, g-h) 25 wt% PLA, i-j) 50 wt% PLA, k-l) 100 wt% PLA) 2
3
4. Conclusions 4
Nowadays, in the recycling of mixed polyethylene film waste, it is a considerable problem that 5
small amounts (0.5-1.5%) of bioplastic waste can contaminate synthetic polymer waste.
6
16
Developing a method of recycling this post-consumer waste of polymer blends is a major 1
challenge.
2
We investigated the rheological properties of regranulates and mechanical properties of 3
injection molded samples.
4
The viscosity curves of all the blends showed a decrease of viscosity when PLA was added.
5
The melt viscosities of MPE (100/0) and PLA (0/100) were similar, but the viscosities of the 6
blends did not change according to the linear rule of mixtures. Specific volume decreased with 7
the increase of the weight fraction of PLA, which is due to the higher density of PLA. The 8
stress-strain curves showed that MPE was flexible and PLA was rigid. Tensile strength 9
decreased when 10 and 25 wt% PLA was added, but doubled when 50 wt% PLA was added.
10
As the weight fraction of PLA was increased from 0% to 50%, the Young’s modulus increased 11
from 232 MPa to 1137 MPa, while elongation at break decreased from 99.53 % to 3.08 %. The 12
impact strength of the samples greatly decreased when 25 and 50 wt% PLA was added, but the 13
100/0, 98/2, 90/0 samples were not broken, even when a 22 J pendulum was used. In SEM 14
micrographs, we observed a co-continuous phase morphology in the 50/50 blend, and a typical 15
island-sea type morphology in the 98/2, 98/10 and 75/25 MPE/PLA blends. Therefore, the two 16
components are incompatible, at least in the concentrations investigated.
17
Based on the results, it seems that the blend containing 2% PLA can still be used for film 18
production, but the other blends are inappropriate for this purpose. The blends that contain more 19
than 2 % of PLA would probably result in a lot of faulty products, due to the immiscibility of 20
the components. These faulty products cannot be recycled, they just go to a landfill or are used 21
for energy production. The miscibility of the blends can probably be improved by adding 22
compatibilizers, therefore products with a simple geometry and low mechanical loads (e. g.
23
flowerpot, speed bump etc.) can be produced from these contaminated blends. The applicability 24
and cost-effectiveness of compatibilizers needs further research. Our opinion is that 25
biodegradable plastics should be collected into a separate waste stream and then recycled (if 26
possible) or composted.
27 28
Acknowledgements 29
This work was supported by the National Research, Development and Innovation Office (grant 30
number: NVKP_16-1-2016-0012). We are grateful for the assistance of Dr. Ferenc György 31
Ronkay and Béla Molnár in the preparation of the SEM micrographs and in the FTIR 32
measurements. The infrastructure of the research project was supported by Jász-Plasztik Ltd.
33 34
17 References
1
Abdolrasouli, M. H., Nazockdast, H., Sadeghi, G. M. M., Kaschta, J., 2015: Morphology 2
development, melt linear viscoelastic properties and crystallinity of 3
polylactide/polyethylene/organoclay blend nanocomposites. J. Appl. Polym. Sci. 132, 4
41300.
5
Andreoni, V., Saveyn, H. G. M., Eder, P., 2015: Polyethylene recycling: Waste policy scenario 6
analysis for the EU-27. J. Environ. Manage. 158, 103-110.
7
As’habi, L., Jafari, S. H., Khonakdar, H. A., Boldt, R., Wagenknecht, U., Heinrich, G., 2013:
8
Tuning the processability, morphology and biodegradability of clay incorporated 9
PLA/LLDPE blends via selective localization of nanoclay induced by melt mixing 10
sequence. Express Polym. Lett. 7, 21-39.
11
Badia, J.D., Strömberg, E., Karlsson, S., Ribes-Greus, A., 2012: Material valorisation of 12
amorphous polylactide. Influence of thermo-mechanical degradation on the morphology, 13
segmental dynamics, thermal and mechanical performance. Polym. Degrad. Stabil. 97, 14
670-678.
15
Biron, M., 2017: Industrial Applications of Renewable Plastics. Elsevier Ltd., Oxford.
16
Carreau, P. J., De Kee, D. C. R., Chhabra, R. P., 1997: Rheology of polymeric systems 17
principles and applications. Hanser Publishers, Munich.
18
Chow, W. S., Leu, Y. Y., Ishak, Z. A. M., 2016: Mechanical, thermal and morphological 19
properties of injection molded poly(lactic acid)/calcium carbonate nanocomposites.
20
Period. Polytech. Mech. Eng. 60, 15-20.
21
Cornell, D. D., 2007: Biopolymers in the Existing Postconsumer Plastics recycling Stream. J.
22
Polym. Environ. 15, 295-299.
23
Dahlbo, H., Poliakova, V., Mylläri, V., Sahimaa, O., Anderson, R., 2018: Recycling potential 24
of post-consumer plastic packaging waste in Finland. Waste Manage. 71, 52-61.
25
Das, P., Tiwari, P., 2018: Valorization of packaging plastic waste by slow pyrolysis. Resour.
26
Conserv. Recycl. 128, 69-77.
27
Emadian, S. M., Onay, T. T., Demirel, B., 2017: Biodegradation of bioplastics in natural 28
environments. Waste Manage. 59, 526-536.
29
Gent, M. R., Menendez, M., Torano, J., Diego I., 2009: Recycling of plastic waste by density 30
separation: prospects for optimization. Waste Manage. Res. 27, 175-187.
31
Gilbert, M., 2017: Brydson’s Plastics Materials. Elsevier Ltd., Oxford.
32
Graupner, N., Albrecht, K., Ziegmann, G., Enzler, H., Müssig, J., 2016: Influence of 33
reprocessing on fibre length distribution, tensile strength and impact strength of injection 34
18
moulded cellulose fibre-reinforced polylactide (PLA) composites. Express Polym. Lett.
1
10, 647-663.
2
Hamad, K., Kaseem, M., Deri, F., 2012: Poly(lactic acid)/low density polyethylene polymer 3
blends: preparation and characterization. Asia-Pac. J. Chem. Eng. 7, 310-316.
4
Harris, A.M., Lee, E.C., 2012: Durability of polylactide-based polymer blends for injection- 5
molded applications. J. Appl. Polym. Sci. 128, 2136-2144.
6
Imre, B., Renner, K., Pukánszky, B., 2014: Interactions, structure and properties in poly(lactic 7
acid)/thermoplastic polymer blends. Express Polym. Lett. 8, 2-14.
8
Jamshidi, K., Hyon, S.-H., Ikada Y., 1988: Thermal characterization of polylactides. Polymer.
9
29, 2229-2234.
10
Kim, Y.F., Choi, C.N., Kim, Y.D., Lee, K.Y., Lee, M.S., 2004: Compatibilization of immiscible 11
poly(l-lactide) and low density polyethylene blends. Fibers Polym. 5, 270–274.
12
La Mantia, F. P., 1996: Basic concepts on the recycling of homogeneous and heterogeneous 13
plastics, in: La Mantia, F. P. (Eds.), Recycling of PVC & mixed plastic waste. ChemTec 14
Publisher, Toronto, pp. 63-76.
15
La Mantia, F. P., Botta, L., Morreale, M., Scaffaro, R., 2012: Effect of small amounts of 16
poly(lactic acid) on the recycling of poly(ethylene terephthalate) bottles. Polym. Degrad.
17
Stabil. 97, 21-24.
18
Lu, X., Tang, L., Wang, L., Zhao, J., Li, D., Wu, Z., Xiao, P., 2016: Morphology and properties 19
of bio-based poly (lactic acid)/high-density polyethylene blends and their glass fiber 20
reinforced composites. Polym. Test. 54, 90–97.
21
Miandad, R., Barakat, M.A., Aburiazaiza, A.S., Rehan, M., Ismail, I.M.I., 2017: Effect of 22
plastic waste types on pyrolysis liquid oil. Int. Biodeterior. Biodegradation 119, 239-252.
23
Ndazi, B.S., Karlsson, S., 2011: Characterization of hydrolytic degradation of polylactic 24
acid/rice hulls composites in water at different temperatures. Express Polym. Lett. 5, 119- 25
131.
26
PlasticsEurope, 2016: Plastics – the Facts 2016. An analysis of European plastics production, 27
demand and waste data.
28
Plastics Recyclers Europe, 2017: Recycled film quality negatively affected by degradable 29
plastics from Southern Europe, Press release.
30
<http://www.plasticsrecyclers.eu/news/recycled-film-quality-negatively-affected- 31
degradable-plastics-southern-europe> (accessed 17.10.23).
32
19
Fortelný, I., Hlavatá, D., Horák, Z., Kolařík, J., Sikora, A., 2011: Blending, in: Seidel, A. (Eds.), 1
Processing and finishing of polymeric materials. John Wiley & Sons, Inc., Hoboken, pp.
2
86-144.
3
Sharma, R., Bansal, P. P., 2016: Use of different forms of waste plastic in concrete – a review.
4
J. Clean. Prod. 112, 473-482.
5
Soroudi, A., Jakubowicz, I., 2013: Recycling of bioplastics, their blends and biocomposites: A 6
review. Eur. Polym. J. 49, 2839-2858.
7
Tábi, T., Hajba, S., Kovács, J. G., 2016: Effect of crystalline forms (α’ and α) of poly(lactic 8
acid) on its mechanical, thermo-mechanical, heat deflection temperature and creep 9
properties. Eur. Polym. J. 82, 232-243.
10
Tábi, T., Sajó, I. E., Szabó, F., Luyt, A. S., Kovács, J. G., 2010: Crystalline structure of annealed 11
polylactic acid and its relation to processing. Express Polym. Lett. 4, 659-668.
12
Vasile, C., Râpă, M., Ștefan, M., Stan, M., Macavei, S., Darie-Nită, R.N., Barbu-Tudoran, L., 13
Vodnar, D.C., Popa, E.E., Ștefan, R., Borodi, G., Brebu, M., 2017. New PLA/ZnO: Cu/Ag 14
bionanocomposites for food packaging. Express Polym. Lett. 11, 531–544.
15
Yarahmadi, N., Jakubowicz, I., Enebro, J., 2016: Polylactic acid and its blends with petroleum- 16
based resins: Effects of reprocessing and recycling on properties. J. Appl. Polym. Sci.
17
133, 43916.
18