ContentslistsavailableatScienceDirect
Data in Brief
journalhomepage:www.elsevier.com/locate/dib
Data Article
Cell lines and clearing approaches: a
single-cell level 3D light-sheet fluorescence microscopy dataset of multicellular spheroids
Akos Diosdi
a,b, Dominik Hirling
a,c, Maria Kovacs
a, Timea Toth
a,b, Maria Harmati
a, Krisztian Koos
a, Krisztina Buzas
a,d,
Filippo Piccinini
e, Peter Horvath
a,f,g,∗aSynthetic and Systems Biology Unit, Biological Research Centre (BRC), H-6726 Szeged, Hungary
bDoctoral School of Biology, University of Szeged, H-6726 Szeged, Hungary
cDoctoral School of Computer Science, University of Szeged, H-6701 Szeged, Hungary
dDepartment of Immunology, Faculty of Medicine, Faculty of Science and Informatics, University of Szeged, H-6720 Szeged, Hungary
eIRCCS Istituto Romagnolo per lo Studio dei Tumori (IRST) "Dino Amadori", Via Piero Maroncelli 40, I-47014 Meldola (FC), Italy
fInstitute for Molecular Medicine Finland, University of Helsinki, FI-0 0 014 Helsinki, Finland
gSingle-Cell Technologies Ltd., H-6726 Szeged, Hungary
a rt i c l e i n f o
Article history:
Received 9 February 2021 Revised 25 February 2021 Accepted 16 April 2021 Available online 23 April 2021 Keywords:
Multicellular spheroids
Light-sheet fluorescence microscopy Carcinoma cell lines
Optical tissue clearing 3D image dataset
a b s t r a c t
Nowadays, three dimensional (3D) cell cultures arewidely usedinthebiologicallaboratoriesandseveralopticalclear- ingapproaches have been proposed to visualize individual cellsinthedeepestlayersofcancermulticellularspheroids.
However,definingthemostappropriateclearingapproachfor thedifferentcelllines isanopenissueduetothelackofa goldstandardquantitativemetric.Inthisarticle,wedescribe and share asingle-cellresolution 3D image datasetof hu- mancarcinomaspheroidsimagedusingalight-sheetfluores- cencemicroscope.Thedatasetcontains90multicellularcan- cerspheroidsderivedfrom3celllines(i.e.T-47D,5-8F,and Huh-7D12)and clearedwith5differentprotocols, precisely ClearT,ClearT2,CUBIC,ScaleA2,andSucrose.Toevaluateim- age quality and light penetration depth of the cleared 3D samples,allthespheroidshavebeenimagedunderthesame
DOI of original article: 10.1016/j.csbj.2021.01.040
∗ Corresponding author.
E-mail address: horvath.peter@brc.hu (P. Horvath).
https://doi.org/10.1016/j.dib.2021.107090
2352-3409/© 2021 The Author(s). Published by Elsevier Inc. This is an open access article under the CC BY license ( http://creativecommons.org/licenses/by/4.0/ )
experimentalconditions,labellingthenucleiwiththeDRAQ5 stain and using aLeica SP8 Digital LightSheetmicroscope.
Theclearingquality ofthisdatasetwasannotatedby10in- dependentexpertsandthusallowsmicroscopyuserstoqual- itativelycomparetheeffectsofdifferentopticalclearingpro- tocolsondifferentcelllines.Itisalsoanoptimaltestbedto quantitativelyassessdifferentcomputationalmetricsevaluat- ingtheimagequalityinthedeepestlayersofthespheroids.
© 2021TheAuthor(s).PublishedbyElsevierInc.
ThisisanopenaccessarticleundertheCCBYlicense (http://creativecommons.org/licenses/by/4.0/)
SpecificationsTable
Subject Biotechnology
Specific subject area
Light-sheet fluorescence images of cleared spheroids of different cell lines
Type of data Image
Table How data were
acquired
Leica True Confocal Scanning (TCS) SP8 Digital LightSheet (DLS) microscope.
Data format Raw
Parameters for data collection
Spheroids were created by SphericalPlate 5D (Table 1) and 5 optical clearing protocols were applied on the spheroids (Table 2). Each fluorescence image was acquired with a sCMOS DFC90 0 0 Leica camera, 2048 ×2048 pixel resolution with 0.14370117 μm pixel size. The gap between two subsequent images in each z-stack was 3.7 μm. The images were taken with 200 ms exposure time, 50% laser intensity at 638 nm.
Description of data collection
All the spheroids were fixed with 4% paraformaldehyde (PFA) and washed with Dulbecco’s Phosphate Buffered Saline (DPBS). Then the fixed spheroids were stained with DRAQ5 after the optical clearing treatments. During image acquisition, spheroids were embedded in 1%
agarose.
10 experts evaluated the acquired 3D dataset, and their average scores were visualized as a heatmap to represent the quality of the cleared spheroids.
Data source location
Institution: Biological Research Centre (BRC) City/Town/Region: Szeged
Country: Hungary Data
accessibility
Repository name: FigShare
Collection name: 2020_Diosdi_ClearedSpheroids
Data identification number: DOI: 10.6084/m9.figshare.12620078.v1 Direct URL to data: https://doi.org/10.6084/m9.figshare.12620078.v1 Related
research article
A. Diosdi, D. Hirling, M. Kovacs, T. Toth, M. Harmati, K. Koos, K. Buzas, F. Piccinini, P. Horvath, A quantitative metric for the comparative evaluation of optical clearing protocols for 3D multicellular spheroids, Computational and Structural Biotechnology Journal (CSBJ). 19 (2021) 1233-1243. https://doi.org/10.1016/j.csbj.2021.01.040 .
ValueoftheData
• The3Dlight-sheetdatasetofspheroidsisusefulforresearcherswhoareinterestedindefin- ingthemostappropriateclearingapproachforthecelllinetheyarestudying.
• The3Ddataisanoptimaltestbedtoquantitativelycomparedifferentcomputationalmetrics evaluating the image quality inthe deepestlayers ofspheroidsimaged usinga light-sheet fluorescencemicroscope.
• Thisimage collectionissuitableforvalidationofsegmentationapproachesand/or tocreate trainingsetsformachinelearninganddeep-learningapproaches.
1. DataDescription
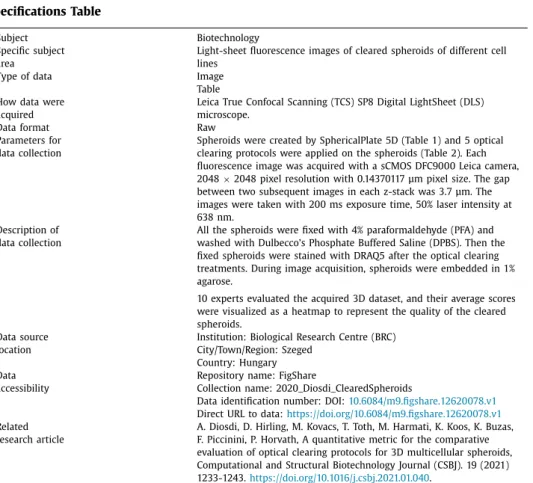
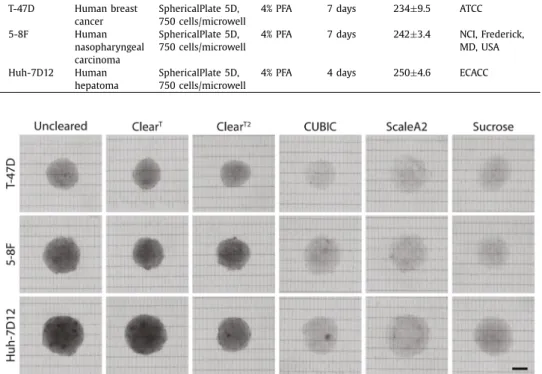
UsingT-47D,5-8F,andHuh-7D12humancarcinomacelllines(Table1),we producedmulti- cellularspheroidsofsimilarsizerange(around250μmindiameter)andacquirednucleilabeled fluorescenceimagesusingaLeicaTrueConfocalScanning(TCS)SP8DigitalLightSheet(DLS)mi- croscope.SpheroidsweregeneratedwiththeSphericalPlate5Dsystem(KugelmeiersLtd.,Erlen- bach,Switzerland).The incubationperiodsforthedifferentspheroidswere optimizedtoallow reachingasimilarsizerange.ThesourceofthecelllinesisdescribedinTable1(ATCC:American TypeCultureCollection,NCI:NationalCancerInstitute,ECACC:European CollectionofAuthen- ticated CellCultures). Toreduce the effect ofenvironmental factorsand tolimit transparency differences, spheroidswerepre-selectedbasedontheir sizeandshapefeatures.Thus, wewere ableto focusmainlyonthe effectsoflight scatteringandrefractiveindex, tofindthe optimal clearing protocol.Spheroidsderived fromthesecell lineswere characterized by varioustrans- parencyfeatures,withtheT-47Dcell lineformingalessdenseandsmallestspheroidsandthe Huh-7D12formingthemostdenseandbiggestspheroidsingeneral(Fig.1).Finally,toincrease thepenetrationdepthandimprovetheimage quality,we clearedall3typesofspheroidswith 5optical clearingprotocols,namelyClearT [1],ClearT2 [1],CUBIC [2],ScaleA2 [3],andSucrose [4](Table 2).Table 2 summarizesthe components ofthe solutions, thetime requiredforthe clearingprocess incaseofeachmethod,valuesofthe refractiveindex(RI),agarosevariations, thedetectionsolutionsforwaterimmersionobjective,andstainingvariations. InFig.1,we in- cludedbrightfieldimagesofthedifferentclearedspheroidslayingonglassslideswithagridof parallelblacklines.Thescalebarrepresents100μm.AllbrightfieldimagesinFig.1areincluded asrawfilesinSupplementaryFile1.
Table 1
Summary of spheroid generation.
Cell line Cell type
Spheroid
generation Fixation Incubation
Diameter
(μm) Source
T-47D Human breast
cancer SphericalPlate 5D,
750 cells/microwell 4% PFA 7 days 234 ±9.5 ATCC
5-8F Human
nasopharyngeal carcinoma
SphericalPlate 5D, 750 cells/microwell
4% PFA 7 days 242 ±3.4 NCI, Frederick, MD, USA Huh-7D12 Human
hepatoma
SphericalPlate 5D, 750 cells/microwell
4% PFA 4 days 250 ±4.6 ECACC
Fig. 1. Qualitative comparison of the cleared spheroids.
Table 2
Summary table of the optical clearing protocols.
Clearing
protocol Components
Time to
clear RI Size changes Agarose
Detection solution Staining Clear T Formamide 5 hours 1.44 Shrinkage Agarose
with dH 2O
dH 2O DRAQ5 in DPBS Clear T2 Formamide and
PEG
1 day 1.44 Shrinkage Agarose with dH 2O
dH 2O DRAQ5 in DPBS CUBIC 50% sucrose,
4 M urea and 0.1% TRITON X-100
1 day 1.48 Expansion 4 M urea
with dH 2O 2 M urea DRAQ5 in 4 M urea
ScaleA2 10% glycerol, 4 M urea and 0.1% TRITON X-100
2 weeks 1.38 Expansion 4 M urea with dH 2O
2 M urea DRAQ5 in 4 M urea
Sucrose 50% sucrose and 2% TRITON X-100
2 days 1.44 Minimal shrinkage
25% Sucrose with dH 2O
25%
Sucrose
DRAQ5 in DPBS
ThefluorescencemicroscopyimagesshowthattheT-47Dspheroidswerethemosttranspar- entevenatthebottom regionswithoutapplyingopticalclearingprotocols(Figs.2and3). The 5-8Fspheroidshadblurrycentralregionsandlessvisiblenucleiatthebottomcomparedtothe T-47Dspheroids. The Huh-7D12 cell lineformed the mostcompact spheroidsandresulted in poorimagequality.Therefore,theimagesofthe Huh-7D12spheroidswerethe mostblurryat themiddleregions,andnosinglenucleiinformationforthebottomregionscouldbeobserved.
Ingeneral, the first 50μm from the top ofthe spheroids yieldedimages with clearlyvisible nuclei,whilethecontoursofthenucleibecameincreasinglyblurryintheimagesofthemiddle parts(Fig.2).IntheimagestakenatthebottomregionsoftheHuh-7D12spheroids,cellnuclei were almost impossibleto be detected (Fig. 3). The whole 3D dataset contained fluorescence stackimagesof90spheroidsgeneratedusing3differentcelllines,5clearingprotocols,andan unclearedgroupreportedasacontrol(thenumberofspheroidswasn=5foreachgroup)[5].
InFigs. 2 and3, T-47D,5-8F,and Huh-7D12spheroids were stained withDRAQ5,and the imageswere takenusingaLeica SP8digitallight-sheet microscope.Forvisualization,herewe representthemiddle andthe bottomregions ofthe spheroidstreatedwith5 optical clearing protocols.The scale bars represent100 μm forthe whole spheroidsand 30μm forthe mag- nifiedimages.Imageswererandomly selectedfromthemiddleandthebottom regions ofthe spheroids.Thespecificz-planesarereportedasanadditionalinformationinSupplementaryFile 2and3.
Regardingthatcurrentlythereisnogoldstandardmetriccapableofassessingthedifferences betweenthedifferentprotocols,10microscopyexperts(researchersthathavebeendeeplywork- ingwithspheroidimagesandpossessatleast5yearsofexperienceinfluorescencemicroscopy) scored the light sheet-based fluorescence microscopy (LSFM) imagesof the spheroidscleared withtheoptical clearingmethods.Theexpertsevaluatedeachspheroid using3random differ- entimages comingfrom thetop, middle,andbottom regions, respectively. The scores ranged from1to5 (1forthe worst imagesand5forthe sharpestimages).The individual scoresfor eachimageareavailableinSupplementaryFile4.
Using the 3D dataset and the experts’ evaluation, we reviewed and compared seven no- reference sharpness metrics designed to quantitatively characterize the imaging quality of clearedspheroids.Duringtheexperiments,weevaluatedonspheroidstheefficiencyoftheclear- ingprotocolstoidentifythebestoneforseveralcelllines.Finally,wereleasedanopen-source user-friendlyImageJ/Fiji plugin withan implementationof all themetrics compared to assess thequalityofmicroscopyimages[6].
Fig. 2. Comparison of the optical clearing protocols on nuclei-labeled fluorescence images, showing the middle region of the spheroids.
2. ExperimentalDesign,MaterialsandMethods 2.1. Cellcultures
T47-D human breast cancer cell line (ATCC, USA) and Huh-7D12 human hepatocel- lular carcinoma cells (ECACC, UK) were maintained according to the ATCC and ECACC guidelines, respectively. 5-8F human nasopharyngeal carcinoma cell line was provided by Dr. Ji Ming Wang (National Cancer Institute-Frederick, Frederick, MD, USA) and cultured in DMEM-F12 (Lonza, Switzerland) supplemented by 10% FBS (EuroClone, Italy) and 1%
Penicillin-Streptomycin-Amphotericin B mixture (Lonza, Switzerland). All cultures were main- tainedinahumidifiedincubatorat37°Cand5%CO2.
Fig. 3. Comparison of the optical clearing protocols on nuclei-labeled fluorescence images, showing the bottom region of the spheroids.
2.2.Spheroidgenerationandfixation
Multicellular spheroids were created by SphericalPlate 5D (Kugelmeiers Ltd., Erlenbach, Switzerland)basedonthemanufacturer’sinstructions,and750cellswere seededperspheroid (Table 1). In order to create spheroids with nearly identical diameters, the incubation times were optimizedforeach cell line.The T47-D and5-8F cellswere incubatedfor7 days,while theHuh-7D12cellswere incubatedfor4 daystoreachsimilar diametersrangingfrom200 to 250μm. Duringthe incubation time the culture medium waschanged every other day. After thespheroidsdeveloped,theywerewashedtwicewithDPBSandfixedwith4%PFAforanhour atroom temperature. Finally, the spheroids were washed withDPBS twice, and the samples werestoredat4°CinDPBS.Spheroidswithsimilarsizeandshapeweremanuallyselectedand one spheroid was placed in each well on a 96-well culture platefor further optical clearing experiments.
2.3. Opticalclearingprotocolsandstaining
5opticalclearingmethodswerechosen,namelyClearT[1],ClearT2[1],CUBIC[2],ScaleA2[3], andSucrose [4]toincrease transparencyinside thespheroids(Table2). The originalprotocols were modifiedforCUBIC andSucrose inordertomake themcompatiblewithourmicroscope system. IncaseofCUBIC,theScaleCUBIC-2reagentwasused,but2,20,20’-nitrilotriethanol was neglected fromthe protocol. In the case of Sucrose, spheroids were incubated in 2% TRITON X-100for6hours,thentheTRITONX-100wasreplacedwithsucrosesolution.Thestartingsu- croseconcentration was10% which wasincreasedby10% per hour until50% wasreached. To determinetheoptimalincubationtime foreachclearingprotocol, thespheroidswereobserved usingastereomicroscopebeforeandatvarioustimepointsuntiltheendoftheclearingprocess.
The cleared spheroidswere stained withDRAQ5 (ThermoFisher, USA) to visualize cell nuclei.
DRAQ5wasdissolvedin4MureaforScaleA2andCUBIC,andinDPBSforSucrose,ClearT,and ClearT2 clearingprotocolsina dilutionof1:10000.Allthespheroidswerestained overnightat 4°Cthenwashedtwicewith4MureaorDPBS(dependingontheclearingmethod).5spheroids weretreatedwitheachclearingprotocol.
2.4. Samplepreparationforlight-sheetmicroscopy
ToanalyzethespheroidswithaLeicaDLSsystem,a CellviewTM cellculturedish35/10mm withaglassbottomandU-shapedglasscapillarieswereusedassampleholders.Beforemount- ingthesamples,spheroidsclearedwithClearT,ClearT2,andSucroseprotocolswerewashedwith DPBS,and4MureawasusedforthosetreatedwithScaleA2andCUBIC(Table2).Toassemble the sampleholder,the glasscapillarywasplaced inthemiddle ofthepetri dish first,andits position wassecuredwitha drop ofagaroseat both ends.Next,the capillarywasfilled with agarose,andthespheroidswerepositionedonthetopofthegel.After afewminutes,thecap- illarywascompletelyfilledupwithagarose.Forimageacquisition,theU-shapedglasscapillary wasremoved.Finally,thepetridisheswerefilledupwithdifferentimmersionmediacompatible withthecorrespondingclearingprotocols(Table2).ThesampleswerethenmountedontheDLS microscope,andfullz-stackswereacquiredtoimagethespheroidsfromthetoptothebottom.
2.5. Imageacquisition
Forthequantitativebrightfieldimages,weusedglassslideswithagridoflinesspacedhori- zontallyof65μmandverticallyof25μmcreatedbyaZeissPALMlasermicrodissectionmicro- scopewithultraviolet(337nm)N2lasermicrobeamsystem.Thenthebrightfieldimagesofthe clearedspheroidswereacquiredwitha2.5x/0.07objective,usingaLeicaSP8microscope.
Tocreatefluorescence images,we useda LeicaSP8 Digital LightSheetmicroscope. The flu- orescence DLS images were taken with 200 ms exposure time, 50% laser intensity at 638 nm (maximum laser intensity350 mW),anda 25x/0.95 detection objectivewasused forthe light-sheetimaging withthe2.5mm mirror device onthe objective.Eachfluorescence image was captured with the sCMOS DFC9000 Leica camera in 2048 × 2048 pixel resolution with 0.14370117μmpixelsize.Thegapbetweentheimagesineachz-stackwas3.7μm,allowingus tocapturemostofthenucleiatleasttwice.
2.6. Fluorescenceimageevaluation
To createa quality score foreach clearing protocol, 10 experts evaluated the fluorescence images. Each expertwho scored the images, has been deeply workingwith spheroid images andpossessesatleast5yearsofexperienceinfluorescencemicroscopy.Duringtheevaluation,
6imageswereshownatthesametimethatincludedspheroidstreatedwiththe5opticalclear- ing protocols anda control spheroid. Spheroids derived from differentcell lines were shown separatelyandeachspheroidwasdividedinto3regions(i.e.top,middle,bottom). Theexperts scoredeach image between1and5 (1 fortheworst and5 forthesharpestimages). Totalof 378imageswereevaluated,onlyoneimagefromeachregion.
EthicsStatement
Theauthorsdeclarenoethicalissues.
CRediTAuthorStatement
AkosDiosdi:Conceptualization,Visualization,Writing-Originaldraft;DominikHirling:For- malanalysis;MariaKovacs:Validation;TimeaToth: Validation;MariaHarmati:Investigation;
Krisztian Koos: Formal analysis; Krisztina Buzas: Resources, Writing - Reviewing & Editing;
FilippoPiccinini: Visualization, Writing -Reviewing &Editing; Peter Horvath:Conceptualiza- tion,Supervision,Writing-Reviewing&Editing,Fundingacquisition.
DeclarationofCompetingInterest
Theauthorsdeclarethattheyhavenoknowncompetingfinancialinterestsorpersonalrela- tionshipswhichhaveorcouldbeperceivedtohaveinfluencedtheworkreportedinthisarticle.
Acknowledgments
The authors would like to thank Ji Ming Wang (National Cancer Institute-Frederick, Fred- erick,MD,USA) forkindly providinguswith the5-8F cell line;Francesco Pampaloni (Goethe University,Frankfurt, Germany) for providing spheroid screening sampleholders; Dora Bokor, PharmD (BRC, Szeged, Hungary) for proofreading the manuscript. A.D., D.H., M.K., T.T., M.H., K.K.,B.K., andP.H. acknowledge support from the LENDULET-BIOMAGGrant (2018-342), from theEuropean RegionalDevelopment Funds(GINOP-2.3.2-15-2016-00006,GINOP-2.3.2-15-2016- 00026, GINOP-2.3.2-15-2016-00037), from the H2020-discovAIR (874656), from the H2020 ATTRACT-SpheroidPicker,andfromChanZuckerbergInitiative,SeedNetworksfortheHCA-DVP.
FP acknowledges support from the Union for International CancerControl (UICC) for a UICC Yamagiwa-Yoshida(YY)MemorialInternationalCancerStudyGrant(ref:UICC-YY/678329).
SupplementaryMaterials
Supplementary material associated withthis article can be found in the online version at doi:10.1016/j.dib.2021.107090.
References
[1] T. Kuwajima, A .A . Sitko, P. Bhansali, C. Jurgens, W. Guido, C. Mason, ClearT: a detergent- and solvent-free clearing method for neuronal and non-neuronal tissue, Development 140 (2013) 1364–1368, doi: 10.1242/dev.091844 . [2] E.A. Susaki, K. Tainaka, D. Perrin, F. Kishino, T. Tawara, T.M. Watanabe, C. Yokoyama, H. Onoe, M. Eguchi, S. Yamaguchi,
T. Abe, H. Kiyonari, Y. Shimizu, A. Miyawaki, H. Yokota, H.R. Ueda, Whole-brain imaging with single-cell resolution using chemical cocktails and computational analysis, Cell 157 (2014) 726–739, doi: 10.1016/j.cell.2014.03.042 .
[3] H. Hama, H. Kurokawa, H. Kawano, R. Ando, T. Shimogori, H. Noda, K. Fukami, A. Sakaue-Sawano, A. Miyawaki, Scale:
a chemical approach for fluorescence imaging and reconstruction of transparent mouse brain, Nature Neurosci. 14 (2011) 1481–1488, doi: 10.1038/nn.2928 .
[4] P.S. Tsai, J.P. Kaufhold, P. Blinder, B. Friedman, P.J. Drew, H.J. Karten, P.D. Lyden, D. Kleinfeld, Correlations of neuronal and microvascular densities in murine cortex revealed by direct counting and colocalization of nuclei and vessels, J.
Neurosci. 29 (2009), doi: 10.1523/JNEUROSCI.3287-09.2009 .
[5] F. Piccinini, A. Diosdi, 2020_Diosdi_ClearedSpheroids, (2020). doi: 10.6084/m9.figshare.c.5051999.v1 .
[6] A. Diosdi, D. Hirling, M. Kovacs, T. Toth, M. Harmati, K. Koos, K. Buzas, F. Piccinini, P. Horvath, A quantitative metric for the comparative evaluation of optical clearing protocols for 3D multicellular spheroids, Comput. Struct. Biotech- nol. J. (CSBJ) 19 (2021) 1233–1243, doi: 10.1016/j.csbj.2021.01.040 .