MOUSE ORGANOID CULTURE IS A SUITABLE MODEL TO STUDY 1
ESOPHAGEAL ION TRANSPORT MECHANISMS 2
3
Marietta Margaréta Korsós,1 Tamás Bellák,2,3 Eszter Becskeházi,1 Eleonóra Gál,1 Zoltán 4
Veréb,4 Péter Hegyi,5,6,7 Viktória Venglovecz1 5
6
1Department of Pharmacology and Pharmacotherapy, University of Szeged, Szeged, Hungary 7
2Department of Anatomy, Histology and Embryology, University of Szeged, Szeged, 8
Hungary 9
3BioTalentum Ltd., Gödöllő, Hungary 10
4Regenerative Medicine and Cellular Pharmacology Research Laboratory, Department of 11
Dermatology and Allergology, University of Szeged, Szeged, Hungary 12
5First Department of Medicine, University of Szeged, Szeged, Hungary 13
6Institute for Translational Medicine, Medical School, Szentágothai Research Centre, 14
University of Pécs, Pécs, Hungary 15
7Division of Gastroenterology, First Department of Medicine, Medical School, University of 16
Pécs, Pécs, Hungary 17
18
Running title: Ion transporters of esophageal organoids 19
20
Corresponding author:
21 22
Viktória Venglovecz, Ph.D.
23
Department of Pharmacology and Pharmacotherapy 24
University of Szeged 25
Szeged 26
HUNGARY 27
Telephone: +36 62 545 677 28
Fax: +36 62 545 680 29
Email: venglovecz.viktoria@med.u-szeged.hu 30
31
ABSTRACT 32
Altered esophageal ion transport mechanisms play a key role in inflammatory and cancerous 33
diseases of the esophagus, but epithelial ion processes have been less studied in the esophagus 34
because of the lack of a suitable experimental model. In this study, we generated 3D 35
esophageal organoids (EOs) from two different mouse strains and characterized the ion 36
transport processes of the EOs. EOs form a cell-filled structure with a diameter of 250–300 37
µm and generated from epithelial stem cells as shown by FACS analysis. Using conventional 38
PCR and immunostaining, the presence of Slc26a6 Cl−/HCO3− anion exchanger (AE), Na+/H+ 39
exchanger (NHE), Na+/HCO3- cotransporter (NBC), cystic fibrosis transmembrane 40
conductance regulator (CFTR) and anoctamin 1 Cl− channels were detected in EOs.
41
Microfluorimetric techniques revealed high NHE, AE, and NBC activities, whereas that of 42
CFTR was relatively low. In addition, inhibition of CFTR led to functional interactions 43
between the major acid–base transporters and CFTR. We conclude that EOs provide a 44
relevant and suitable model system for studying the ion transport mechanisms of esophageal 45
epithelial cells, and they can be also used as preclinical tools to assess the effectiveness of 46
novel therapeutic compounds in esophageal diseases associated with altered ion transport 47
processes.
48
Keywords: esophagus, ion transport, CFTR 49
50 51 52 53 54 55 56
57
INTRODUCTION 58
Research in recent years has increasingly highlighted the importance of ion transport 59
processes in inflammatory and cancerous diseases of the esophagus, as indicated by numerous 60
clinical studies (1, 2). These studies revealed altered expression of individual acid–base 61
transporters in Barrett’s esophagus, squamous cell carcinoma, and adenocarcinoma.
62
Conversely, the activity of these ion transporters has been less studied mainly because of the 63
lack of a suitable experimental model. Currently, a number of esophageal cell lines ranging 64
from normal cells to esophageal adenocarcinoma are available. Although cell lines are easy to 65
maintain, they have also limitations. Some cell lines are genetically modified to preserve their 66
proliferation or derived from pre-existing cancerous tissue, making them unsuitable for 67
studying physiological processes. In addition, because of their genetic instability, cells can 68
spontaneously differentiate into other cell types. The Ussing chamber is an old but commonly 69
used apparatus for studying esophageal permeability, and it is also suitable for investigating 70
transepithelial ion transport processes. However, application of this technique is often limited 71
by the condition, permeability, and short life span of the tissue, as well as reproducibility.
72
Organoids are three dimensional cell culture systems derived from progenitor or stem cells 73
that provide a near physiological in vitro model for studying epithelial function. The 74
discovery of organoids has greatly contributed to improved understanding of the ion transport 75
processes of individual organs such as the pancreas, colon, and airways (3-5). Esophageal 76
organoids (EOs) were first derived from mouse esophageal tissue by DeWard et al. (6). The 77
basal layer of the esophageal mucosa consists of a subpopulation of undifferentiated stem 78
cells with self-renewal ability and high proliferative capacity. After proliferation, cells 79
migrate toward the lumen while undergoing differentiation and replace the suprabasal cells 80
(7). Under appropriate culture conditions, organoids grown from stem cells develop a similar 81
structure as the organ of origin including the presence of several cell layers, but the difference 82
is that the outermost layer is composed of basal undifferentiated cells and the internal cell 83
mass is formed by differentiated keratinocytes (6).
84
Although EOs provide a suitable model for performing functional assays, the presence and 85
activity of ion transporters have not been investigated using EOs. In this study, we 86
characterized the activity and presence of ion transporters in mouse EOs for the first time. We 87
illustrated that mouse EOs express functionally active Na+/H+ exchanger (NHE), Na+/HCO3−
88
cotransporter (NBC), Cl−/HCO3− anion exchanger (AE), and cystic fibrosis transmembrane 89
conductance regulator (CFTR) Cl− channels. Our results provide insights into the ion transport 90
defects related to certain esophageal diseases and highlight a relevant experimental model 91
system for assessing the effects of drug molecules on esophageal ion transporters.
92 93 94 95 96 97 98 99 100 101 102 103 104 105 106
107
MATERIALS AND METHODS 108
Mice 109
Mice on the C57BL/6 and CD-1 backgrounds were bred and housed in standard plastic cages 110
under a 12-h:12-h light-dark cycle at room temperature (23 ± 1°C), and they were given free 111
access to standard laboratory chow and drinking solutions. Animal experiments were 112
conducted in accordance with the Guide for the Care and Use of Laboratory Animals (US 113
Department of Health and Human Services) and approved by the local Ethical Board of the 114
University of Szeged.
115
Solutions and chemicals 116
General laboratory chemicals were obtained from Sigma-Aldrich (Budapest, Hungary). 2,7- 117
Bis-(2-carboxyethyl)-5(6)-carboxyfluorescein acetoxymethyl ester (BCECF-AM) and N- 118
(ethoxycarbonylmethyl)-6-methoxyquinolinium bromide (MQAE) were purchased from 119
Molecular Probes Inc. (Eugene, OR, USA). BCECF-AM (2 µmol/L) and MQAE (5 µM) were 120
prepared in dimethyl sulfoxide (DMSO) and stored at −20°C. 4-Isopropyl-3- 121
methylsulfonylbenzoyl-guanidin methanesulfonate (HOE-642) was provided by Sanofi 122
Aventis (Frankfurt, Germany) and dissolved in DMSO. Nigericin (10 mM) was prepared in 123
ethanol and stored at −20°C. Forskolin was obtained from Tocris (Bristol, UK) and stored as a 124
250-mM stock solution in DMSO. The compositions of the solutions are presented in Table 1.
125
Standard HEPES-buffered solutions were gassed with 100% O2, and their pH was adjusted to 126
7.4 with NaOH. Standard HCO3−/CO2-buffered solutions were gassed with 95% O2/5% CO2
127
to adjust their pH to 7.4. All experiments were performed at 37°C.
128
Isolation of esophageal epithelial cells (EECs) 129
After removal and longitudinal opening of the esophagus, the tissue was placed into dispase 130
solution (2 U/mL) and incubated at 37°C for 40 min. Then, the mucosa was peeled from the 131
submucosa using forceps, and the mucosa was incubated at 37°C in 1× trypsin–EDTA 132
solution for 15 min, during which time the tissue was vortexed in every 2 min. To inactivate 133
trypsin, the trypsin–EDTA solution (with floating cells) was pipetted into soybean trypsin 134
inhibitor (STI) solution. The STI solution with the undigested tissue pieces was filter through 135
a 40-µm cell strainer. Cells were then centrifuged for 10 min at 2000 rpm, and the cell pellet 136
was resuspended in 300 µl of complete organoid culture medium.
137
Generation of EOs 138
The required volume of the cell suspension (7500 cells/well on a 24-well tissue culture plate) 139
was mixed with Matrigel® extracellular matrix at a 40:60 ratio and portioned in the wells, 140
followed by incubation at 37°C for 15 min to allow solidification of the gel. Complete 141
organoid culture medium was added to cover the Matrigel® and incubated at 37°C. After 3–4 142
days, organoid formation was visible. They reach their maximum size on day 8–12. The 143
growth medium consisted of Advanced Dulbecco’s modified Eagle’s medium/F12, 1× N2 and 144
1× B27 Supplements, 1× Glutamax (Gibco), 10 mM HEPES (Biosera), 2%
145
penicillin/streptomycin (Gibco), 1 mM N-acetyl-L-cysteine (Sigma), 100 ng/mL R-spondin 1, 146
100 ng/mL Noggin (both from Peprotech), 50 ng/mL mouse epidermal growth factor (R&D), 147
10 µM Y27632 ROCK-kinase inhibitor (ChemCruz), and 5 % WNT3A conditioned medium.
148
Wnt3A conditioned medium was prepared by collecting the supernatant from L-Wnt3A cells 149
(ATCC CRL-2647) according to the manufacturer’s protocol.
150
Flow cytometry 151
The expression of leucine-rich repeat-containing G-protein coupled receptor 5 (LGR5) and 152
cytokeratin 14 (CK14) was measured by flow cytometry on a FACSCalibur flow cytometer 153
(BD Biosciences Immunocytometry Systems, Franklin Lakes, NJ, USA) after staining the 154
cells on ice for 30 min with LGR5-PE (Origene, TA400001) and CK14-FITC (Novusbio, 155
NBP2-47720F) fluorochrome-conjugated antibodies and their matching isotype controls (PE 156
Mouse IgG1, κ Isotype Ctrl Antibody #400111 and FITC Mouse IgG3, κ Isotype Ctrl 157
Antibody #401317, both from Biolegend). The data were analyzed using Flowing Software 158
(Cell Imaging Core, Turku Center for Biotechnology, Finland), and the percentage of positive 159
cells was expressed as the mean ± SD.
160
Immunofluorescence staining and histology 161
Organoid cultures were fixed with 4% PFA in 0.1 mol/L phosphate buffer for 1 h at room 162
temperature and washed three times with PBS. The fixed samples were cryoprotected in 30%
163
sucrose solution (in PBS) containing 0.01% sodium azide at 4°C until embedding in Tissue- 164
Tek O.C.T. compound (Sakura). The 16-μm parallel sections were sectioned using a cryostat 165
(Leica CM 1850, Leica), mounted to gelatin-coated slides, and stored at −20°C until use.
166
After air-drying for 10 min, the sections were permeabilized with 0.1% Triton X-100 in PBS 167
and blocked for 1 h at 24°C with 3% BSA in PBS. The sections were then incubated with 168
primary antibodies (overnight, 4°C). On the next day, sections were washed in PBS three 169
times, and isotype-specific secondary antibodies were diluted in blocking buffer and applied 170
for 1 h at room temperature. The sections were washed three times with PBS and covered 171
using Vectashield® mounting medium containing DAPI (1.5 μg/mL, Vector Laboratories), 172
which labeled the nuclei of the cells. Immunoreactive sections were analyzed using a BX-41 173
epifluorescence microscope (Olympus) equipped with a DP-74 digital camera and CellSens 174
software (V1.18, Olympus) or using an Olympus Fv-10i-W compact confocal microscope 175
system (Olympus) with Fluoview Fv10i software (V2.1, Olympus). For hematoxylin and 176
eosin (HE) staining, sections were incubated with Mayer’s Hematoxylin solution (Sigma) for 177
5 min. Sections were washed with tap water and incubated into distilled water twice for 3 min 178
each. Sections were then incubated in 1% eosin solution in distilled water (Sigma) for 2 min.
179
Stained sections were dehydrating through 96 and 100% alcohol, cleared in xylene, and 180
mounted in DPX (Sigma). Microphotographs were taken using a DP-74 digital camera using a 181
light microscope (BX-41) and CellSens software (V1.18). All images were further processed 182
using the GNU Image Manipulation Program (GIMP 2.10.0) and NIH ImageJ analysis 183
software (imagej.nih.gov/ij). Details of the primary and secondary antibodies are presented in 184
Table 2.
185
Gene expression analysis using RT-PCR 186
Total RNA was isolated from the organoids using a NucleoSpin RNA Kit (Macherey–Nagel, 187
Düren, Germany). Two micrograms of RNA were reverse-transcribed using a High-Capacity 188
cDNA Reverse Transcription Kit (Applied Biosystems, Foster City, CA, USA). PCR was 189
performed using DreamTaq DNA polymerase in a final volume of 20 µL. All reactions were 190
performed under the following conditions: 94°C for 5 min; 30 cycles of 94°C for 30 s, 60°C 191
for 30 s, and 72°C for 1 min; and final elongation at 72°C for 10 min. The PCR products (10 192
μL) were separated by electrophoresis on a 2% agarose gel and visualized using an 193
AlphaImager EC Gel Documentation System. As a positive control, kidney cDNA was used 194
in the case of Slc9a1, Slc9a2, Slc26a6, Slc4a4, and CFTR, and pancreas cDNA was used in 195
the case of Slc26a3 and anoctamine-1 (ANO-1).Primer sequences are presented in Table 3.
196
Measurement of the intracellular Cl− concentration ([Cl−]i) and pH microfluorimetry 197
EOs were attached to a poly-L-lysine–coated cover slip (24 mm) forming the base of a 198
perfusion chamber and mounted on the stage of an inverted fluorescence microscope linked to 199
the Xcellence imaging system (Olympus). Organoids were then bathed with different 200
solutions at 37°C at a perfusion rate of 5–6 mL/min. Then, 6–12 region of interests (ROIs) 201
were examined in each experiments, and one measurement was obtained per second. [Cl−]i
202
was estimated using the fluorescent dye MQAE. Specifically, organoids were incubated with 203
MQAE (5 μM) for 2–3 h at 37°C, and changes in [Cl−]i were determined by exciting the cells 204
at 340 nm with emitted light monitored at 380 nm. Fluorescence signals were normalized to 205
the initial fluorescence intensity (F/F0) and expressed as relative fluorescence. To determine 206
intracellular pH (pHi), cells were loaded with the pH-sensitive fluorescent dye BCECF-AM (2 207
μM, 30 min, 37°C) and excited at 490 and 440 nm. The 490/440 fluorescence emission ratio 208
was measured at 535 nm. The calibration of the fluorescence emission ratio to pHi was 209
performed using the high-K+/nigericin technique, as previously described (8, 9).
210
Measurement of the activity of the acid–base transporters 211
To estimate the activity of NHE and NBC, the NH4Cl prepulse technique was used. Briefly, 212
exposure of EOs to 20 mM NH4Cl for 3 min induced an immediate rise in pHi because of the 213
rapid entry of lipophilic basic NH3 into the cells. After the removal of NH4Cl, pHi rapidly 214
decreased. This acidification is caused by the dissociation of intracellular NH4+ to H+ and 215
NH3, followed by the diffusion of NH3 from the cells. In standard HEPES-buffered solution, 216
the initial rate of pHi (ΔpH/Δt) recovery from the acid load (over the first 60 s) reflects the 217
activities of NHEs, whereas in HCO3−/CO2-buffered solutions, the rate represents the 218
activities of both NHE and NBC (10).
219
Two independent methods were used to estimate AE activity. Using the NH4Cl 220
prepulse technique, the initial rate of pHi recovery from alkalosis in HCO3−/CO2-buffered 221
solutions was analyzed (10). Previous data indicated that under these conditions, the recovery 222
over the first 30 s reflects the activity of AE (10). The Cl− withdrawal technique was also 223
applied, in which removal of Cl− from the external solution causes immediate and reversible 224
alkalization of the pHi because of the reverse operation of AE under these conditions.
225
Previous data illustrated that the initial rate of alkalization over the first 60 s reflects the 226
activity of AE (11).
227
Statistical analysis 228
Results are expressed as the mean ± SD. Statistical analyses were performed using analysis of 229
variance. p ≤ 0.05 was accepted as significant.
230 231
RESULTS 232
Characterization of EO cultures 233
Isolated EECs were plated in Matrigel supplemented with organoid culture medium at a final 234
concentration of 40%. On the 3rd day after plating, organoid formation was observed, and 235
therefore, we assessed organoid growth starting from day 3 (Fig. 1A). The size of the 236
organoids increased steadily in the following days, peaking between days 7 and 9. Organoids 237
between 50 and 150 µm in size were used for our experiments. HE staining of the organoids 238
illustrated that cells are located in several layers inside the organoids, matching the structure 239
of normal esophageal tissue (Fig. 1B). The inner cell mass consisted of differentiated cells 240
that move from the periphery to the inside of the organoids during their maturation. In 241
addition, the centers of some organoids were empty, or they contained keratinized materials 242
produced by the cells. To verify that organoids are generated from stem cells, we used the 243
stem cell marker LGR5. Immunofluorescence staining revealed strong LGR5 expression in 244
both C57BL/6 and CD-1 organoids (Fig. 1C), and FACS analysis demonstrated that 42.70 ± 245
7.27% of the isolated C57BL/6 EECs and 46.46 ± 7.81% of the isolated CD-1 EECs were 246
LGR5-positive (Fig. 2A and B). In the next step, we verified that the organoids were derived 247
from single EECs. CK14 is a cytoplasmic keratin expressed in the basal SECs (12, 13). As 248
presented on Fig. 1C, the outer cell layer of the organoids was CK14-positive, indicating that 249
the organoids originate from the mucosa and display a morphologically similar structure as 250
normal esophageal tissue. FACS analysis indicated that 45.29 ± 9.25% of the isolated 251
C57BL/6 EECs and 55.32 ± 7.80% of the isolated CD-1 EECs were CK14-positive (Fig. 2A 252
and B). Interestingly, there was a slight difference in the double-positive (LGR5 and CK14) 253
fraction. The proportion of double-positive cells was higher in CD-1 mouse organoids (35.37 254
± 1.24%) than in C57BL/6 mouse organoids (19.34 ± 2.03%, Fig. 2C).
255 256
mRNA and protein expression of ion transporters in EOs 257
The mRNA expression of ion transporters was investigated using conventional RT-PCR. We 258
revealed the presence of Slc9A1 (NHE-1), Slc9A2 (NHE-2), Slc26a6 (PAT1), CFTR, Scl4a4 259
(NBCe1B), and ANO1 in both the C57BL/6 and CD-1 organoids (Fig. 3A). The presence of 260
these transporters was also confirmed at the protein level using immunohistochemistry (Fig.
261
3B and C). By contrast, the Slc26a3 (DRA) transporter could not be detected at either the 262
mRNA or protein level. Because the CFTR Cl− channel and Slc26a6 interact with each other 263
in several secretory epithelia (14), we examined the colocalization of these two transporters 264
on the organoids. CFTR and Slc26a6 exhibited diffuse staining throughout cells without 265
special localization to the apical or basal membrane. Interestingly, Slc26a6 staining was more 266
detectable in cells on the periphery, whereas in the case of CFTR, central cells also displayed 267
positive staining.
268
Resting pHi of EOs and determination of buffering capacity 269
To investigate the pH regulatory mechanisms of EO cultures, we initially determined the 270
resting pHi of the cells. EOs were exposed to standard HEPES solution (pH 7.4), followed by 271
a 5-min exposure to a high-K+/nigericin–HEPES solution at pH 7.2, 7.4, and 7.6 (Fig. 4A).
272
The resting pHi of the organoids was determined using the classical linear model (8, 9). The 273
resting pHi of C57BL/6 organoids was 7.61 ± 0.03, whereas that of CD-1 organoids was 7.58 274
± 0.03. The total buffering capacity (βtotal) of EOs was estimated using the NH4+ prepulse 275
technique, as previously described (Fig. 4B) (10, 15). Briefly, organoids were exposed to 276
various concentrations of NH4Cl in nominally Na+- and HCO3−-free solutions, and βtotal of the 277
cells was calculated using the following equation: βtotal = βi + βHCO3− = βi + 2.3 × [HCO3−]i, 278
where βi describes the ability of intrinsic cellular components to respond to buffer changes of 279
pHi (calculated by the Henderson–Hasselbach equation) and βHCO3− is the buffering capacity 280
of the HCO3−/CO2 system. The measured rates of pHi change (∆pH/∆t) were converted to 281
transmembrane base flux J(B−) using the following equation: J(B−) = ∆pH/∆t × βtotal. βtotal at 282
the initial pHi was used to calculate J(B−). We denoted base influx as J(B) and base efflux 283
(secretion) as −J(B−).
284
Activity of NHE 285
NHE is an integral plasma membrane protein that mediates the electroneutral exchange of 286
extracellular Na+ and intracellular H+, thereby playing an important role in the alkalization of 287
cells. NHE activity was investigated by removing extracellular Na+ from the external solution.
288
As presented in Figure 5A, Na+ removal induced a sharp decrease in pHi, suggesting that EOs 289
express functionally active NHE. There was no significant difference in the rate (-J(B-)) and 290
extent (ΔpHmax) of the pHi decrease between the two mouse strains (Fig. 5B and C). The 291
presence of NHE was also confirmed using the ammonium prepulse technique (Fig. 5D).
292
Organoids were exposed to 20 mM NH4Cl (3 min) in standard HEPES-buffered solution, 293
which induced a high degree of intracellular alkalization because of the rapid influx of NH3
294
into cells. After removing NH4Cl from the bath, pHi dramatically decreased and then returned 295
to baseline. Under these conditions, recovery from acidosis reflects the activity of NHE. In the 296
absence of Na+, recovery from acidosis was negligible, indicating that in the absence of 297
HCO3−, NHE is mainly responsible for the alkalization of cells (Fig. 5D and E). The NHE 298
gene family contains several isoforms (NHE-1–9) with different functions and expression 299
patterns (16). To identify the most active isoform on organoids, the NHE isoform specific 300
inhibitor HOE-642 was used. This inhibitor blocks NHE-1 and NHE-2 isoforms in a 301
concentration-dependent manner. At a concentration of 1 µM, only the NHE-1 isoform is 302
inhibited, whereas 50 µM HOE-642 inhibits both isoforms (2, 17). We chose this inhibitor 303
because our previous studies on human esophageal cell lines indicated that these two isoforms 304
are responsible for the majority of NHE activity (2). Organoids were acid-loaded with 20 mM 305
NH4Cl followed by a 3-min incubation in Na+-free HEPES solution. In the absence of Na+, 306
the NHE is blocked, and thus, pHi is not regenerated. Upon the re-administration of 307
extracellular Na+, NHE regained its function, and its activity could be estimated from the 308
initial rate of pHi recovery over the first 60 s. As presented in Fig. 6A, 1 µM HOE-642 309
decreased pHi recovery by 87.81 ± 1.17% in C57BL/6 organoids and 82.37 ± 7.32% in CD-1 310
organoids, whereas the administration of 50 µM HOE-642 resulted in further decreases (97.54 311
± 0.52% in C57BL/6 organoids and 92.91 ± 3.76% in CD-1 organoids, Fig. 6B). These data 312
indicate that although NHE-1 has higher activity, NHE-2 is also active on organoids. The fact 313
that some activity remained even in the presence of 50 μM HOE-642 suggests the presence of 314
other Na+-dependent acid-extruding mechanisms.
315
Activity of NBC 316
NBC is an electrogenic transporter that mainly localizes to the basolateral membrane in most 317
epithelia, in which it mediates the cotransport of Na+ and HCO3− into cells. Inside cells, 318
HCO3− binds H+ and causes intracellular alkalization. Therefore, in standard HCO3−/CO2- 319
buffered external solution, both NHE and NBC fight against cellular acidosis. NBC activity 320
was investigated by the NH4Cl prepulse technique (Fig. 7A). Administration of HCO3−/CO2
321
rapidly and greatly decreased pHi because of the quick diffusion of CO2 into the cytoplasm.
322
Significant pHi recovery was observed after acidification, suggesting the important role of 323
HCO3− efflux into EOs through NBC (Fig. 7A). After the NH4Cl pulse, recovery from 324
alkalosis was more rapid than observed in the presence of standard HEPES-buffered solution, 325
indicating that in addition to NHE, NBC is also active in the presence of HCO3−. Removal of 326
Na+ from the external solution almost completely abolished the recovery from acidosis. To 327
determine NBC activity, NHE function was blocked by the non-specific NHE inhibitor 328
amiloride, which was added 1 min before and during the re-administration of Na+. As 329
presented in Fig. 7A and B, the recovery from acidosis was decreased by 61.88 ± 5.3% in 330
C57BL/6 organoids and 62.18 ± 7.3% in CD-1 organoids in the presence of amiloride, 331
indicating that NHE is responsible for much of the recovery from acidosis, but there is also 332
functionally active NBC on the cells. Interestingly, we found a significant difference in 333
recovery following Na+ deprivation between the C57BL/6 and CD-1 organoids, suggesting 334
greater NBC activity in C57BL/6 mice.
335
Activity of the Cl−/HCO3− exchanger 336
The HCO3− transporter family includes several transport proteins, of which Slc26 proteins 337
functions as an electroneutral Cl−/HCO3− exchanger. Among the Slc26 exchangers, the 338
presence of Slc26a6 (PAT1) was detected at both the mRNA and protein level in the C57BL/6 339
and CD-1 organoids. Slc26a6 mediates Cl− and HCO3− exchange with a 1Cl−/2HCO3−
340
stoichiometry. To determine whether this Cl−/HCO3− exchanger is functionally active on the 341
organoids, the Cl− removal technique was used (Fig. 8A–C). In the presence of external Cl−, 342
Slc26a6 mediates the efflux of HCO3− and the uptake of Cl−, therefore playing role in the 343
acidification of cells. Removal of Cl− from standard HCO3−/CO2-buffered solution induced 344
strong alkalization because of the reverse mode of the exchanger (Fig. 8A). By contrast, in the 345
absence of HCO3−, Cl− removal caused minimal, reversible alkalization (Fig. 8B). The 346
presence of functionally active AE has been also confirmed by the NH4Cl prepulse technique 347
(Fig. 8D and E). We previously illustrated that in the presence of HCO3−, the initial rate of 348
recovery (30 s) from alkalosis reflects the activity of Cl−/HCO3− exchangers (11, 18). As 349
presented in Fig. 8E, there was no significant difference in AE activity between the two 350
mouse organoids.
351
Activity of CFTR 352
The CFTR Cl− channel, which is present on most epithelial cells, mediates the efflux of Cl− 353
from cells. The presence of this ion channel has been detected at both the mRNA and protein 354
level in organoids; therefore, we also investigated its activity using the Cl− sensitive 355
fluorescent dye MQAE and CFTR activator forskolin. As presented in Fig. 9A and B, the 356
administration of 10 µM forskolin caused a small increase in initial rate of Cl− efflux (19.61 ± 357
4.52% in C57BL/6 organoids and 21.83 ± 9.72% in CD-1 organoids), and Cl− loss reached 358
steady state after approximately 10 min. The effect of 5 μM forskolin was negligible. To 359
investigate whether there is a functional relationship between CFTR and the acid–base 360
transporters, the activity of the transporters was examined in the presence of the CFTR 361
inhibitor CFTRinh-172 (10 µM, Fig. 9C–E). Using the NH4Cl prepulse technique, we found 362
that the activity of AE was significantly decreased by CFTR inhibition (18.60 ± 3.34% in 363
C57BL/6 organoids and 35.71 ± 11.77% in CD-1 organoids, Fig. 9D), whereas recovery from 364
acidosis was only inhibited in C57BL/6 organoids (Fig. 9E).
365 366
CONCLUSION 367
368
The present study is the first to describe and functionally characterize the most common ion 369
transport processes on EOs using two frequently used laboratory mouse strains (C57BL/6 and 370
CD-1). Regulation of pHi in epithelial cells is crucial, as most biological processes are 371
affected by changes in pH. Ion transporters are involved in the regulation of pHi and 372
extracellular pH. Specifically, the transporters are polarized on epithelial cells, ensuring the 373
unidirectional movement of substances. Esophageal ion transport processes were most 374
intensively studied in the 1990s, mostly using primary tissue. These studies investigated the 375
basic acid–base transporters and characterized the effect of acid and bile on the function of 376
these transporters (1). Although extremely important information was obtained from these 377
investigations, most of the findings are obsolete, and the primary tissues used in these studies 378
did not permit the specific investigation of a given transporter. The development of organoid 379
cultures was a significant breakthrough in the examination of individual organs and tissues.
380
Their biggest advantages include their easy maintenance, suitability for longer studies, and 381
recapitulation of physiological conditions. In addition, organoids can be frozen and passaged, 382
allowing the function of different transporters to be compared even on the same genetic 383
background.
384
To investigate the ion transport mechanisms of EOs, we initially determined the resting pH 385
and total buffering capacity of the cells. We found that the starting pH of the organoids was 386
nearly 7.6 in CD-1 organoids and slightly higher than 7.6 in C57BL/6 organoids. This 387
unusually high initial pH has also been detected in human and rabbit esophageal cells (19, 388
20).The cause of the high resting pHi is not fully known. Presumably, this finding can be 389
explained by the excessive activity of the alkalizing transporters that act against acidosis. Our 390
results demonstrated the presence of a Na+-dependent H+ efflux mechanism on EOs, probably 391
NHE, which was functionally active. The presence of NHE-1 on rat and rabbit EECs was 392
previously demonstrated (21). By contrast, NHE-1 and NHE-2 expression is extremely low in 393
normal human esophagus but strong in Barrett’s and esophageal cancer (2, 22, 23). HOE-642 394
largely inhibited NHE function, suggesting that more than 90% of functionally active NHEs 395
in EOs are NHE-1 and NHE-2. Concerning the residual activity, other NHE isoforms or a 396
proton pump is presumably responsible. One possible candidate is NHE3, which was 397
previously detected on human esophageal cells, in which it participate in the formation of 398
dilated intercellular spaces, and the expression of this isoform increases with the severity of 399
GERD (24, 25). Immunolocalization of NHE-1 and NHE-2 demonstrated that NHE-1 400
expression was mostly observed in the periphery, whereas NHE-2 staining was more 401
pronounced in the inner cell layers. The different localization of NHE-1 and NHE-2 can be 402
explained by the fact that organoids are composed of different types of cells. The outermost 403
cell layer of the organoids consists of basal cells, whereas the inner cell layers are composed 404
of differentiated keratinocytes. This indicates that NHE-1 is mainly expressed in basal cells, 405
whereas NHE-2 is expressed in keratinocytes. Our finding that NHE-1 is mainly located in 406
basal cells is consistent with the observation that NHE-1 expression is very extremely in 407
human SECs (2, 22, 23).
408
NBC is another transporter that can protect cells from acidosis. We revealed the presence of 409
NBC in EOs, and it plays an important role in pHi regulation. CO2-induced acidosis was 410
almost completely reversed, which can be explained by the influx of HCO3− through NBC.
411
Furthermore, we found a significant difference in recovery from acidosis in the presence and 412
absence of HCO3−, and fairly significant recovery was observed in the presence of amiloride.
413
Taken together, these data strongly indicate that EOs express functionally active NBC. The 414
presence of NBC has to date been identified in submucosal glands, in which it plays role in 415
HCO3− secretion (26, 27). The presence of NBC has also been demonstrated in human EECs, 416
and similarly as NHE, its expression is increased in Barrett’s carcinoma (2). The role of NBC 417
in SECs is not entirely clear, but presumably, it might play a central role in the regulation of 418
pHi and transcellular transport of HCO3−. Because NBC mediates HCO3− uptake, its present 419
also presupposes the presence of AE on these cells. Using a microfluorimetric technique, we 420
detected a Cl−-dependent HCO3− efflux mechanism on EOs. Removal of Cl− from the external 421
solution in the presence of HCO3− induced strong alkalosis via the reverse mode of the 422
Cl−/HCO3− exchanger. In addition, the presence of HCO3− significantly increased the rate of 423
recovery from alkalosis. Previous studies by our laboratory demonstrated that recovery from 424
alkalosis in the presence of HCO3− is the result of HCO3− efflux through the Cl−/HCO3−
425
exchanger (11, 18). Among the Cl−/HCO3− exchangers, the presence of Na+-dependent and 426
Na+-independent transporters was demonstrated on rabbit SECs (28). In addition, the presence 427
of Slc26a6 was detected on SMGs, thereby mediating HCO3− secretion together with NBC 428
and CFTR (26, 27). In EOs, strong Slc26a6 expression was found at both the mRNA and 429
protein level, whereas Slc26a3 expression was weak and non-specific. The Slc26a6 430
transporter is primarily located on the apical membrane of secretory epithelial cells, in which 431
it plays an essential role in HCO3− secretion (29). Because the esophageal epithelium is not a 432
typical secretory epithelium, the presence of this transporter on EOs is unusual. In addition, 433
Slc26a6 expression was more pronounced at the periphery, indicating that basal cells have 434
some HCO3−-secreting capacity. In many secretory epithelia, Slc26 AEs interact with the 435
CFTR Cl− channel in the regulation of HCO3− secretion (30, 31). To investigate the presence 436
of CFTR and its coexpression with the Slc26a6 transporter, we investigated the colocalization 437
of these transporters using immunostaining. As an interesting finding of our study, the CFTR 438
Cl− channel is expressed on EOs. Immunolocalization illustrated that both peripheral and 439
central cells highly express CFTR. Costaining of CFTR and Slc26a6 revealed some 440
colocalization, mainly in cells on the periphery, indicating that the two transporters interact 441
with each other. To investigate the functional interaction between CFTR and Slc26a6, the 442
microfluorimetric technique was used. The specific CFTR activator forskolin concentration- 443
dependently increased the activity of CFTR, although the response to forskolin was relatively 444
low even in the presence of supramaximal concentrations, indicating that CFTR channel 445
activity is lower than usually observed for secretory epithelia, such as those in the pancreas or 446
lungs (32). The presence of the CFTR inhibitor CFTRinh-172 decreased the rate of recovery 447
from alkalosis in both C57BL/6 and CD-1 organoids, indicating that the channel interacts 448
with the AE. Interestingly, we found that CFTR inhibition also significantly reduced recovery 449
from acidosis in C57BL/6 organoids. Because both NBC and NHE are involved in recovery 450
from acidosis in the presence of HCO3−, CFTR interacts with one of these transporters, but 451
this type of interaction was not previously described. CFTR has been detected in the ductal 452
cells of porcine submucosal glands, in which it localizes primarily to the apical membrane and 453
plays an important role in ductal HCO3− secretion (26). It has also been detected in SECs, in 454
which its presence is restricted to the basal cell layer (33). In SECs, CFTR mediates Cl− 455
transport together with the voltage-gated Cl− channel ClC-2, which plays a pivotal role in 456
protection against acid-induced injury, as demonstrated with the ClC-2 agonist lubiprostone 457
(33). Because lubiprostone has been illustrated to activate CFTR (34, 35), the role of CFTR in 458
this process has been postulated. The protective role of CFTR was also demonstrated in BE 459
and esophageal cancer (36-40). These experiments demonstrated that CFTR plays a protective 460
role against esophageal cancer, and overexpression of this channel is associated with good 461
prognosis in squamous cell carcinoma. We also revealed the presence of the Ca2+-activated 462
Cl− channel ANO1 or TMEM16A in EOs. One study examined the presence of ANO1 in the 463
esophageal epithelium and indicated that its expression is increased in eosinophilic 464
esophagitis and correlated with the severity of the disease. Furthermore, ANO1 has been 465
reported to play central roles in the proliferation of basal zone hyperplasia via an IL-13–
466
mediated pathway (41).
467
In this study, we uncovered for the first time the presence of the major epithelial ion 468
transporters in EOs. We demonstrated that NHE, NBC, AE, and the CFTR Cl− channel are 469
active in EOs, and there was no significant difference in the expression and activity of NHE, 470
AE, and CFTR between the two mouse strains. We can conclude that the EOs comprise a 471
suitable experimental system to investigate ion transport processes, and therefore, they can be 472
used to study the role of ion transporters in different esophageal diseases or test drug 473
molecules that affect the function of ion transporters.
474 475
FUNDING 476
477
This study was supported by the National Research, Development and Innovation Office 478
(FK123982), the National Research, Development and Innovation Office, by the Ministry of 479
Human Capacities (EFOP 3.6.2-16-2017-00006).
480 481
CONFLICTS OF INTEREST 482
483
The authors hereby declare that there are no conflicts of interests to disclose.
484 485
AUTHORS CONTRIBUTION STATEMENT 486
MMK performed PCR and microfluorimetric measurements and analysed the data. TB did the 487
immunostainings. EB participated in the culturing and microfluorimetric measurements of 488
organoids. EG and ZV carried out FACS experiments and analysis. PH contributed to the 489
interpretation of the results. VV supervised the project and drafted the manuscript. All authors 490
discussed the results and contributed to the final manuscript. All authors approved the final 491
version of the manuscript, agreed to be accountable for all aspects of the work in ensuring that 492
questions related to the accuracy or integrity of any part of the work are appropriately 493
investigated and resolved; and all persons designated as authors qualify for authorship, and all 494
those who qualify for authorship are listed.
495 496 497 498 499 500
FIGURE LEGENDS 501
502
Fig. 1 Characterization of esophageal organoids (EOs). (A) Representative bright field 503
images of EOs grown for 9 days from freshly isolated esophageal mucosa. Images were taken 504
using an Olympus IX71 inverted microscope. The scale bar represents 100 µm. (B) 505
Hematoxylin and eosin staining of EOs developed from C57BL/6 and CD-1 mouse 506
esophageal tissue. The scale bar represents 100 µm (upper line) and 50 µm (bottom line), 507
respectively. (C) Confocal images of EOs stained for leucine-rich repeat-containing G-protein 508
coupled receptor 5 (LGR5, green), cytokeratin 14 (CK14, red), and DAPI (blue). The scale 509
bar represents 100 µm (main photo) and 50 µm (inset photo), respectively.
510
Fig. 2 Flow cytometry analysis of leucine-rich repeat-containing G-protein coupled 511
receptor 5 (LGR5) and cytokeratin 14 (CK14) expression. (A) Percentage of LGR5- and 512
CK14-positive cells in the cell suspension of esophageal mucosa obtained from CD-1 and 513
C57BL/6 mice. (B) Representative histograms of the FACS analysis with the respective 514
isotype controls (gray color). (C) Representative dot plots present CK14 and LGR5 double- 515
positive cells. n = 3 516
Fig. 3 Expression of ion transporters in esophageal organoids (EOs). (A) Mature EOs 517
were collected 9 days after plating, and RNA was prepared from the organoids. Gene 518
expression of ion transporters was investigated with traditional RT-PCR analysis. (B) 519
Immunostaining of EOs for Slc9a1 (first line), Slc9a2 (second line), Slc26a3 (third line), 520
Slc4a4 (fourth line), and ANO1 (fifth line). The scale bar represents 100 µm (main photo) and 521
50 µm (inset photo), respectively.
522
(C) Costaining of Slc26a6 (red) and CFTR (green). The scale bar represents 50 µm (upper 523
line), 25 µm (middle line) and 10 µm (bottom line), for both mice strains.
524
Fig. 4 Initial pH and buffering capacity of esophageal organoids. (A) Organoids were 525
exposed to nigericin/high-K+–HEPES solution at pH 7.2, 7.4, and 7.6. The resting 526
intracellular pH (pHi) was calculated from this three-point calibration using the classic linear 527
model. (B) Organoids were exposed to various concentrations of NH4Cl in nominally Na+- 528
and HCO3--free solutions, and the total buffering capacity (βtotal) of the cells was calculated 529
using the following equation: βtotal = βi + βHCO3− = βi + 2.3 × [HCO3−]i, where βi refers to the 530
ability of intrinsic cellular components to buffer changes of pHi and βHCO3− is the buffering 531
capacity of the HCO3−/CO2 system. The black line shows the organoid response isolated from 532
C57BL/6 mice, whereas the red line shows the organoid response isolated from CD-1 mice. n 533
= 17-19 534
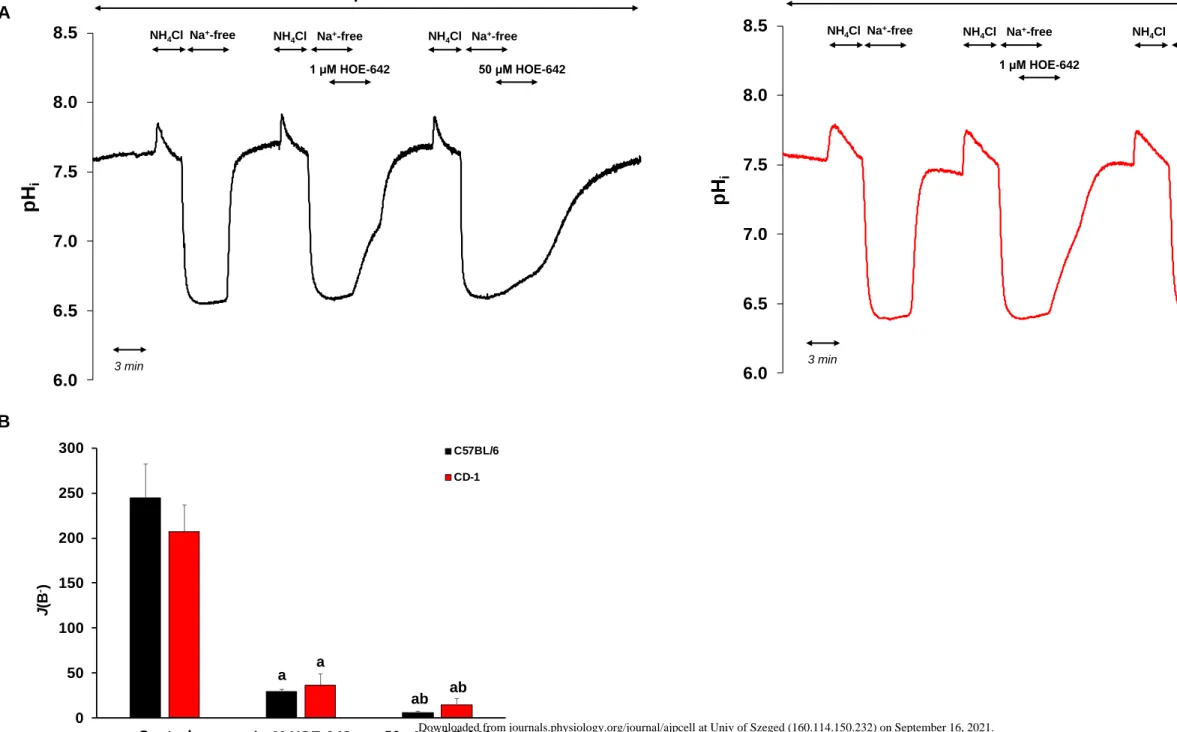
Fig. 5 Investigation of Na+/H+ exchanger (NHE) activity in esophageal organoids (EOs).
535
(A) Removal of Na+ from standard HEPES solution caused rapid intracellular acidosis in 536
organoids isolated from C57BL/6 (black line) and CD-1 (red line) mice confirmed the 537
presence of a Na+-dependent H+ efflux mechanism. Summary data for the maximal 538
intracellular pH (pHi) change (ΔpHmax) (B) and the calculated base flux (J(B−)) (C) induced 539
by Na+ removal. (D) Recovery from acid load reflects the activity of NHE in standard 540
HEPES-buffered solution. After the second NH4Cl pulse, Na+ was removed from the external 541
solution to investigate the activity of NHE. (E) Summary bar chart presents the initial rate of 542
pHi recovery (J(B−)) from an acid load. J(B−) was calculated from the dpH/dt obtained by 543
linear regression analysis of pHi measurements made over the first 60 s after Na+ removal 544
(one pHi measurement was made per second). The buffering capacity at the initial pHi was 545
used for the calculation of J(B−) (see Methods). Data are presented as the mean ± SD. a: p ≤ 546
0.05 vs. Control. n = 19-23 547
Fig. 6 Investigation of Na+/H+ exchanger (NHE) isoforms on esophageal organoids 548
(EOs). (A) Representative intracellular pH (pHi) curves (black line, C57BL/6; red line, CD-1) 549
present the recovery from acidosis in the presence of 1 and 50 µM HOE-642. (B) Summary 550
data of the calculated activities of the different NHE isoforms in the presence of the isoform- 551
selective NHE inhibitor HOE-642. The rate of pH recovery (J(B−)) was calculated from the 552
ΔpH/Δt obtained via linear regression analysis of the pHi measurement performed over the 553
first 60 s of recovery from the lowest pHi level (initial pHi). The buffering capacity at the 554
initial pHi was used to calculate J(B−). Data are presented as the mean ± SD. a: p ≤ 0.05 vs.
555
Control. b: p ≤ 0.05 vs. 1 µM HOE-642. n = 5–11 556
Fig. 7 Investigation of Na+/HCO3- cotransporter (NBC) activity in esophageal organoids 557
(EOs). (A) Representative intracellular pH (pHi) curves (black line, C57BL/6; red line, CD-1) 558
present the recovery from acidosis in the presence of 0.2 mM amiloride. (B) Summary data 559
present the calculated activity of NBC in the presence of the Na+/H+ exchanger (NHE) 560
inhibitor amiloride. The rate of acid recovery (J(B−)) was calculated from the ΔpH/Δt 561
obtained via linear regression analysis of the pHi measurement performed over the first 60 s 562
of recovery from the lowest pHi (initial pHi). The buffering capacity at the initial pHi was 563
used to calculate J(B−). Data are presented as the mean ± SD. a: p ≤ 0.05 vs. Control. b: p ≤ 564
0.05 vs. C57BL/6. n = 15–17 565
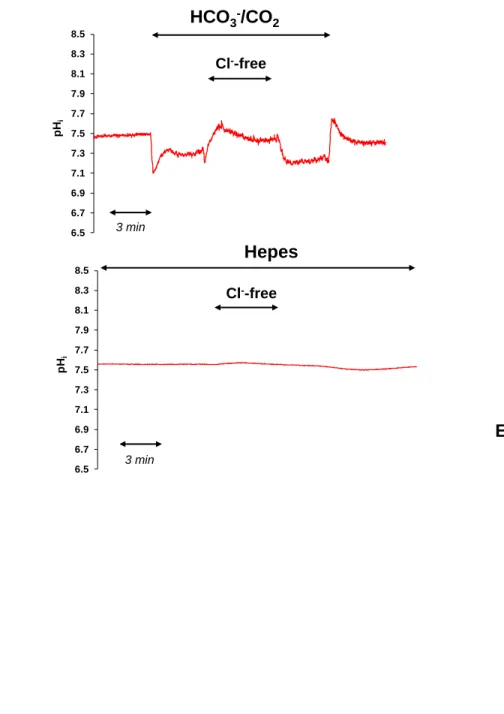
Fig. 8 Investigation of Cl−/HCO3− exchanger activity in esophageal organoids.
566
Cl−/HCO3− exchanger activity was investigated by the Cl− removal technique in the presence 567
(A) and absence (B) of HCO3−/CO2 (black line, C57BL/6; red line, CD-1) (C) The rate of acid 568
recovery J(B−) was calculated from the dpH/dt obtained via linear regression analysis of 569
intracellular pH (pHi) measurements performed over the first 60 s after exposure to the Cl−- 570
free solution. The buffering capacity at the initial pHi was used to calculate J(B−). n = 4-15 571
(D) The activity of the Cl−/HCO3− exchanger was also measured using the alkali loading 572
method and expressed as calculated J(B−), which was calculated from the dpH/dt obtained via 573
linear regression analysis of pHi measurements performed over the first 30 s of recovery from 574
the highest pHi level (initial pHi) achieved in the presence of NH4Cl. The buffering capacity 575
at the start point pHi was used for the calculation of J(B−). Data are presented as the mean ± 576
SD. n = 25-37 577
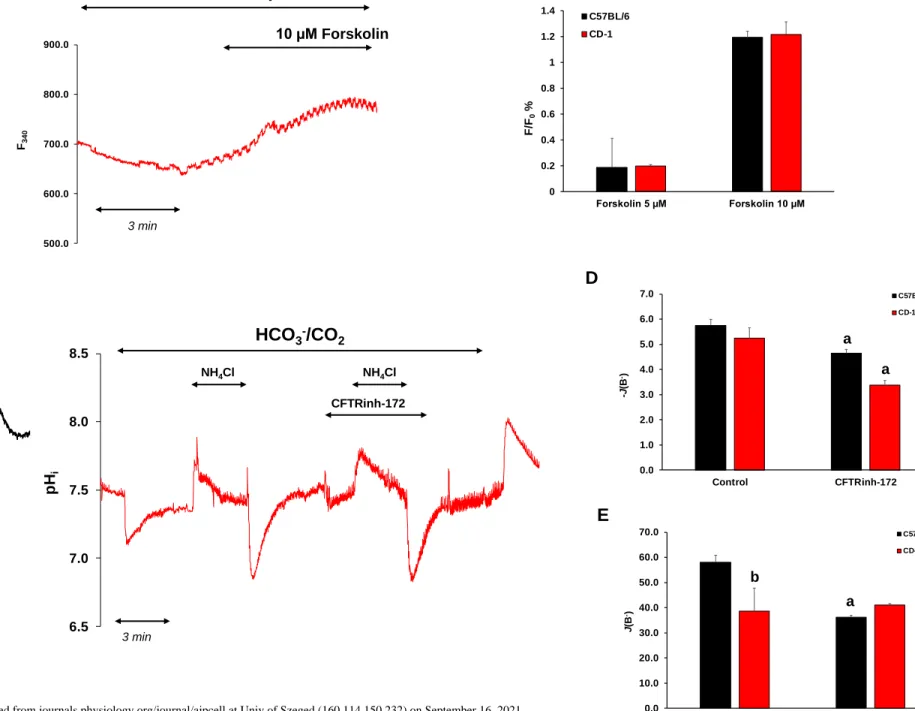
Fig. 9 Investigation of cystic fibrosis transmembrane conductance regulator (CFTR) 578
activity in esophageal organoids (EOs). (A) Representative intracellular pH (pHi) curves 579
(black line, C57BL/6; red line, CD-1) present the effect of forskolin on Cl− efflux. (B) 580
Summary data for the maximal fluorescence intensity changes. n = 19-22 (C) Representative 581
pHi curves present the recovery from acid and alkali loading in the presence of 10 µM 582
CFTRinh-172. The rates of alkali recovery (-J(B−)) (D) and acid recovery (J(B−)) (E) were 583
calculated from the ΔpH/Δt obtained via linear regression analysis of pHi measurements 584
performed over the first 30 and 60 s of recovery from the highest and lowest pHi (initial pHi), 585
respectively. The buffering capacity at the initial pHi was used to calculate J(B−) and −J(B−).
586
Data are presented as the mean ± SD. a: p ≤ 0.05 vs. Control. b: p ≤ 0.05 vs. C57BL/6. n = 3–
587 6 588
Table 1. Compositions of the solutions. Values are presented in mM.
589
Table 2. List of primary and secondary antibodies used in the study 590
Table 3. Primer sequences used in the study 591
592 593 594 595 596 597 598 599
600 601 602 603
REFERENCES 604
605
1. Becskehazi E, Korsos MM, Eross B, Hegyi P, and Venglovecz V. OEsophageal Ion 606
Transport Mechanisms and Significance Under Pathological Conditions. Front Physiol 11:
607
855, 2020.
608
2. Laczko D, Rosztoczy A, Birkas K, Katona M, Rakonczay Z, Jr., Tiszlavicz L, 609
Roka R, Wittmann T, Hegyi P, and Venglovecz V. Role of ion transporters in the bile acid- 610
induced esophageal injury. Am J Physiol Gastrointest Liver Physiol 311: G16-31, 2016.
611
3. de Jonge H.R. BMJC, Strubberg A.M., Liu J., Clarke L.L. Organoids as a Model 612
for Intestinal Ion Transport Physiology. In: Ion Transport Across Epithelial Tissues and 613
Disease, edited by Hamilton K.L. DDCSpringer, Cham., 2020.
614
4. Molnar R, Madacsy T, Varga A, Nemeth M, Katona X, Gorog M, Molnar B, 615
Fanczal J, Rakonczay Z, Jr., Hegyi P, Pallagi P, and Maleth J. Mouse pancreatic ductal 616
organoid culture as a relevant model to study exocrine pancreatic ion secretion. Lab Invest 617
100: 84-97, 2020.
618
5. Sachs N, Papaspyropoulos A, Zomer-van Ommen DD, Heo I, Bottinger L, Klay 619
D, Weeber F, Huelsz-Prince G, Iakobachvili N, Amatngalim GD, de Ligt J, van Hoeck 620
A, Proost N, Viveen MC, Lyubimova A, Teeven L, Derakhshan S, Korving J, Begthel H, 621
Dekkers JF, Kumawat K, Ramos E, van Oosterhout MF, Offerhaus GJ, Wiener DJ, 622
Olimpio EP, Dijkstra KK, Smit EF, van der Linden M, Jaksani S, van de Ven M, 623
Jonkers J, Rios AC, Voest EE, van Moorsel CH, van der Ent CK, Cuppen E, van 624
Oudenaarden A, Coenjaerts FE, Meyaard L, Bont LJ, Peters PJ, Tans SJ, van Zon JS, 625
Boj SF, Vries RG, Beekman JM, and Clevers H. Long-term expanding human airway 626
organoids for disease modeling. EMBO J 38: 2019.
627
6. DeWard AD, Cramer J, and Lagasse E. Cellular heterogeneity in the mouse 628
esophagus implicates the presence of a nonquiescent epithelial stem cell population. Cell Rep 629
9: 701-711, 2014.
630
7. Kalabis J, Oyama K, Okawa T, Nakagawa H, Michaylira CZ, Stairs DB, 631
Figueiredo JL, Mahmood U, Diehl JA, Herlyn M, and Rustgi AK. A subpopulation of 632
mouse esophageal basal cells has properties of stem cells with the capacity for self-renewal 633
and lineage specification. J Clin Invest 118: 3860-3869, 2008.
634
8. Thomas JA, Buchsbaum RN, Zimniak A, and Racker E. Intracellular pH 635
measurements in Ehrlich ascites tumor cells utilizing spectroscopic probes generated in situ.
636
Biochemistry 18: 2210-2218, 1979.
637
9. Hegyi P, Rakonczay Z, Jr., Gray MA, and Argent BE. Measurement of 638
intracellular pH in pancreatic duct cells: a new method for calibrating the fluorescence data.
639
Pancreas 28: 427-434, 2004.
640
10. Hegyi P, Gray MA, and Argent BE. Substance P inhibits bicarbonate secretion from 641
guinea pig pancreatic ducts by modulating an anion exchanger. American journal of 642
physiology Cell physiology 285: C268-276, 2003.
643
11. Venglovecz V, Rakonczay Z, Jr., Ozsvari B, Takacs T, Lonovics J, Varro A, Gray 644
MA, Argent BE, and Hegyi P. Effects of bile acids on pancreatic ductal bicarbonate 645
secretion in guinea pig. Gut 57: 1102-1112, 2008.
646
12. Harnden P, and Southgate J. Cytokeratin 14 as a marker of squamous differentiation 647
in transitional cell carcinomas. J Clin Pathol 50: 1032-1033, 1997.
648
13. Reis-Filho JS, Simpson PT, Martins A, Preto A, Gartner F, and Schmitt FC.
649
Distribution of p63, cytokeratins 5/6 and cytokeratin 14 in 51 normal and 400 neoplastic 650
human tissue samples using TARP-4 multi-tumor tissue microarray. Virchows Arch 443: 122- 651
132, 2003.
652
14. Fong P. CFTR-SLC26 transporter interactions in epithelia. Biophys Rev 4: 107-116, 653
2012.
654
15. Weintraub WH, and Machen TE. pH regulation in hepatoma cells: roles for Na-H 655
exchange, Cl-HCO3 exchange, and Na-HCO3 cotransport. The American journal of 656
physiology 257: G317-327, 1989.
657
16. Slepkov ER, Rainey JK, Sykes BD, and Fliegel L. Structural and functional analysis 658
of the Na+/H+ exchanger. Biochem J 401: 623-633, 2007.
659
17. Pallagi-Kunstar E, Farkas K, Maleth J, Rakonczay Z, Jr., Nagy F, Molnar T, 660
Szepes Z, Venglovecz V, Lonovics J, Razga Z, Wittmann T, and Hegyi P. Bile acids 661
inhibit Na(+)/H(+) exchanger and Cl(-)/HCO(3)(-) exchanger activities via cellular energy 662
breakdown and Ca(2)(+) overload in human colonic crypts. Pflugers Arch 467: 1277-1290, 663
2015.
664
18. Venglovecz V, Hegyi P, Rakonczay Z, Jr., Tiszlavicz L, Nardi A, Grunnet M, and 665
Gray MA. Pathophysiological relevance of apical large-conductance Ca(2)+-activated 666
potassium channels in pancreatic duct epithelial cells. Gut 60: 361-369, 2011.
667
19. Tobey NA, Koves G, and Orlando RC. Human esophageal epithelial cells possess an 668
Na+/H+ exchanger for H+ extrusion. Am J Gastroenterol 93: 2075-2081, 1998.
669
20. Tobey NA, Reddy SP, Keku TO, Cragoe EJ, Jr., and Orlando RC. Studies of pHi 670
in rabbit esophageal basal and squamous epithelial cells in culture. Gastroenterology 103:
671
830-839, 1992.
672
21. Shallat S, Schmidt L, Reaka A, Rao D, Chang EB, Rao MC, Ramaswamy K, and 673
Layden TJ. NHE-1 isoform of the Na+/H+ antiport is expressed in the rat and rabbit 674
esophagus. Gastroenterology 109: 1421-1428, 1995.
675
22. Ariyoshi Y, Shiozaki A, Ichikawa D, Shimizu H, Kosuga T, Konishi H, Komatsu 676
S, Fujiwara H, Okamoto K, Kishimoto M, Marunaka Y, and Otsuji E. Na+/H+
677
exchanger 1 has tumor suppressive activity and prognostic value in esophageal squamous cell 678
carcinoma. Oncotarget 8: 2209-2223, 2017.
679
23. Guan B, Hoque A, and Xu X. Amiloride and guggulsterone suppression of 680
esophageal cancer cell growth in vitro and in nude mouse xenografts. Front Biol (Beijing) 9:
681
75-81, 2014.
682
24. Yang SC, Chen CL, Yi CH, Liu TT, and Shieh KR. Changes in Gene Expression 683
Patterns of Circadian-Clock, Transient Receptor Potential Vanilloid-1 and Nerve Growth 684
Factor in Inflamed Human Esophagus. Sci Rep 5: 13602, 2015.
685
25. Zeng C, Vanoni S, Wu D, Caldwell JM, Wheeler JC, Arora K, Noah TK, 686
Waggoner L, Besse JA, Yamani AN, Uddin J, Rochman M, Wen T, Chehade M, Collins 687
MH, Mukkada VA, Putnam PE, Naren AP, Rothenberg ME, and Hogan SP. Solute 688
carrier family 9, subfamily A, member 3 (SLC9A3)/sodium-hydrogen exchanger member 3 689
(NHE3) dysregulation and dilated intercellular spaces in patients with eosinophilic 690
esophagitis. J Allergy Clin Immunol 142: 1843-1855, 2018.
691
26. Abdulnour-Nakhoul S, Nakhoul HN, Kalliny MI, Gyftopoulos A, Rabon E, 692
Doetjes R, Brown K, and Nakhoul NL. Ion transport mechanisms linked to bicarbonate 693
secretion in the esophageal submucosal glands. Am J Physiol Regul Integr Comp Physiol 301:
694
R83-96, 2011.
695
27. Abdulnour-Nakhoul S, Nakhoul NL, Wheeler SA, Wang P, Swenson ER, and 696
Orlando RC. HCO3- secretion in the esophageal submucosal glands. Am J Physiol 697
Gastrointest Liver Physiol 288: G736-744, 2005.
698
28. Tobey NA, Reddy SP, Khalbuss WE, Silvers SM, Cragoe EJ, Jr., and Orlando 699
RC. Na(+)-dependent and -independent Cl-/HCO3- exchangers in cultured rabbit esophageal 700
epithelial cells. Gastroenterology 104: 185-195, 1993.
701
29. Wang J, Wang W, Wang H, and Tuo B. Physiological and Pathological Functions 702
of SLC26A6. Front Med (Lausanne) 7: 618256, 2020.
703
30. Ko SB, Zeng W, Dorwart MR, Luo X, Kim KH, Millen L, Goto H, Naruse S, 704
Soyombo A, Thomas PJ, and Muallem S. Gating of CFTR by the STAS domain of SLC26 705
transporters. Nat Cell Biol 6: 343-350, 2004.
706
31. Stewart AK, Yamamoto A, Nakakuki M, Kondo T, Alper SL, and Ishiguro H.
707
Functional coupling of apical Cl-/HCO3- exchange with CFTR in stimulated HCO3- secretion 708
by guinea pig interlobular pancreatic duct. Am J Physiol Gastrointest Liver Physiol 296:
709
G1307-1317, 2009.
710
32. Saint-Criq V, and Gray MA. Role of CFTR in epithelial physiology. Cell Mol Life 711
Sci 74: 93-115, 2017.
712
33. Kruger L, Pridgen TA, Taylor ER, Garman KS, and Blikslager AT. Lubiprostone 713
protects esophageal mucosa from acid injury in porcine esophagus. Am J Physiol Gastrointest 714
Liver Physiol 318: G613-G623, 2020.
715
34. Ao M, Venkatasubramanian J, Boonkaewwan C, Ganesan N, Syed A, Benya RV, 716
and Rao MC. Lubiprostone activates Cl- secretion via cAMP signaling and increases 717
membrane CFTR in the human colon carcinoma cell line, T84. Dig Dis Sci 56: 339-351, 718
2011.
719
35. Norimatsu Y, Moran AR, and MacDonald KD. Lubiprostone activates CFTR, but 720
not ClC-2, via the prostaglandin receptor (EP(4)). Biochem Biophys Res Commun 426: 374- 721
379, 2012.
722
36. Gharahkhani P, Fitzgerald RC, Vaughan TL, Palles C, Gockel I, Tomlinson I, 723
Buas MF, May A, Gerges C, Anders M, Becker J, Kreuser N, Noder T, Venerito M, 724
Veits L, Schmidt T, Manner H, Schmidt C, Hess T, Bohmer AC, Izbicki JR, Holscher 725
AH, Lang H, Lorenz D, Schumacher B, Hackelsberger A, Mayershofer R, Pech O, 726