Toxicon 200 (2021) 78–86
Available online 10 July 2021
0041-0101/© 2021 The Authors. Published by Elsevier Ltd. This is an open access article under the CC BY-NC-ND license
(http://creativecommons.org/licenses/by-nc-nd/4.0/).
Investigation of the inflammatory and oxidative stress-inducing effects of deoxynivalenol and T-2 toxin exposure in non-tumorigenic human
intestinal cell model
Judit M. Pomothy
a,*, Orsolya Szab o ´
a, Agnes E. Czimmermann ´
a, Akos Babiczky ´
b,c, Akos Jerzsele ´
a, Erzs ´ ebet P ´ aszti-Gere
aaDepartment of Pharmacology and Toxicology, University of Veterinary Medicine Budapest, Hungary
bNeuronal Networks and Behaviour Research Group, Research Centre for Natural Sciences, Budapest, Hungary
cFaculty of Natural Science, Budapest University of Technology and Economics, Budapest, Hungary
A R T I C L E I N F O Handling Editor: Raymond Norton Keywords:
Deoxynivalenol T-2 toxin HIEC-6 Oxidative stress Inflammation Tight junctions
A B S T R A C T
Fungi in the Fusarium genus produce trichothecene mycotoxins including deoxynivalenol (DON) and T-2 toxin which may elicit their damaging effects on the gastrointestinal tract following the consumption of contaminated cereal-based foods. The aim of our study was to evaluate the effects of these commonly occurring fusarotoxins alone and in combination using the human, non-cancerous intestinal epithelial cell line HIEC-6. Based on our experimental data, 24 h after treatment with fusarotoxins, hydrogen peroxide levels, intracellular oxidative stress and the amounts of inflammatory interleukins IL-6 and IL-8 significantly increased. Cell membrane localization of the tight junction protein claudin-1 decreased, whereas distribution of occludin remained unchanged. Taken together, the HIEC-6 cell line appears to be a suitable experimental model for monitoring the combined effects of mycotoxins at the cellular level including changes in the redox states of cells.
1. Introduction
Consuming mycotoxin contaminated cereal-based foods poses a multifaceted health threat. Mycotoxins are secondary metabolites pro- duced by moulds with well-established adverse health effects on eukaryotic cells. Fusarium is a genus of filamentous fungi capable of synthesising, among others, trichothecene mycotoxins, which are characterized by a unique core ring structure and include more than 200 structurally similar metabolites (Pestka, 2010). Fusarium species may simultaneously infect plants and thereby exhibit enhanced, synergistic negative effects on their host organisms (Escriv´a et al., 2015). Fusarium graminearum and Fusarium sporotrichoides are the main species that produce fusarotoxins (Liew and Mohd-Redzwan, 2018). The most sig- nificant trichothecene mycotoxins are deoxynivalenol (DON) and T-2 toxin (Fig. 1). Contamination of feedstuffs, as well as food commodities by these substances is highly noxious on animals and humans, respec- tively (Liew and Mohd-Redzwan 2018). They could be detected in wheat, rye, barley, oats, and other grains and at low levels in certain commercial foods including beer and other fermented beverages, breakfast cereals, bread and other related products (Sudakin, 2003). In a
recently published review it was shown that there is a clear link between inflammatory disease and compromised intestinal barrier caused by mycotoxin such as DON and T-2 exposure (Gao et al., 2020).
DON is a heat-resistant compound; thus, its deleterious effects should even be considered after culinary treatment of foods and feeds (Lancova et al., 2008). Because of its strong emetic effects in both humans and animals, the US Department of Agriculture originally referred to it as
“vomitoxin” but its diverse, toxic effects also include diarrhoea, anorexia, immunotoxicity, as well as impaired maternal reproduction and foetal development (Chen et al., 2017). Furthermore, DON ingestion may also cause neuroendocrine changes, leukocytosis, haemorrhage, circulatory shock, and ultimately death (Bonnet et al., 2012). A study on corn and wheat samples established a connection between contamina- tion with DON and human oesophageal cancer (Luo et al., 1990). T-2 toxin is insoluble in water and its toxicity appears to depend mainly on the route of administration, the exposure time and the applied dose (Adhikari et al., 2017). It is one of the most toxic mycotoxin of type A trichothecene group (Sokolovi´c et al., 2008). This toxin has been considered to increase the occurrence of fatal reactions among the ani- mals and humans upon consumption (Joseph et al., 2004). Nayakwadi
* Corresponding author.
E-mail address: Pomothy.Judit.Mercedesz@univet.hu (J.M. Pomothy).
Contents lists available at ScienceDirect
Toxicon
journal homepage: www.elsevier.com/locate/toxicon
https://doi.org/10.1016/j.toxicon.2021.07.002
Received 17 March 2021; Received in revised form 2 July 2021; Accepted 7 July 2021
et al. (2020) proved that T-2 toxin exerted toxic effects through a cu- mulative impact of oxidative, apoptotic and inflammatory pathways via establishing the effects of T-2 -induced toxicity and pathological changes in juvenile goats. Following the consumption of foods or feedstuffs contaminated with mycotoxins, the gut epithelium might be exposed to toxic compounds to the extent that normal gut functions could be altered (Pinton and Oswald, 2014). Beisl et al. (2020) demonstrated that DON exhibited cytotoxicity against the human colon adenocarcinoma Caco-2 cells already after 24 h of incubation using Neutral Red (NR) uptake assay. In another study, DON adversely affected the viability of Caco-2 cells already at 1 μM and resulted in a significant cell death at 10 μM concentration (Kouadio et al., 2005).
Exposure to trichothecene mycotoxins led to oxidative stress and inflammation in both in vitro and in vivo models (Du et al., 2018). At 10 μM, DON caused oxidative stress in a dose-dependent manner in non-malignant intestinal porcine enterocytes IPEC-J2 (Kang et al., 2019) and human colon carcinoma cells HT-29 (Del Favero et al., 2018).
Malondialdehyde (MDA) production by Caco-2 cells, a biomarker of lipid peroxidation, significantly increased by DON exposure (Kouadio et al., 2005). To date, the authors did not find studies that evaluate the effects of T-2 in intestinal epithelial cells.
The barrier function of the gastrointestinal tract not only implies physical protection, but also local and quick immune responses from the body to certain xenobiotics (Ahluwalia et al., 2017). A main role in mediating immunes’ responses is attributed to the family of signalling molecules called cytokines, and in particular, interleukins (Akira et al., 1990; Pathmakanthan and Hawkey, 2000; Neurath, 2014).
Pro-inflammatory cytokines such as IL-6 and IL-8 play an important role in developing immune responses and thereby acute inflammation. IL-8 levels have been shown to increase in a dose-dependent manner upon exposure to DON (Maresca et al., 2008; Van De Walle et al., 2008; Moon et al., 2007) and T-2 toxin (Kruber et al., 2011) in human intestinal epithelial cells lines Caco-2 and Int-407. Furthermore, DON stimulated IL-6 production in IPEC-J2 intestinal epithelial cells in a concentration-dependent way (Kang et al., 2019). Cano et al. (2013) reported that DON at a 10 μM concentration significantly increased expressions of inflammatory cytokines IL-8, IL-1α, IL-1β, and tumour necrosis factor-α (TNF-α) at the mRNA level, and also induced trans- lation of IL-6 and IL-1β messages, which humoral components partici- pate in the differentiation of T helper cells. These changes may promote susceptibility to development of inflammatory bowel disease (IBD). IL-6 and IL-8 levels are known to be elevated in Crohn’s disease and colitis ulcerosa (Beck and Wallace, 1997), conditions that affect millions of people worldwide (Seyedian et al., 2019).
The paracellular route of transportation between adjacent enter- ocytes is regulated by a type of cell–cell junction called tight junction (TJ). The presence of these multiprotein complexes in between epithelial cells provides the epithelium with selective permeability and disrupts transportation of substances via the paracellular space. TJs are formed by claudins, occludin, and zonula occludens proteins. Toxins present in foodstuffs may disrupt the TJ barrier and hence allow passage of
pathogenic bacteria into the body (Goossens et al., 2012; Ling et al., 2016). The integrity of the intestinal barrier is determined by TJ proteins claudins and occludin (Romero et al., 2016). DON, in a dose-dependent manner, has been shown to decrease claudin-1, claudin-3, and claudin-4 protein expression levels (Akbari et al., 2014), while T-2 toxin, also in a dose-dependent manner, to suppress claudin-3, claudin-4, and occludin at the protein level (Romero et al., 2016). However, the impact of T-2 on the TJ proteins has not been completely elucidated so far.
The aim of our study was to elucidate the effects of DON and T-2 toxin on cell viability, production of inflammatory cytokines, and localization of TJ-forming proteins. Special emphasis was put on the elucidation of the effects of the 24-h-long exposure of DON and T-2 toxin on the extracellular hydrogen peroxide (H2O2) and intracellular redox statuses using the HIEC-6 cell line. HIEC-6 is a non-tumorigenic human intestinal cell line which can be applied to investigate physiological and pathophysiological conditions as these cells mimic in vivo conditions better compared to other cancerous cell lines upon human consumption of fusariotoxins. In addition, HIEC cells are originally derived from the human small intestine which makes them more favourable to elucidate interaction between intestinal epithelium and mycotoxins rather than using cells of colon origin such as Caco-2 cells.
2. Materials and methods 2.1. Cell line and culture conditions
The HIEC-6 cell line (ATCC, CLR-3266) is originated from human foetal intestine.
The complete culture medium was Dulbecco’s Modified Eagle’s Medium and Ham’s F-12 Nutrient Mixture 1:1 (DMEM/F12) (Merck, Darmstadt, Germany) with 5% foetal bovine serum (FBS), 5 μg/mL in- sulin, 5 μg/mL transferrin, 5 ng/mL selenium, 5 ng/mL epidermal growth factor (mouse EGF) and 1% penicillin-streptomycin solution (all were purchased from Thermo Fisher Scientific, USA). Prior to treatment, the cells were allowed to attach to the surface for 48 h. HIEC-6 cells were incubated in 37 ◦C in a humidified atmosphere of 5% CO2.
2.2. Reagents
DON and T-2 were purchased from Merck (Darmstadt, Germany).
Dimethyl sulfoxide (DMSO) and acetonitrile were obtained from Thermo Fisher Scientific (Waltham, MA, USA). The final concentration of acetonitrile or DMSO in the cell culture medium was <0.5% (v/v).
2.3. Experimental design
The cells were seeded to 96-well plate (Corning Costar Transwell, Merck, Darmstadt, Germany) at a density of 2 ×10⁴ cells per well for cell viability tests. For other experiments the HIEC-6 cells were cultured on Transwell 24-well polyester membrane inserts (pore size: 0.4 μm, sur- face area: 0.33 cm2 (Corning Costar Transwell, Merck, Darmstadt,
Fig. 1. The chemical structures of deoxynivalenol (DON) (a) and T-2 toxin (b).
Germany) at the density of 2 ×10⁴ cells per well. Apical volume was 0.1 mL and basolateral volume was 0.6 mL. HIEC-6 cells were treated with DON, T-2 and their combination (DT2) both apically and basolaterally.
DON was used in a concentration range of 0–20 μM and T-2 was applied in 0–50 nM for 24 h.
For assessing the impact of mycotoxin combinations the following mixtures were prepared and added apically and basolaterally: 0.5 μM DON +1 nM T-2; 0.5 μM DON +5 nM T-2; 1 μM DON +1 nM T-2; 1 μM DON +5 nM T-2; 5 μM DON +10 nM T-2; 20 μM DON +50 nM T-2.
Dissolved substances were filtered with syringe filters (Millex-GV, pore size: 0.2 μm, Merck, Darmstadt, Germany) before their application on HIEC-6 cells.
2.4. 2.4. Cell viability assays after mycotoxin treatments
Viability of HIEC-6 cells were measured after 24 h treatments with DON (at 0; 0.5; 1; 5 and 20 μM) or with T-2 toxin (at 0; 1; 5; 10 and 50 nM) or with DT2 (0.5 μM DON +1 nM T-2; 0.5 μM DON +5 nM T-2; 1 μM DON +1 nM T-2; 1 μM DON +5 nM T-2; 5 μM DON +10 nM T-2 and 20 μM DON +50 nM T-2) using MTS - CellTiter96 Aqueous One Solution (Promega, Bioscience, Budapest, Hungary). After the treatment solu- tions were removed, the cells were washed 3-fold with phosphate- buffered saline buffer (PBS). 20 μL of MTS solution, containing the tetrazolium compound was pipetted into each well of the 96-well plates containing the samples in 100 μL of phenol red-free DMEM/F12 culture medium (Merck, Darmstadt, Germany). The plates were incubated with the MTS dye for 90 min at 37 ◦C in a humidified atmosphere of 5% CO2. Viability of HIEC-6 cells was measured at 490 nm using a microplate reader (EZ Read Biochrom 400 microplate reader).
2.5. Assessment of the changes in extracellular H2O2 concentrations Extracellular H2O2 determination was performed using the Amplex Red Hydrogen Peroxide Assay Kit (Invitrogen, Molecular Probes, Carlsbad, CA, USA). The working solution of the Amplex Red contains horseradish peroxidase, which reacts with H2O2 in 1:1 stoichiometry to produce the fluorescent resorufin (Zhao et al., 2012). The collected cell free supernatants were mixed with the working solution according to the manufacturer’s instructions. After the incubation time the fluorescence intensity was measured at 560 nm excitation and 590 nm emission wavelength with a fluorimeter (Victor X2 2030, Perkin Elmer, Waltham, MA, USA).
2.6. Determination of intracellular ROS levels in HIEC-6 cells
To evaluate the intracellular ROS level in HIEC-6 cells after myco- toxin treatments, 10 mM 2,7-dichlorodihydrofluorescein diacetate (DCFH-DA) (Merck, Darmstadt, Germany), a non-fluorescent compound was used. DCFH-DA penetrates freely through the cell membranes and hydrolysed by the esterase enzymes to DCFH (Aranda et al., 2013). The ROS in cells oxidize the non-fluorescent DCFH to fluorescent DCF.
Tracking the fluorescence of DCF reflects the quantity of ROS in the cell.
The DCFH-DA assays were carried out according to the manufacturer’s instructions. The fluorescence signal intensity was detected using a fluorimeter (Victor X2 2030, Perkin Elmer, Waltham, MA, USA) at the excitation wavelength of 488 nm and the emission wavelength of 525 nm.
2.7. Measurements of IL-6 and IL-8 concentrations
The cell free supernatants of HIEC-6 were collected after 24 h incu- bation time. Human IL-6 and human IL-8 sandwich ELISA Kit (Merck, Darmstadt, Germany) were used to calculate the concentrations of IL-6 and IL-8 pro-inflammatory cytokines. The supernatants were treated according to the instructions of the manufacturer and measured by spectrophotometer (Victor X2 2030, Perkin Elmer, Waltham, MA, USA)
at 450 nm.
2.8. Localization of claudin-1 and occludin protein with confocal electron microscopy
The localization of claudin-1 and occludin was determined by confocal microscopy. Cells were fixed with 100% methanol (Merck, Darmstadt, Germany) and stained on the 24-well membrane inserts.
Cells were blocked for 20 min at room temperature in bovine serum albumin solution (PBS supplemented with 5% bovine serum albumin (BSA, Merck, Darmstadt, Germany). The primary antibodies were diluted in 5% BSA solutions. The HIEC-6 cells were incubated on the inserts for 1 h at room temperature in presence of anti-claudin-1 rabbit polyclonal primary antibody (1:200, Invitrogen, Molecular Probes, Carlsbad, CA, USA) or anti-occludin rabbit polyclonal primary antibody (1:200, Merck, Darmstadt, Germany). Then they were incubated with Alexa-Fluor 546 conjugated anti-rabbit IgG secondary antibodies (1:200, Invitrogen, Molecular Probes, Carlsbad, CA, USA), which were diluted in PBS. To detect the sialic acid residues in HIEC-6 cell mem- branes cells were stained with wheat germ agglutinin conjugated with Alexa-Fluor 488 (1:200 diluted in PBS, WGA Alexa Fluor 488, Invi- trogen, Molecular Probes, Carlsbad, CA, USA) for 10 min. Cell nuclei were stained using 4’,6-diamidino-2-phenylindole (DAPI) (1:500 diluted in PBS, Invitrogen, Molecular Probes, Carlsbad, CA, USA) for additional 10 min. Between each staining, the inserts were washed in PBS for 3 x 5 min. Inserts were put on glass slides using fluorescent mounting medium (Dako, Agilent Technologies, Glostrup, Denmark).
The claudin-1 and occludin samples were analysed using a Zeiss confocal microscope 63 x Plan Apochromat 63x/1.4 Oil DIC M27 (Zeiss LSM 710 Confocal Microscope, Oberkochen, Germany).
2.9. Evaluation of claudin-1 and occludin concentrations with sandwich ELISA
To quantify the claudin-1 and occludin concentrations in HIEC-6 cells, human claudin-1 sandwich ELISA Kit (Cloud-Clone Corp., Wuhan, China) and occludin sandwich ELISA Kit were used (Elabscience, Central European Biosystems, Budapest, Hungary). Prior to the experiments HIEC-6 cells were incubated with 1 μM DON, 5 nM T-2 and DT2 (1 μM DON+5 nM T-2) added apically and basolaterally for 24 h. The cells were dispersed with 0.25% trypsin solution and the cell suspensions were collected and centrifuged for 5 min at 1000×g at 5 ◦C. The cells were suspended with pre-cooled PBS, then were centrifuged for 10 min at 1500×g at 5 ◦C. The cell free supernatants were collected and the ELISA tests were carried out according to the manufacturer’s in- structions and measured by spectrophotometer (Victor X2 2030, Perkin Elmer, Waltham, MA, USA) at 450 nm.
2.10. Statistical analysis
All data are expressed as means ±standard deviations. The statistical analysis of the results was performed by using the R Core Team (2016).
R: A language and environment for statistical computing (R Foundation for Statistical Computing, Vienna, Austria).
The results data were analysed by one-way ANOVA together with the post hoc Tukey test. p values <0.05 were considered to be statistically significant (*p <0.05; **p <0.01; ***p <0.001).
3. Results
3.1. Individual and combined effects of DON and T-2 toxin on the viability of HIEC-6 cells
The cytotoxic effects of DON or T-2 toxin alone, or the combination of the two (DT2) on HIEC-6 cells were investigated using 24 h incubation times (Fig. 2). DON was used in the 0–20 μM, while the effects of T-2
were tested in the 0–50 nM concentration range. For DT2, the concen- trations applied were as follows: 0.5 μM DON +1 nM T-2; 0.5 μM DON +5 nM T-2; 1 μM DON +1 nM T-2; 1 μM DON +5 nM T-2; 5 μM DON +10 nM T-2; 20 μM DON +50 nM T-2. Significant cell death was observed at 5 and 20 μM DON (for both concentrations p <0.001) (Fig. 2a). A significant decrease in cell viability following the treatment with 10 and 50 nM T-2 was also noted (for both concentrations p <
0.001) (Fig. 2b). As for DT2, treatments 5 μM DON +10 nM T-2 and 20 μM DON +50 nM T-2 decreased cell viability significantly (for both concentrations p <0.001) (Fig. 2c). In subsequent tests, the effects of the non-cytotoxic 1 μM DON, 5 nM T-2, and 1 μM DON +5 nM T-2 DT2 concentrations were used.
3.2. Changes in the extracellular H2O2 concentrations upon exposure to mycotoxins
To monitor the changes in H2O2 concentrations in the extracellular space of cultured HIEC-6 cells treated with low concentrations of DON, T-2, and DT2 for 24 h, cell-free supernatants were used (Fig. 3). The results demonstrated that treatment with 1 μM DON (p =0.00637) and 5 nM T-2 (p =0.03181) significantly increased the production of H2O2,
compared to the control. DT2 treatment (1 μM DON+5 nM T-2) also significantly boosted the amount of extracellular H2O2 (p =0.00683), when compared to the control. The respective effect of DT2, in com- parison with that of DON and T-2 treatments, did not significantly differ (DON: p =1.0000; T-2: p =0.89387).
3.3. Elucidation of intracellular ROS by dichloro-dihydro-fluorescein diacetate (DCFH-DA) assay
Changes in intracellular ROS levels were measured in HIEC-6 cells after mycotoxin exposure for 24 h (Fig. 4). After centrifugation, fluo- rescence intensities were monitored in cell-free supernatants, indicative of changes in intracellular ROS levels upon treatment with toxins. 1 μM DON, 5 nM T-2, and DT2 (1 μM DON +5 nM T-2) all significantly increased ROS, compared to the control values (DON: p =0.0134; T-2: p
=0.0272; DT2: p =0.0112). Effects of DON treatment and T-2 treatment alone did not significantly differ from that with DT2 (DON: p =0.9997;
T-2: p =0.9547).
Fig. 2.The effects of DON (a), T-2 (b), and DT2 (c) on the viability of HIEC-6 cells using 24 h of incubation time. Significant changes were detected for DON at 5 and 20 μM, and for T-2 at 10 and 50 nM compared to the control. A notable extent of cell death was detected for the combined, DT2 treatment at 5 and 20 μM DON +10 and 50 nM T-2 concentrations. Mean absorbances ±standard deviations are shown (n =9, ***p <0.001).
Fig. 3. Measurement of extracellular H2O2 concentrations after 24 h of mycotoxin treatment. HIEC-6 cells were treated with solutions containing 1 μM DON, 5 nM T-2, and DT2 (1 μM DON +5 nM T-2). All mycotoxin treatments significantly elevated extracellular H2O2 concentrations in the cell-free super- natants. Means ±standard deviations are shown (n =8, *p <0.05; **p <0.01).
Fig. 4.Evaluation of intracellular ROS in mycotoxin treated HIEC-6 cells. Cells were treated with solutions containing 1 μM DON, 5 nM T-2, and DT2 (1 μM DON + 5 nM T-2) for 24 h. Based on the observed values, all mycotoxin treatments significantly increased levels of intracellular ROS in these cells.
Mean values ±standard deviations are shown (n =10, *p <0.05).
3.4. Quantitative assessment of inflammatory cytokines IL-6 and IL-8 Changes in the amounts of two inflammatory cytokines, IL-6 and IL-8 were examined by sandwich ELISA. HIEC-6 cells were exposed to mycotoxin-containing treatment solutions apically and basolaterally and concentrations of IL-6 and IL-8 were monitored by sandwich the ELISA method (Fig. 5). Cell-free supernatants were collected after 24 h of incubation.
The concentration of IL-6 (Fig. 5a) significantly increased after treatment with 1 μM DON, 5 nM T-2, and DT2 (1 μM DON +5 nM T-2), compared to the control (for all p <0.001). In comparison with single mycotoxins, the combination treatment significantly elevated IL-6 cytokine concentration (p < 0.001). IL-8 concentration (Fig. 5b) increased upon 1 μM DON, 5 nM T-2, and DT2 (1 μM DON +5 nM T-2) treatments, compared to that in control cells (DON: p =0.00225; T-2: p
=0.00597; DT2: p <0.001). Comparing the effects of single and com- bined treatments, the effect of DT2 did not significantly differ from that of DON (p =0.08004), while, in comparison with T-2, DT2 significantly increased the concentration of IL-8 (p =0.03624).
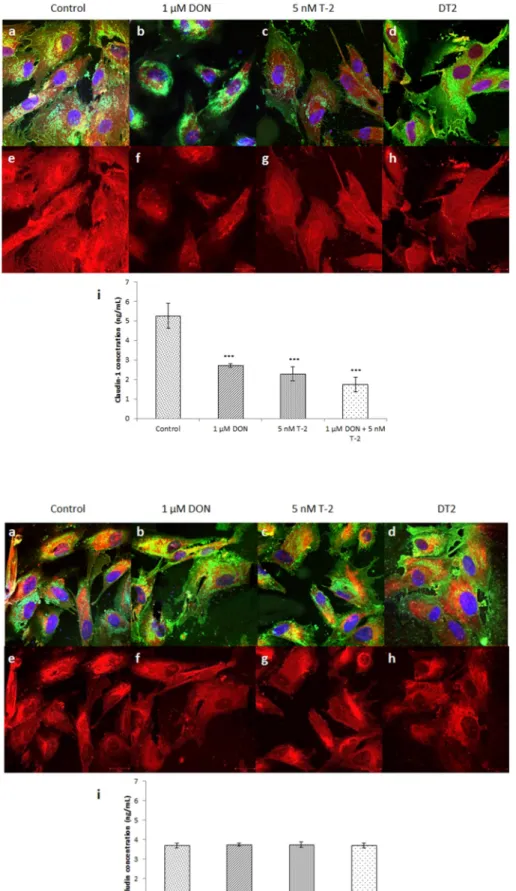
3.5. Localization and quantitative assessment of claudin-1 expression Localization of claudin-1 proteins to sites of TJs was detected by immunofluorescent staining in untreated control cells and after 1 μM DON, 5 nM T-2, and DT2 (1 μM DON +5 nM T-2) treatment (Fig. 6).
Immunofluorescent stainings (Fig. 6a–h) demonstrate that all treat- ments decreased the expression of claudin-1, when compared to the control. T-2 and DT2 treatments resulted in lower claudin-1 expression.
All mycotoxin treatments examined significantly decreased claudin-1 concentration (Fig. 6i), compared to control samples (p < 0.001). A significant difference was also detected between 1 μM DON and DT2 (p
=0.0391).
3.6. Localization and quantitative assessment of occludin expression Cell membrane localization of occludin was visualised using immu- nofluorescent staining in untreated control cells, and after 1 μM DON, 5 nM T-2, and DT2 (1 μM DON +5 nM T-2) treatments (Fig. 7). HIEC-6 cells were treated with treatment solutions for 24 h. Micrographs ob- tained with confocal microscopy (Fig. 7a–h) revealed no significant differences among treatment types, indicating that none of the myco- toxin treatments applied altered occludin expression. Concentration of occludin (Fig. 7i) did not change upon any of the treatments, when compared to that in control cells (DON: p =0.937; T-2: p =0.979; DT2:
p =1.000).
4. Discussion
DON and T-2 toxin belong to the group of trichothecene mycotoxins produced by Fusarium mould species and are detectable in contaminated cereal crops of the temperate climate zone. Their natural occurrence
makes it rather difficult to evade mould contamination and mycotoxin exposure (Zinedine and Ma˜nes, 2009). Mycotoxins, once inside the digestive tract, first make contact with the epithelial layer; hence these cells are exposed to the highest concentrations of these toxic com- pounds. The cellular effects of mycotoxins should therefore be studied on primary intestinal epithelial cells or cells lines derived from the in- testinal epithelium. Several cells lines established from mammalian, including human small intestinal epithelia serve as model systems for assessing the effects of foodborne toxins on the small intestine. Caco-2, although derived from the colon and of malignant origin, is widely used for studying differentiation traits, nutrient absorption, and responsive- ness to growth factors and pharmacologically active substances (Sam- buy et al., 2005). In contrast, the HIEC-6 cell line derives from a non-malignant small intestinal epithelium and thus serves as a better model towards studying nutrient absorption (Takenaka et al., 2016).
Due to the presence and distribution of TJ proteins they are well applicable for elucidating the barrier function of the gut (Pageot et al., 2000).
Our work is the first to examine the cellular effects of DON and T-2 fusarotoxins separately and in combination on the human non- malignant intestinal cell line HIEC-6. Graziani et al. (2015) detected a significant cytotoxic effect of DON on Caco-2 cells, when applied at a 100 μM concentration for 24 h, using a lactate dehydrogenase (LDH) leakage assay. Goossens et al. (2012) determined IC50 values for DON (23.5 μM) and for T-2 (20.4 nM) in non-tumorigenic IPEC-J2 cells using different concentrations of DON and T-2 for 72 h.
Treating HT-29 cells for 24 h, Krishnaswamy et al. (2010) deter- mined the IC50 value of DON to be 0.84 μM, using the 3-(4,5-dime- thylthiazol-2-yl)-2,5-diphenyltetrazolium bromide (MTT) and the LDH leakage assays. Del Favero et al. (2018) tested the effects of 24 h 1 nM–10 μM DON on the viability of HT-29 cells and noted a significant decrease in the viability of cells at 1 and 10 μM DON concentrations, using a WST-1 based colorimetric assay. This is in line with our finding that ≥5 μM DON causes significant cell death in HIEC-6 cells. Calvert et al. (2005) treated Caco-2 cells with 0.34–1.7 μM T-2 for 48 h. Results of MTT assays revealed that the cell line was generally resistant to the toxin. Romero et al. (2016) determined IC50 for T-2 at 14.83 μM in Caco-2 cells for 24 h, using the MTT and LDH methods. T-2 toxicity was evaluated by Verbrugghe et al. (2012) and it was found that IC50 values of T-2 mycotoxin for undifferentiated and differentiated non-cancerous IPEC-J2 cells were 12.198 nM and 395.9 nM, respectively. It was also reported that dose-dependent decreases in cell proliferation in porcine IPEC-1 and in the histopathological scores of swine jejunal explants were observed for T-2 toxin at nM-levels, with IC50 values for T-2 of 9.3 and 15.1 nM in vitro and ex vivo, respectively (Kolf-Clauw et al., 2013).
Our results from incubating HIEC-6 cells with T-2 toxin for 24 h showed cytotoxicity ≥10 nM, obtained from MTS assays. The coopera- tive effects of DON and other trichothecene mycotoxins on Caco-2 cells were tested by Alassane-Kpembi et al. (2013), using 48 h of incubation time and the NR assay. Administering DON at low concentrations of 0.15–0.55 μM together with other mycotoxins, synergistic effects were
Fig. 5.Changes in the amounts of IL-6 (a) and IL-8 (b) inflammatory cytokines in HIEC-6 cells after mycotoxin exposure for 24 h. Concentrations of in- flammatory cytokines in cell-free supernatants were determined using sandwich ELISA. Cells were exposed to treating solutions containing 1 μM DON, 5 nM T-2, and DT2 (1 μM DON +5 nM T-2) for 24 h.
Concentrations of both IL-6 and IL-8 significantly increased by exposure to either toxin or to their combination. Mean concentrations ± standard de- viations are shown (IL-6: n =8, IL-8: n =6 **p <
0.01; ***p <0.001).
Fig. 6.Localization of claudin-1 detected by confocal microscopy (a–h) in mycotoxin treated HIEC-6 cells (24 h of incubation) and determination of changes in claudin-1 concentrations (i). Claudin-1 in the cells was visualised by AlexaFluor 546 dye and sialic acids in membranes were labelled with AlexaFluor 488 conjugated wheat germ agglutinin (WGA). Cell nuclei were counterstained with DAPI. Claudin-1 concen- trations significantly dropped upon mycotoxin treat- ment. Scale bars in the bottom right corner of each panel represent 20 μm (n =4, ***p <0.001).
Fig. 7. Localization of occludin proteins using confocal microscopy (a–h) in mycotoxin treated HIEC-6 cells (24 h of incubation) and determination of changes in occludin concentrations (i). Occludin in the cells was visualised by AlexaFluor 546 dye and sialic acids in membranes were labelled with Alexa- Fluor 488 conjugated wheat germ agglutinin (WGA).
Cell nuclei were counterstained with DAPI. Occludin concentration did not change upon mycotoxin treat- ments. Scale bars in the bottom right corner of each panel represent 20 μm (n =4, p >0.05).
detected. In our experiments, we investigated the combined effects of co-administered DON and T-2 toxin on HIEC-6 cells applying MTS assay.
Although at higher concentrations, ≥5 μM for DON and ≥10 nM for T-2 toxin, a significant degree of cell death was detected after 24 h of in- cubation in HIEC-6 cells.
Our in vitro experimental data demonstrate that DON and T-2 toxin trigger a significant degree of oxidative stress. Kouadio et al. (2005) found in Caco-2 cells that 24 h of treatment with 10 μM DON signifi- cantly increased lipid peroxidation using the MDA assay. In accordance, the extracellular H2O2 levels were significantly increased in IPEC-J2 cells after 72 h incubation of cells with 1 μM, DON, 5 nM T-2 or their combination (Pomothy et al., 2020). Results of DCFH-DA assays on HT-29 cells showed a significant elevation in ROS amounts following treatment with 1 μM DON for 0.5–6 h and a more moderate increase after 24 h (Wan et al., 2019). Similar results were obtained by Bensassi et al. (2009), who found the intensities of fluorescent signals from DCFH-DA assays unchanged after treating HT-29 cells with that 2.5–15 μM DON for 24 h. Our findings contradict latter data, as in HIEC-6 cells 1 μM DON significantly increased H2O2 concentration and intracellular ROS levels. Nevertheless, our results are congruent with data from ex- periments on similarly non-malignant IPEC-J2 cells, where 6.7 μM DON for 24 h significantly increased intracellular ROS levels detected by the DCFH-DA assay (Kang et al., 2019). In our analysis, 5 nM T-2 signifi- cantly raised the extracellular concentration of H2O2 and the intracel- lular levels of ROS. 1 μM DON and 5 nM T-2 in combination significantly contributed to the formation of an oxidative stress.
Several investigators analysed cytokine expression patterns of different cell lines and whether they are suitable models for studying the process of inflammation. Eckmann et al. (1993) worked with numerous malignant cell lines and demonstrated that all those cell lines (Caco-2, HT-29, SW620, T84) secreted IL-8 and other cytokines e.g. IL-12 and TGFβ1. In addition, Caco-2 and HT-29 both secreted detectable levels of IL-6 as well (Vitkus et al., 1998; Li et al., 2009). They also reported that the HIEC-6 cell line produced IL-6 and IL-8 cytokines (Schwartz et al., 2005). Trichothecene mycotoxins induce inflammation in tissues by triggering cytotoxicity and oxidative stress (Pestka, 2010; Adhikari et al., 2017). In Caco-2 cell, DON significantly increased IL-8 levels in a dose-dependent manner when applied within the range of 0–16.85 μM concentration using 48 h of incubation time (Van De Walle et al., 2008).
Kadota et al. (2013) also observed elevation in IL-8 levels when exposing Caco-2 cells to 0.337–3.37 μM DON. In IPEC-J2 cells, upon DON expo- sure at 0.5–2 μM for 4 h a significant increase in IL-6 expression was noted (Kang et al., 2019). The effect of T-2 on proinflammatory cytokine levels in intestinal epithelial cells has not been widely studied yet. It was found that T-2 in concentration range of 4.29–275 nM could upregulate IL-8 levels in Caco-2 cells after 20 h exposure (Kruber et al., 2011). Based on our previous experimental data IL-6 and IL-8 overproduction occurred when IPEC-J2 cells were incubated with DON and T-2 com- bination (1 μM DON and 5 nM T-2) for 48 h and 72 h and these eleva- tions in IL-6 and IL-8 levels were suppressed by the pre-treatment of cells with 50 μM concentration of RA for 24 h (Pomothy et al., 2020).
In HIEC-6 cells, we found that DON is already able to significantly increase IL-6 and IL-8 levels at 1 μM concentration, following 24 h of incubation. The scientific literature on the effects of T-2 toxin on cyto- kine production is very limited. Kruber et al. (2011) tested the effects of 4.29–275 nM T-2 on Caco-2 cells using a 20 h of incubation and found increased IL-8 levels. This is in line with our findings on HIEC-6 cells that 5 nM T-2 significantly elevated IL-8 concentration. Our results using HIEC-6 cells demonstrate that mycotoxin treatments tested here signif- icantly increase IL-6 and IL-8 levels, which suggests a pro-inflammatory role for the combined exposure to DON and T-2 toxin.
ROS-induced damage to the epithelial barrier integrity appears to be present in the background of the pathogenesis of various inflammatory diseases (Rao, 2008). Van De Walle et al. (2010) published that para- cellular permeability in Caco-2 cultures treated with 0.17–17 μM DON increased due to reduced claudin-4 expression. This finding was
confirmed by Pinton et al. (2009), who showed decreased claudin-3 and claudin-4 expression in Caco-2 cells upon exposure to DON. Claudin-1 with general barrier tightening function can be regulated via alter- ations in redox state (Overgaard et al., 2011). Springler et al. (2016) in non-malignant IPEC-J2 cells demonstrated that DON at 20 μM sup- pressed claudin-1 expression but did not affect that of occludin. These results are in good agreement with our findings in HIEC-6 cells that already 1 μM DON significantly decreased claudin-1 expression. Our data showed that in HIEC-6 cells, 5 nM T-2 significantly decreased claudin-1 concentration after 24 h of incubation, but the amount of occludin did not change significantly. Immunofluorescent staining pat- terns of TJs showed that treatment with DON, T-2, as well as their combination, result in decreased claudin-1 expression, whereas distri- bution of occludin remained even and unchanged, using 24 h of incu- bation times.
5. Conclusions
Our study elucidates firstly the effects of mycotoxins DON and T-2 which were administered either separately or in combination for 24 h, on the viability of HIEC-6 cells. We confirmed that the HIEC-6 cell line is a suitable in vitro experimental model for elucidating the pro- inflammatory and pro-oxidant characteristics of these foodborne my- cotoxins. Based on our experimental data, it can be concluded that mycotoxins administered below cytotoxic concentrations augment both extra- and intracellular oxidative stress and the production of inflam- matory cytokines IL-6 and IL-8. DON and T-2 applied separately, as well as in combination, significantly decreased the expression of TJ protein claudin-1, while the expression of occludin remained unchanged.
Data availability
The data used to support the findings of this study are available from the corresponding author upon request.
Credit roles
Judit M. Pomothy: Conceptualization, Formal analysis, Investiga- tion, Resources, Validation, Writing – original draft, Writing – review &
editing. Orsolya Szab´o; : Data curation, Investigation, Resources, Writing – original draft. Agnes E. Czimmermann: Formal analysis, ´ Investigation, Resources, Writing – original draft. Akos Babiczky: ´ Investigation, Software, Visualization. Akos Jerzsele: Funding acquisi-´ tion, Investigation, Project administration, Supervision. Erzs´ebet P´aszti- Gere: Conceptualization, Data curation, Investigation, Methodology, Project administration, Resources, Supervision, Validation, Writing – review & editing.
Funding statement
The authors would like to thank the Hungarian Scientific Research Fund for funding this study [124522]. This work was supported by the European Union and co-financed by the European Social Fund [EFOP- 3.6.1-16-2016-00024; EFOP-3.6.2-16-2017-00012 and EFOP-3.6.3- VEKOP-16-2017-00005]. This project was supported by the J´anos Bolyai Research Scholarship of the Hungarian Academy of Sciences. The research was supported by the ÚNKP-20-5 New National Excellence Program of the Ministry for Innovation and Technology from the source of the National Research, Development and Innovation Fund.
Declaration of competing interest
The authors declare that they have no known competing financial interests or personal relationships that could have appeared to influence the work reported in this paper.
Acknowledgments
Special thanks to Aletta Magyar for assistance of confocal micro- scopy, Júlia Sepr˝odi for providing chemical background and R´eka Fanni Barna for technical helping with preparation of the manuscript.
References
Adhikari, M., Negi, B., Kaushik, N., Adhikari, A., Al-Khedhairy, A.A., Kaushik, N.K., Choi, E.H., 2017. T-2 mycotoxin: toxicological effects and decontamination strategies. Oncotarget 8, 33933–33952.
Ahluwalia, B., Magnusson, M.K., Ohman, L., 2017. Mucosal immune system of the ¨ gastrointestinal tract: maintaining balance between the good and the bad. Scand. J.
Gastroenterol. 52, 1185–1193.
Akbari, P., Braber, S., Gremmels, H., Koelink, P.J., Verheijden, K.A., Garssen, J., Fink- Gremmels, J., 2014. Deoxynivalenol: a trigger for intestinal integrity breakdown. F.
A.S.E.B. J. 28, 2414–2429.
Akira, S., Hirano, T., Taga, T., Kishimoto, T., 1990. Biology of multifunctional cytokines:
IL 6 and related molecules (IL 1 and TNF). F.A.S.E.B. J. 4, 2860–2867.
Alassane-Kpembi, I., Kolf-Clauw, M., Gauthier, T., Abrami, R., Abiola, F.A., Oswald, I.P., Puel, O., 2013. New insights into mycotoxin mixtures: the toxicity of low doses of Type B trichothecenes on intestinal epithelial cells is synergistic. Toxicol. Appl.
Pharmacol. 272, 191–198.
Aranda, A., Sequedo, L., Tolosa, L., Quintas, G., Burello, E., Castell, J.V., Gombau, L., 2013. Dichloro-dihydro-fluorescein diacetate (DCFH-DA) assay: a quantitative method for oxidative stress assessment of nanoparticle-treated cells. Toxicol. Vitro 27, 954–963.
Beck, P.L., Wallace, J.L., 1997. Cytokines in inflammatory bowel disease. Mediat.
Inflamm. 6, 95–103.
Beisl, J., Pahlke, G., Abeln, H., Ehling-Schulz, M., Del Favero, G., Varga, E., Warth, B., Sulyok, M., Abia, W., Ezekiel, C.N., Marko, D., 2020. Combinatory effects of cereulide and deoxynivalenol on in vitro cell viability and inflammation of human Caco-2 cells. Arch. Toxicol. 94, 833–844.
Bensassi, F., El Golli-Bennour, E., Abid-Essefi, S., Bouaziz, C., Hajlaoui, M.R., Bacha, H., 2009. Pathway of deoxynivalenol-induced apoptosis in human colon carcinoma cells. Toxicology 264, 104–109.
Bonnet, M.S., Roux, J., Mounien, L., Dallaporta, M., Troadec, J.D., 2012. Advances in deoxynivalenol toxicity mechanisms: the brain as a target. Toxins (Basel). 4, 1120–1138. Corrected and republished in 2015. J. Food Sci. 80. T2970–T2983.
Calvert, T.W., Aidoo, K.E., Candlish, A.G., Fuat, A.R., 2005. Comparison of in vitro cytotoxicity of Fusarium mycotoxins, deoxynivalenol, T-2 toxin and zearalenone on selected human epithelial cell lines. Mycopathologia 159, 413–419.
Cano, P.M., Seeboth, J., Meurens, F., Cognie, J., Abrami, R., Oswald, I.P., Guzylack- Piriou, L., 2013. Deoxynivalenol as a new factor in the persistence of intestinal inflammatory diseases: an emerging hypothesis through possible modulation of Th17-mediated response. PloS One 8, e53647.
Chen, L., Peng, Z., Nüssler, A.K., Liu, L., Yang, W., 2017. Current and prospective sights in mechanism of deoxynivalenol-induced emesis for future scientific study and clinical treatment. J. Appl. Toxicol. 37, 784–791.
De Walle, J.V., Sergent, T., Piront, N., Toussaint, O., Schneider, Y.J., Larondelle, Y., 2010. Deoxynivalenol affects in vitro intestinal epithelial cell barrier integrity through inhibition of protein synthesis. Toxicol. Appl. Pharmacol. 245, 291–298.
Del Favero, G., Woelflingseder, L., Braun, D., Puntscher, H., Kütt, M.L., Dellafiora, L., Warth, B., Pahlke, G., Dall’Asta, C., Adam, G., Marko, D., 2018. Response of intestinal HT-29 cells to the trichothecene mycotoxin deoxynivalenol and its sulfated conjugates. Toxicol. Lett. 295, 424–437.
Du, Z., Kim, K.H., Kim, J., Moon, Y., 2018. Fungal deoxynivalenol-induced enterocyte distress is attenuated by adulterated adlay: in vitro evidences for mucoactive counteraction. Front. Immunol. 9, 186.
Eckmann, L., Jung, H.C., Schürer-Maly, C., Panja, A., Morzycka-Wroblewska, E., Kagnoff, M.F., 1993. Differential cytokine expression by human intestinal epithelial cell lines: regulated expression of interleukin 8. Gastroenterology 105, 1689–1697.
Escriv´a, L., Font, G., Manyes, L., 2015. In vivo toxicity studies of fusarium mycotoxins in the last decade: a review. Food Chem. Toxicol. 78, 185–206.
Gao, Y., Meng, L., Liu, H., Wang, J., Zheng, N., 2020. The compromised intestinal barrier induced by mycotoxins. Toxins 12, 619.
Goossens, J., Pasmans, F., Verbrugghe, E., Vandenbroucke, V., De Baere, S., Meyer, E., Haesebrouck, F., De Backer, P., Croubels, S., 2012. Porcine intestinal epithelial barrier disruption by the Fusarium mycotoxins deoxynivalenol and T-2 toxin promotes transepithelial passage of doxycycline and paromomycin. BMC Vet. Res. 8, 245.
Graziani, F., Pujol, A., Nicoletti, C., Pinton, P., Armand, L., Di Pasquale, E., Oswald, I.P., Perrier, J., Maresca, M., 2015. The food-associated ribotoxin deoxynivalenol modulates inducible NO synthase in human intestinal cell model. Toxicol. Sci. 145, 372–382.
Joseph, R., Derbyshire, M., Stroka, J., Emons, H., Anklam, E., 2004. Trichothecenes:
reference materials and method validation. Toxicol. Lett. 153, 123–132.
Kadota, T., Furusawa, H., Hirano, S., Tajima, O., Kamata, Y., Sugita-Konishi, Y., 2013.
Comparative study of deoxynivalenol, 3-acetyldeoxynivalenol, and 15-acetyldeoxy- nivalenol on intestinal transport and IL-8 secretion in the human cell line Caco-2.
Toxicol. Vitro 27, 1888–1895.
Kang, R., Li, R., Dai, P., Li, Z., Li, Y., Li, C., 2019. Deoxynivalenol induced apoptosis and inflammation of IPEC-J2 cells by promoting ROS production. Environ. Pollut. 251, 689–698.
Kolf-Clauw, M., Sassahara, M., Lucioli, J., Rubira-Gerez, J., Alassane-Kpembi, I., Lyazhri, F., Borin, C., Oswald, I.P., 2013. The emerging mycotoxin, enniatin B1, down-modulates the gastrointestinal toxicity of T-2 toxin in vitro on intestinal epithelial cells and ex vivo on intestinal explants. Arch. Toxicol. 87, 2233–2241.
Kouadio, J.H., Mobio, T.A., Baudrimont, I., Moukha, S., Dano, S.D., Creppy, E.E., 2005.
Comparative study of cytotoxicity and oxidative stress induced by deoxynivalenol, zearalenone or fumonisin B1 in human intestinal cell line Caco-2. Toxicology 213, 56–65.
Krishnaswamy, R., Devaraj, S.N., Padma, V.V., 2010. Lutein protects HT-29 cells against deoxynivalenol-induced oxidative stress and apoptosis: prevention of NF-kappaB nuclear localization and down regulation of NF-kappaB and cyclo-oxygenase-2 expression. Free Radic. Biol. Med. 49, 50–60.
Kruber, P., Trump, S., Behrens, J., Lehmann, I., 2011. T-2 toxin is a cytochrome P450 1A1 inducer and leads to MAPK/p38- but not aryl hydrocarbon receptor-dependent interleukin-8 secretion in the human intestinal epithelial cell line Caco-2. Toxicology 284, 34–41.
Lancova, K., Hajslova, J., Kostelanska, M., Kohoutkova, J., Nedelnik, J., Moravcova, H., Vanova, M., 2008. Fate of trichothecene mycotoxins during the processing: milling and baking. Food Addit. Contam. Part A Chem. Anal. Control Expo. Risk Assess. 25, 650–659.
Li, Y.Y., Hsieh, L.L., Tang, R.P., Liao, S.K., Yeh, K.Y., 2009. Interleukin-6 (IL-6) released by macrophages induces IL-6 secretion in the human colon cancer HT-29 cell line.
Hum. Immunol. 70, 151–158.
Liew, W.-P.-P., Mohd-Redzwan, S., 2018. Mycotoxin: its impact on gut health and microbiota. Front. Cell Infect. Microbiol. 8, 60.
Ling, K.H., Wan, M.L., El-Nezami, H., Wang, M., 2016. Protective capacity of resveratrol, a natural polyphenolic compound, against deoxynivalenol-induced intestinal barrier dysfunction and bacterial translocation. Chem. Res. Toxicol. 29, 823–833.
Luo, Y., Yoshizawa, T., Katayama, T., 1990. Comparative study on the natural occurrence of Fusarium mycotoxins (trichothecenes and zearalenone) in corn and wheat from high- and low-risk areas for human esophageal cancer in China. Appl. Environ.
Microbiol. 56, 3723–3726.
Maresca, M., Yahi, N., Youn`es-Sakr, L., Boyron, M., Caporiccio, B., Fantini, J., 2008. Both direct and indirect effects account for the pro-inflammatory activity of
enteropathogenic mycotoxins on the human intestinal epithelium: stimulation of interleukin-8 secretion, potentiation of interleukin-1beta effect and increase in the transepithelial passage of commensal bacteria. Toxicol. Appl. Pharmacol. 228, 84–92.
Moon, Y., Yang, H., Lee, S.H., 2007. Modulation of early growth response gene 1 and interleukin-8 expression by ribotoxin deoxynivalenol (vomitoxin) via ERK1/2 in human epithelial intestine 407 cells. Biochem. Biophys. Res. Commun. 362, 256–262.
Nayakwadi, S., Ramu, R., Kumar Sharma, A., Kumar Gupta, V., Rajukumar, K., Kumar, V., Shirahatti, P.S., Rashmi, L., Basalingappa, K.M., 2020.
Toxicopathological studies on the effects of T-2 mycotoxin and their interaction in juvenile goats. PloS One 15, e0229463.
Neurath, M.F., 2014. Cytokines in inflammatory bowel disease. Nat. Rev. Immunol. 14, 329–342.
Overgaard, C.E., Daugherty, B.L., Mitchell, L.A., Koval, M., 2011. Claudins: control of barrier function and regulation in response to oxidant stress. Antioxidants Redox Signal. 15, 1179–1193.
Pageot, L.P., Perreault, N., Basora, N., Francoeur, C., Magny, P., Beaulieu, J.F., 2000.
Human cell models to study small intestinal functions: recapitulation of the crypt- villus axis. Microsc. Res. Tech. 49, 394–406.
Pathmakanthan, S., Hawkey, C.J., 2000. A lay doctor’s guide to the inflammatory process in the gastrointestinal tract. Postgrad. Med. 76, 611–617.
Pestka, J.J., 2010. Deoxynivalenol: mechanisms of action, human exposure, and toxicological relevance. Arch. Toxicol. 84, 663–679.
Pinton, P., Nougayr`ede, J.P., Del Rio, J.C., Moreno, C., Marin, D.E., Ferrier, L., Bracarense, A.P., Kolf-Clauw, M., Oswald, I.P., 2009. The food contaminant deoxynivalenol, decreases intestinal barrier permeability and reduces claudin expression. Toxicol. Appl. Pharmacol. 237, 41–48.
Pinton, P., Oswald, I.P., 2014. Effect of deoxynivalenol and other Type B trichothecenes on the intestine: a review. Toxins 6, 1615–1643.
Pomothy, J.M., Barna, R.F., P´aszti, E.A., Babiczky, A., Sz´ ol´adi, ´ A., Jerzsele, ´ A., Gere, E.P., ´ 2020. Beneficial effects of rosmarinic acid on IPEC-J2 cells exposed to the combination of deoxynivalenol and T-2 toxin. Mediat. Inflamm. 22, 8880651.
Rao, R., 2008. Oxidative stress-induced disruption of epithelial and endothelial tight junctions. Front. Biosci. 13, 7210–7226.
Romero, A., Ares, I., Ramos, E., Castellano, V., Martínez, M., Martínez-Larra˜naga, M.R., Anad´on, A., Martínez, M.A., 2016. Mycotoxins modify the barrier function of Caco-2 cells through differential gene expression of specific claudin isoforms: protective effect of illite mineral clay. Toxicology 353–354, 21–33.
Sambuy, Y., De Angelis, I., Ranaldi, G., Scarino, M.L., Stammati, A., Zucco, F., 2005. The Caco-2 cell line as a model of the intestinal barrier: influence of cell and culture- related factors on Caco-2 cell functional characteristics. Cell Biol. Toxicol. 21, 1–26.
Schwartz, S., Beaulieu, J.F., Ruemmele, F.M., 2005. Interleukin-17 is a potent immuno- modulator and regulator of normal human intestinal epithelial cell growth. Biochem.
Biophys. Res. Commun. 337, 505–509.
Seyedian, S.S., Nokhostin, F., Malamir, M.D., 2019. A review of the diagnosis, prevention, and treatment methods of inflammatory bowel disease. J. Med. Life. 12, 113–122.
Sokolovi´c, M., Garaj-Vrhovac, V., Simpraga, B., 2008. T-2 toxin: incidence and toxicity in poultry. Arh. Hig. Rada. Toksikol. 59, 43–52.
Springler, A., Vrubel, G.J., Mayer, E., Schatzmayr, G., Novak, B., 2016. Effect of fusarium-derived metabolites on the barrier integrity of differentiated intestinal porcine epithelial cells (IPEC-J2). Toxins 8, 345.
Sudakin, D.L., 2003. Trichothecenes in the environment: relevance to human health.
Toxicol. Lett. 143, 97–107.
Takenaka, T., Harada, N., Kuze, J., Chiba, M., Iwao, T., Matsunaga, T., 2016. Application of a human intestinal epithelial cell monolayer to the prediction of oral drug absorption in humans as a superior alternative to the Caco-2 cell monolayer.
J. Pharmacol. Sci. 105, 915–924.
Van De Walle, J., Romier, B., Larondelle, Y., Schneider, Y.J., 2008. Influence of deoxynivalenol on NF-kappaB activation and IL-8 secretion in human intestinal Caco-2 cells. Toxicol. Lett. 177, 205–214.
Verbrugghe, E., Vandenbroucke, V., Dhaenens, M., Shearer, N., Goossens, J., De Saeger, S., Eeckhout, M., D’Herde, K., Thompson, A., Deforce, D., Boyen, F.,
Leyman, B., Van Parys, A., De Backer, P., Haesebrouck, F., Croubels, S., Pasmans, F., 2012. T-2 toxin induced Salmonella Typhimurium intoxication results in decreased Salmonella numbers in the cecum contents of pigs, despite marked effects on Salmonella-host cell interactions. Vet. Res. 43, 22.
Vitkus, S.J., Hanifin, S.A., McGee, D.W., 1998. Factors affecting Caco-2 intestinal epithelial cell interleukin-6 secretion. In Vitro Cell. Dev. Biol. Anim. 34, 660–664.
Wan, M.L.Y., Turner, P.C., Co, V.A., Wang, M.F., Amiri, K.M.A., El-Nezami, H., 2019.
Schisandrin A protects intestinal epithelial cells from deoxynivalenol-induced cytotoxicity, oxidative damage and inflammation. Sci. Rep. 9, 19173.
Zhao, B., Summers, F.A., Mason, R.P., 2012. Photooxidation of Amplex Red to resorufin:
implications of exposing the Amplex Red assay to light. Free Radic. Biol. Med. 53, 1080–1087.
Zinedine, A., Ma˜nes, J., 2009. Occurrence and legislation of mycotoxins in food and feed from Morocco. Food Contr. 20, 334–344.